| Param | Original file | Final file |
|---|---|---|
| Filename | modeM0/AS1A14_049T01_9000006552_56298cztM0_level2.fits | modeM0/AS1A14_049T01_9000006552_56298cztM0_level2_quad_clean.evt |
| Size (bytes) | 1,112,132,160 | 120,536,640 |
| Size | 1.0 GB | 115.0 MB |
| Events in quadrant A | 19,903,857 | 403,530 |
| Events in quadrant B | 5,495,292 | 975,528 |
| Events in quadrant C | 9,254,078 | 746,910 |
| Events in quadrant D | 5,738,388 | 828,382 |
| Mode SS | |||
|---|---|---|---|
| Quadrant | BADHDUFLAG | Total packets | Discarded packets |
| A | 0 | 206 | 0 |
| B | 0 | 206 | 0 |
| C | 0 | 206 | 0 |
| D | 0 | 206 | 0 |
| Mode M9 | |||
|---|---|---|---|
| Quadrant | BADHDUFLAG | Total packets | Discarded packets |
| A | 0 | 13 | 0 |
| B | 0 | 13 | 0 |
| C | 0 | 13 | 0 |
| D | 0 | 13 | 0 |
| Mode M0 | |||
|---|---|---|---|
| Quadrant | BADHDUFLAG | Total packets | Discarded packets |
| A | 0 | 66033 | 3 |
| B | 0 | 23646 | 2 |
| C | 0 | 34635 | 2 |
| D | 0 | 23978 | 2 |
| Quadrant | Total seconds | Saturated seconds | Saturation percentage |
|---|---|---|---|
| A | 10019 | 6150 | 61.383372% |
| B | 10020 | 293 | 2.924152% |
| C | 10020 | 1724 | 17.205589% |
| D | 10020 | 182 | 1.816367% |
Noise dominated data is calculated using 1-second bins in cleaned event files. If a bin has >2000 counts, and if more than 50% of those come from <1% of pixels, then it is considered to be noise-dominated and hence unusable.
| Quadrant | # 1 sec bins | Bins with >0 counts | Bins with >2000 counts | High rate bins dominated by noise | Noise dominated (total time) | Noise dominated (detector-on time) | Marked lightcurve |
|---|---|---|---|---|---|---|---|
| A | 11383 | 10018 | 5952 | 5952 | 52.29% | 59.41% |  |
| B | 11385 | 10021 | 198 | 198 | 1.74% | 1.98% |  |
| C | 11385 | 10020 | 1445 | 1445 | 12.69% | 14.42% | 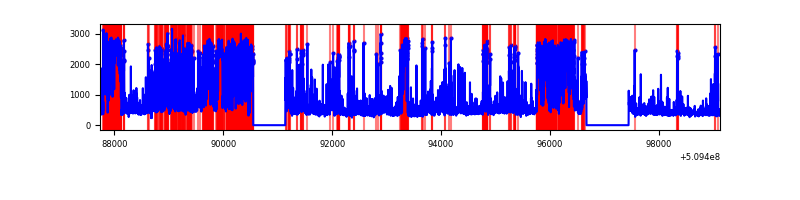 |
| D | 11385 | 10022 | 165 | 165 | 1.45% | 1.65% |  |
Top three noisy pixels from each quadrant. If the there are fewer than three noisy pixels in the level2.evt file, extra rows are filled as -1
| Pixel properties | Quadrant properties | ||||||
|---|---|---|---|---|---|---|---|
| Quadrant | DetID | PixID | Counts | Sigma | Mean | Median | Sigma |
| A | 15 | 32 | 14608355 | 82062.59 | 704 | 685 | 178.0 |
| A | 4 | 95 | 691001 | 3878.04 | 704 | 685 | 178.0 |
| A | 4 | 206 | 470034 | 2636.7 | 704 | 685 | 178.0 |
| B | 5 | 185 | 698951 | 3168.06 | 1040 | 1003 | 220.3 |
| B | 0 | 231 | 223623 | 1010.49 | 1040 | 1003 | 220.3 |
| B | 0 | 213 | 113502 | 510.64 | 1040 | 1003 | 220.3 |
| C | 15 | 198 | 2204194 | 8511.73 | 943 | 936 | 258.8 |
| C | 5 | 250 | 1075710 | 4152.12 | 943 | 936 | 258.8 |
| C | 12 | 252 | 857327 | 3308.45 | 943 | 936 | 258.8 |
| D | 2 | 249 | 591475 | 2042.75 | 1018 | 973 | 289.1 |
| D | 8 | 129 | 363776 | 1255.06 | 1018 | 973 | 289.1 |
| D | 2 | 31 | 147962 | 508.49 | 1018 | 973 | 289.1 |
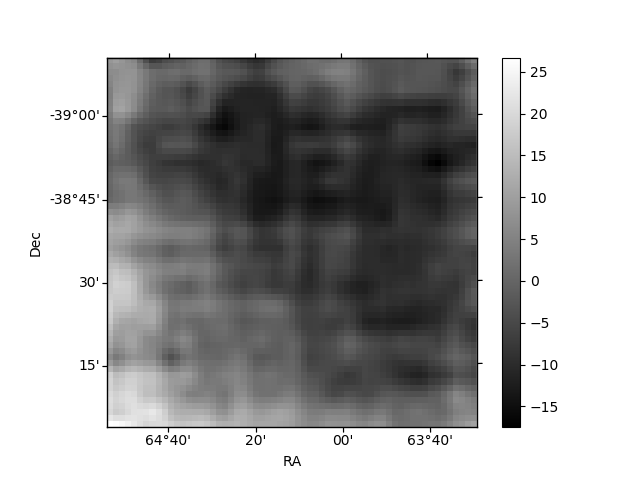
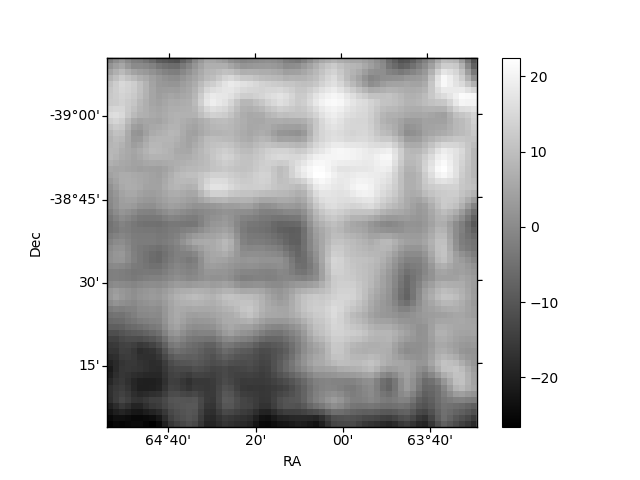
Histogram calculated using DETX and DETY for each event in the final _common_clean file
| Quadrant A | 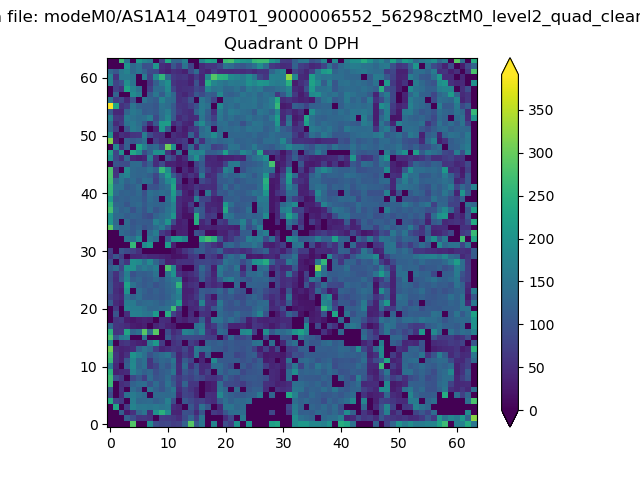 |
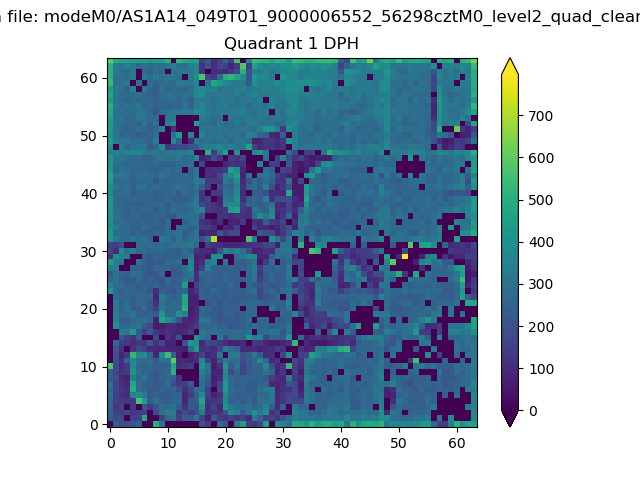 |
Quadrant B |
|---|---|---|---|
| Quadrant D | 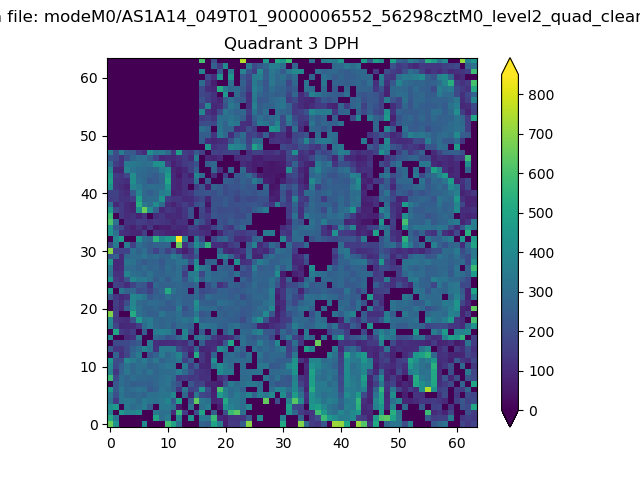 |
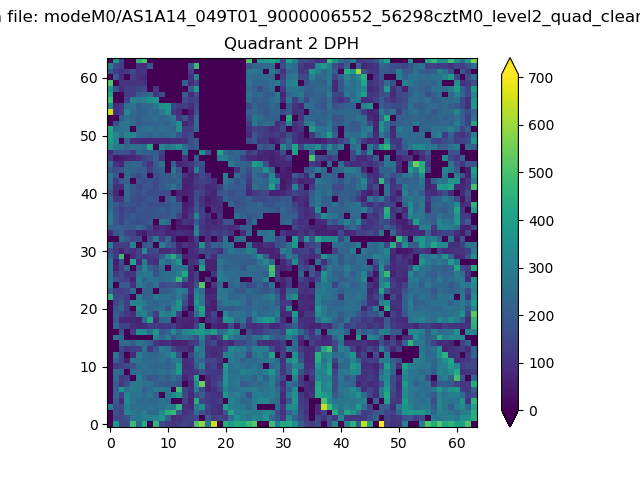 |
Quadrant C |
| Plot type | Count rate plots | Images |
|---|---|---|
| Comparison with Poisson distribution Blue bars denote a histogram of data divided into 1 sec bins. Red curve is a Poisson curve with rate = median count rate of data. |
 |
 |
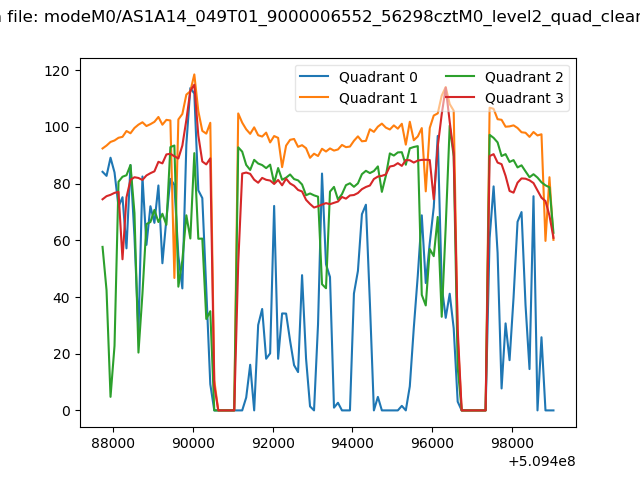
| Quadrant-wise count rates Data is divided into 100 sec bins |
 |
|
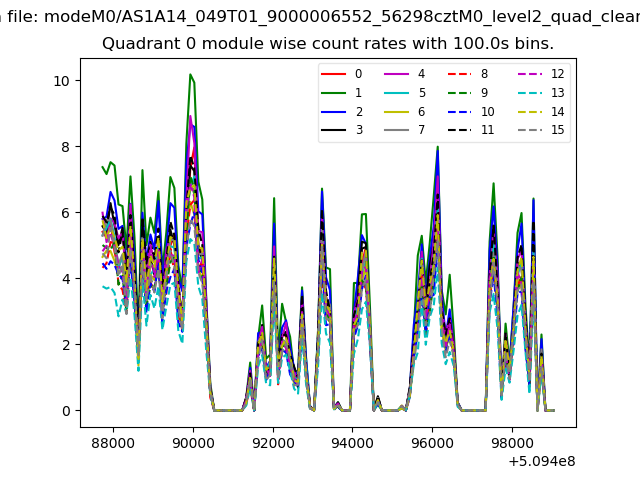
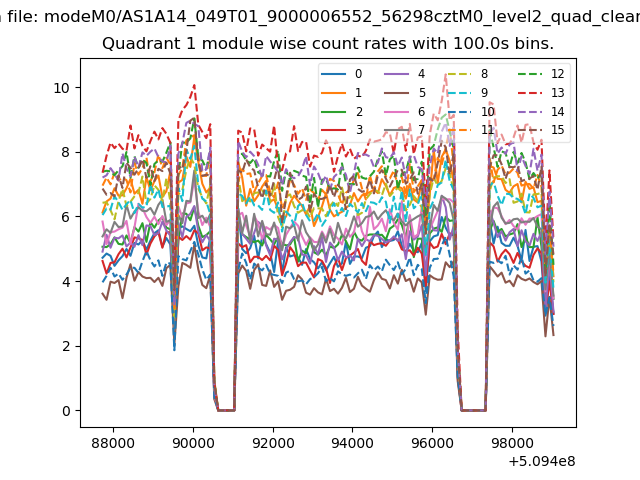
| Module-wise count rates for Quadrant A Data is divided into 100 sec bins |
 |
 |
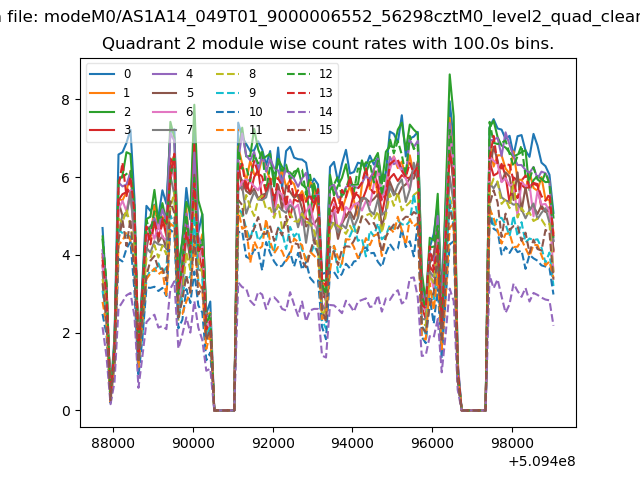
| Module-wise count rates for Quadrant B Data is divided into 100 sec bins |
 |
 |
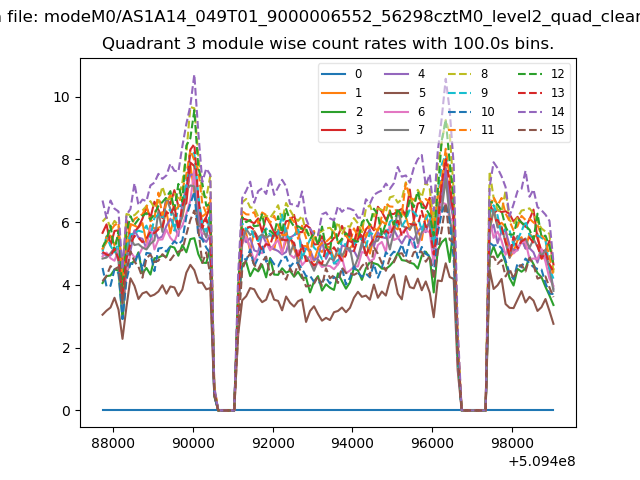
| Module-wise count rates for Quadrant C Data is divided into 100 sec bins |
 |
 |
| Module-wise count rates for Quadrant D Data is divided into 100 sec bins |
 |
 |
| Parameter | Plot |
|---|---|
| CZT HV Monitor |  |
| D_VDD | 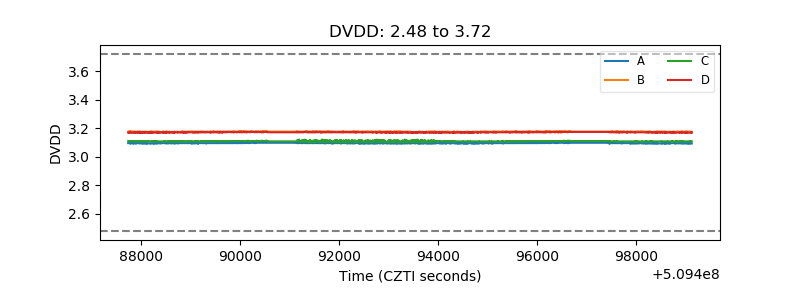 |
| Temperature 1 | 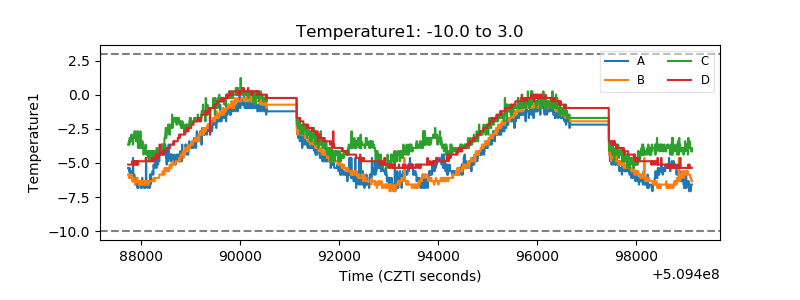 |
| Veto HV Monitor | 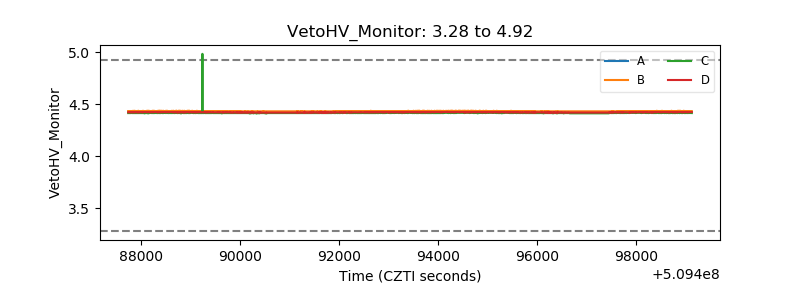 |
| Veto LLD | 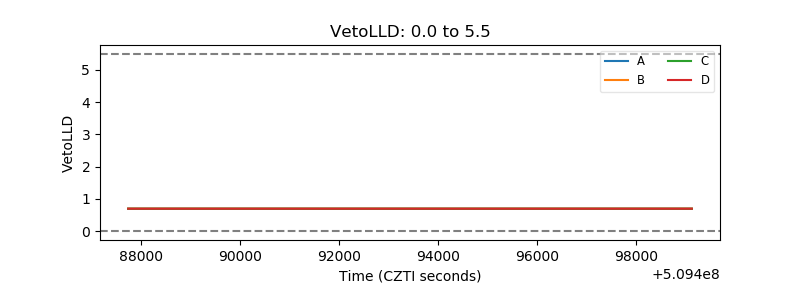 |
| Alpha Counter |  |
| _CPM_Rate |  |
| CZT Counter | 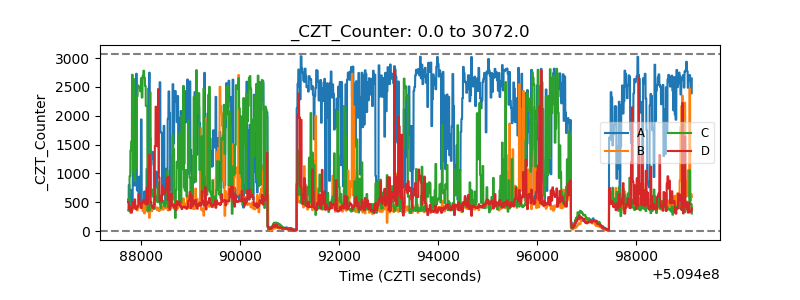 |
| +2.5 Volts monitor | 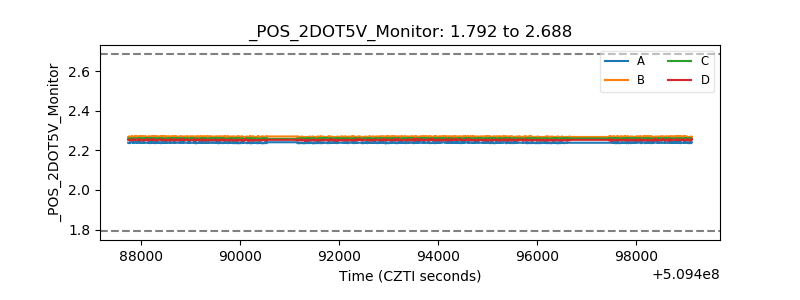 |
| +5 Volts monitor |  |
| _ROLL_ROT | 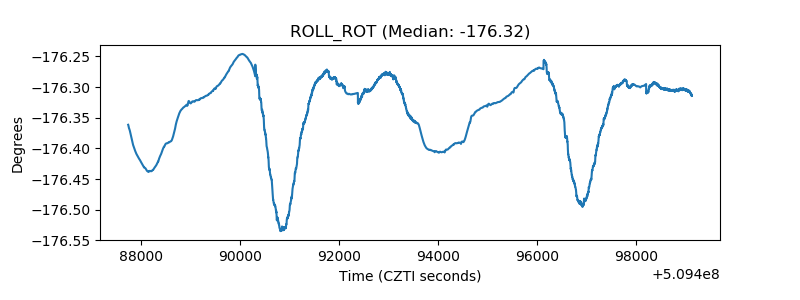 |
| _Roll_DEC | 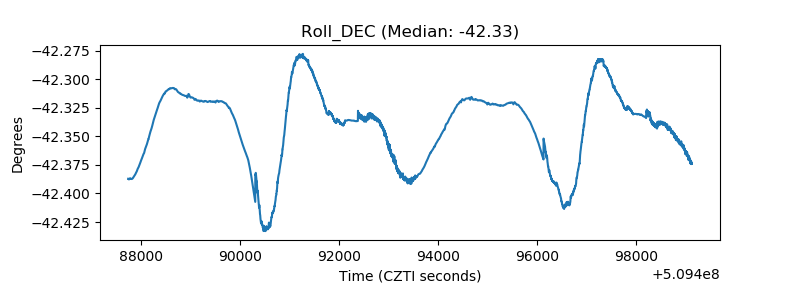 |
| _Roll_RA |  |
| Veto Counter | 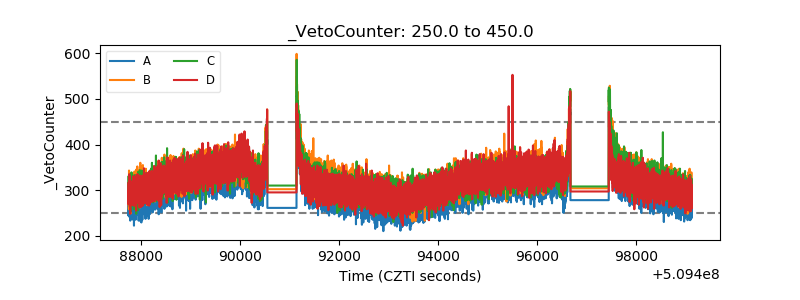 |