| Param | Original file | Final file |
|---|---|---|
| Filename | modeM0/AS1A14_049T01_9000006552_56301cztM0_level2.fits | modeM0/AS1A14_049T01_9000006552_56301cztM0_level2_quad_clean.evt |
| Size (bytes) | 740,157,120 | 80,366,400 |
| Size | 705.9 MB | 76.6 MB |
| Events in quadrant A | 12,639,390 | 281,663 |
| Events in quadrant B | 5,321,022 | 599,713 |
| Events in quadrant C | 5,111,227 | 549,969 |
| Events in quadrant D | 3,823,810 | 549,813 |
| Mode SS | |||
|---|---|---|---|
| Quadrant | BADHDUFLAG | Total packets | Discarded packets |
| A | 0 | 132 | 0 |
| B | 0 | 132 | 0 |
| C | 0 | 132 | 0 |
| D | 0 | 132 | 0 |
| Mode M9 | |||
|---|---|---|---|
| Quadrant | BADHDUFLAG | Total packets | Discarded packets |
| A | 0 | 10 | 0 |
| B | 0 | 10 | 0 |
| C | 0 | 10 | 0 |
| D | 0 | 10 | 0 |
| Mode M0 | |||
|---|---|---|---|
| Quadrant | BADHDUFLAG | Total packets | Discarded packets |
| A | 0 | 42068 | 9 |
| B | 0 | 20342 | 1 |
| C | 0 | 19832 | 1 |
| D | 0 | 15996 | 1 |
| Quadrant | Total seconds | Saturated seconds | Saturation percentage |
|---|---|---|---|
| A | 6479 | 3790 | 58.496682% |
| B | 6479 | 894 | 13.798426% |
| C | 6480 | 689 | 10.632716% |
| D | 6480 | 145 | 2.237654% |
Noise dominated data is calculated using 1-second bins in cleaned event files. If a bin has >2000 counts, and if more than 50% of those come from <1% of pixels, then it is considered to be noise-dominated and hence unusable.
| Quadrant | # 1 sec bins | Bins with >0 counts | Bins with >2000 counts | High rate bins dominated by noise | Noise dominated (total time) | Noise dominated (detector-on time) | Marked lightcurve |
|---|---|---|---|---|---|---|---|
| A | 7504 | 6480 | 3728 | 3728 | 49.68% | 57.53% |  |
| B | 7503 | 6479 | 673 | 673 | 8.97% | 10.39% | 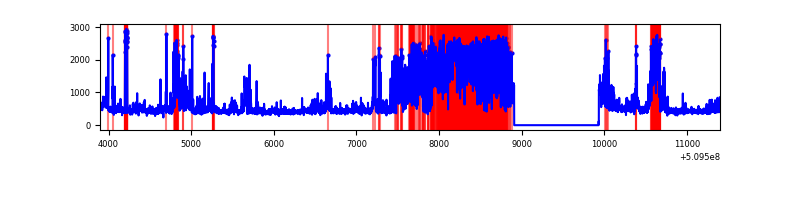 |
| C | 7505 | 6481 | 548 | 548 | 7.30% | 8.46% | 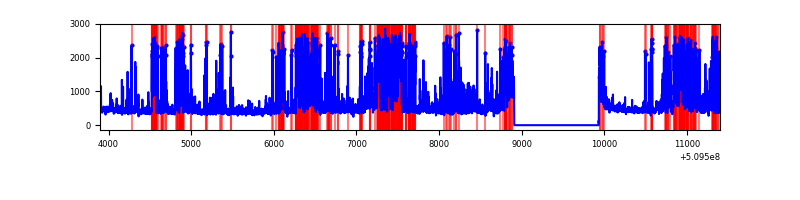 |
| D | 7505 | 6481 | 123 | 123 | 1.64% | 1.90% |  |
Top three noisy pixels from each quadrant. If the there are fewer than three noisy pixels in the level2.evt file, extra rows are filled as -1
| Pixel properties | Quadrant properties | ||||||
|---|---|---|---|---|---|---|---|
| Quadrant | DetID | PixID | Counts | Sigma | Mean | Median | Sigma |
| A | 15 | 32 | 7555827 | 62675.16 | 481 | 470 | 120.5 |
| A | 7 | 64 | 2225154 | 18454.78 | 481 | 470 | 120.5 |
| A | 4 | 249 | 357679 | 2963.21 | 481 | 470 | 120.5 |
| B | 5 | 172 | 1945993 | 13753.19 | 654 | 629 | 141.4 |
| B | 5 | 185 | 404915 | 2858.19 | 654 | 629 | 141.4 |
| B | 0 | 231 | 82296 | 577.36 | 654 | 629 | 141.4 |
| C | 5 | 250 | 1654475 | 9290.17 | 645 | 640 | 178.0 |
| C | 12 | 252 | 390847 | 2191.93 | 645 | 640 | 178.0 |
| C | 5 | 233 | 274312 | 1537.31 | 645 | 640 | 178.0 |
| D | 2 | 249 | 496083 | 2631.34 | 663 | 631 | 188.3 |
| D | 2 | 31 | 347370 | 1841.53 | 663 | 631 | 188.3 |
| D | 2 | 120 | 68051 | 358.07 | 663 | 631 | 188.3 |
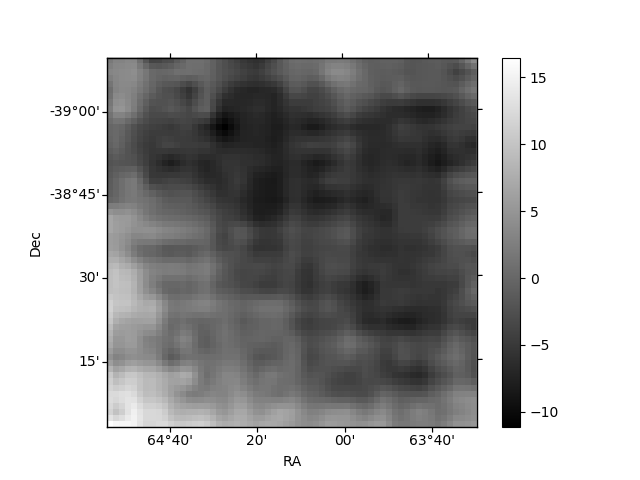
Histogram calculated using DETX and DETY for each event in the final _common_clean file
| Quadrant A | 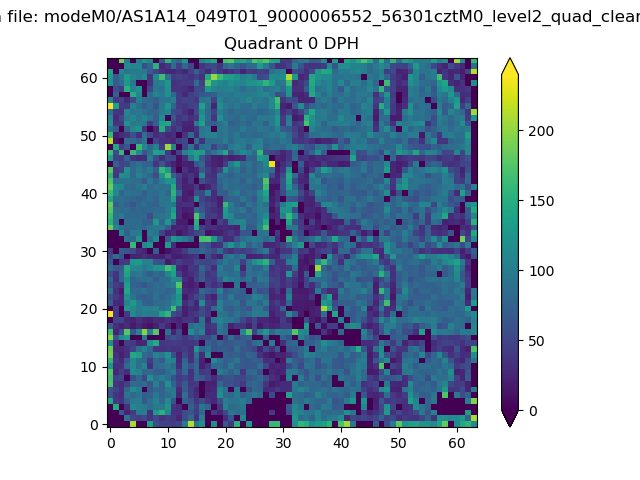 |
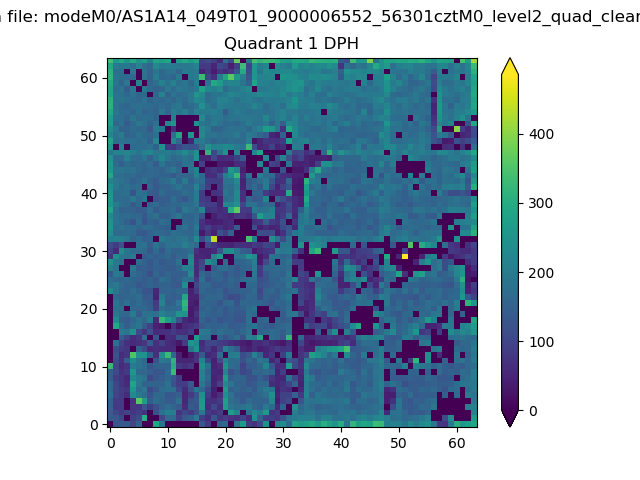 |
Quadrant B |
|---|---|---|---|
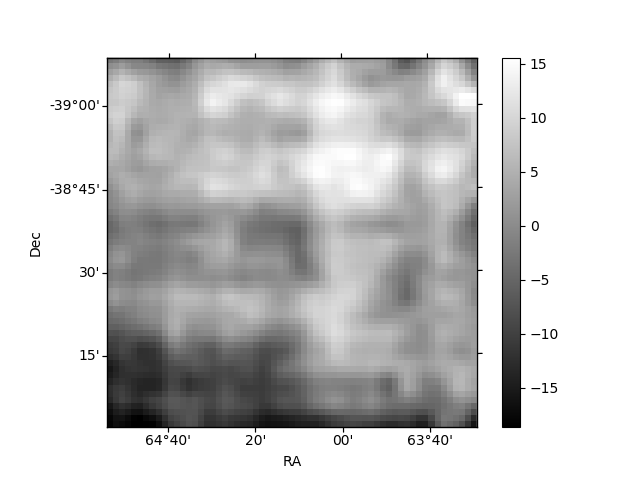
| Quadrant D | 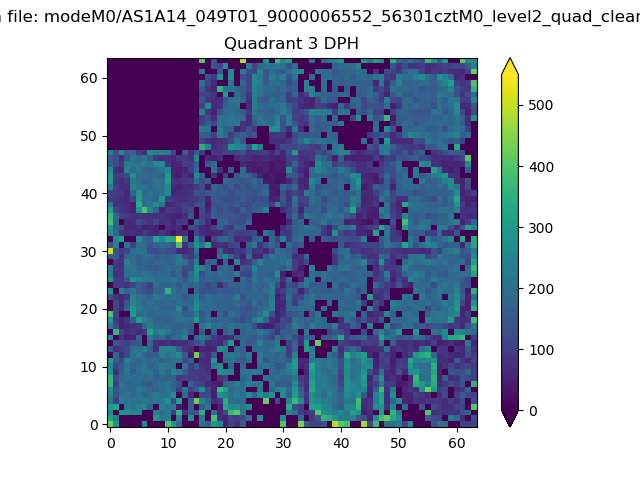 |
 |
Quadrant C |
| Plot type | Count rate plots | Images |
|---|---|---|
| Comparison with Poisson distribution Blue bars denote a histogram of data divided into 1 sec bins. Red curve is a Poisson curve with rate = median count rate of data. |
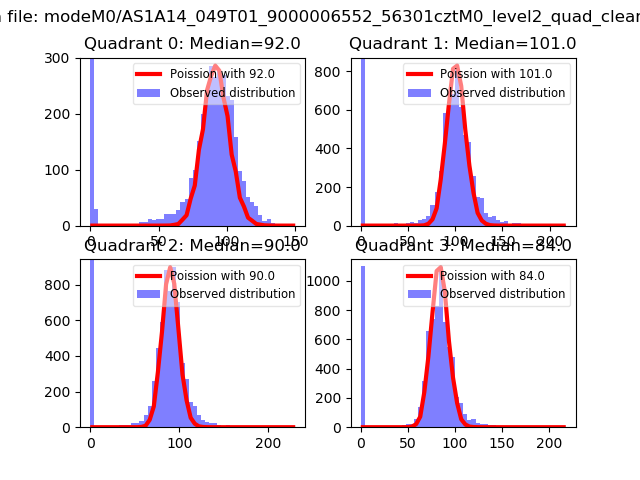 |
 |
| Quadrant-wise count rates Data is divided into 100 sec bins |
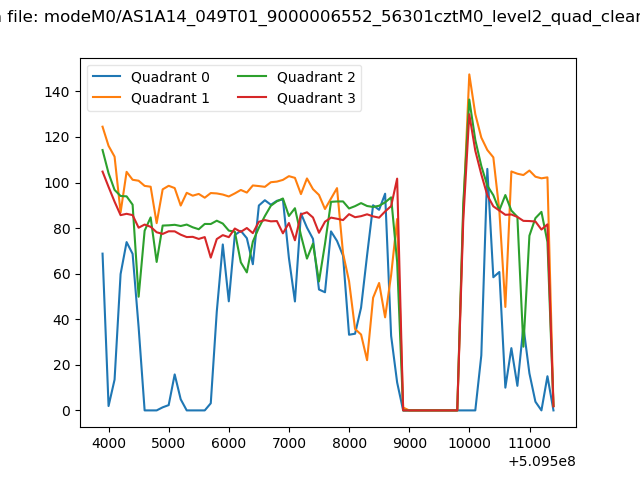 |
|
| Module-wise count rates for Quadrant A Data is divided into 100 sec bins |
 |
 |
| Module-wise count rates for Quadrant B Data is divided into 100 sec bins |
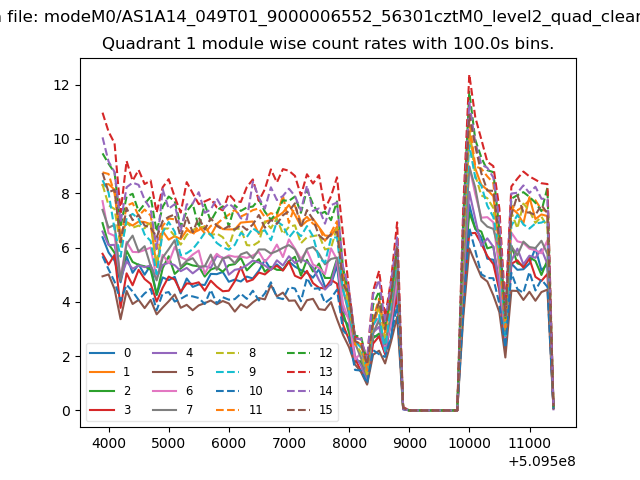 |
 |
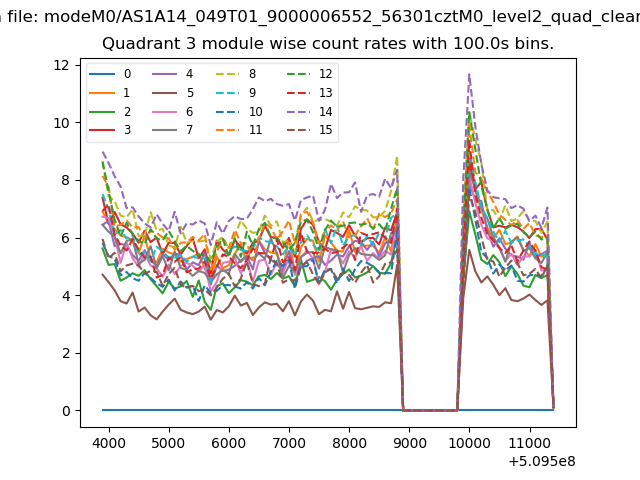
| Module-wise count rates for Quadrant C Data is divided into 100 sec bins |
 |
 |
| Module-wise count rates for Quadrant D Data is divided into 100 sec bins |
 |
 |
| Parameter | Plot |
|---|---|
| CZT HV Monitor | 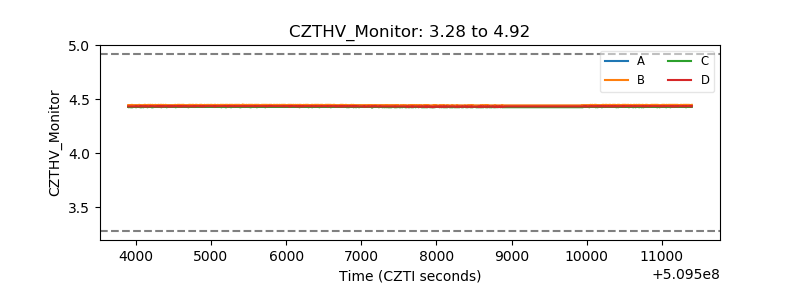 |
| D_VDD |  |
| Temperature 1 |  |
| Veto HV Monitor | 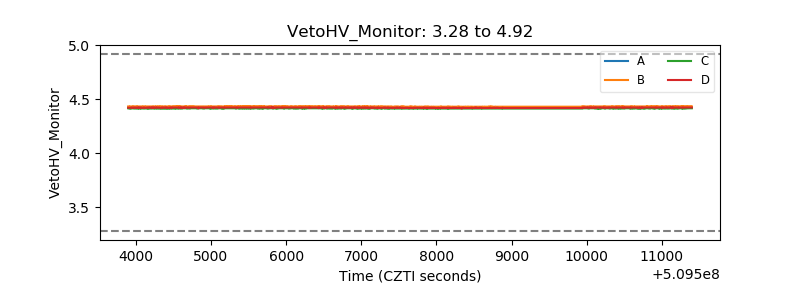 |
| Veto LLD | 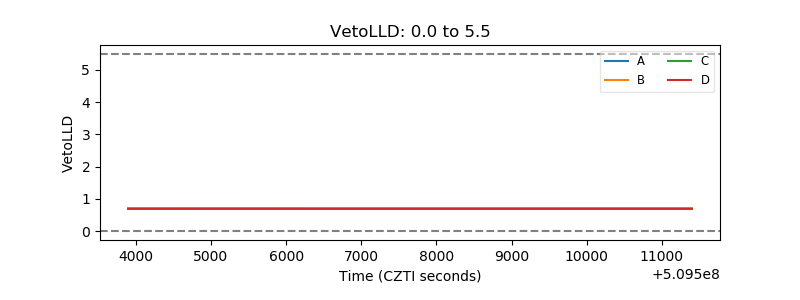 |
| Alpha Counter |  |
| _CPM_Rate | 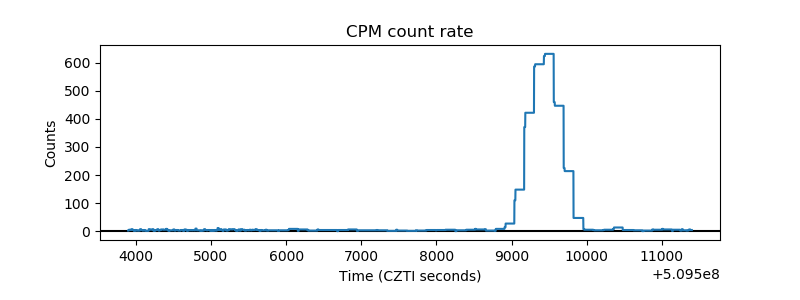 |
| CZT Counter |  |
| +2.5 Volts monitor |  |
| +5 Volts monitor | 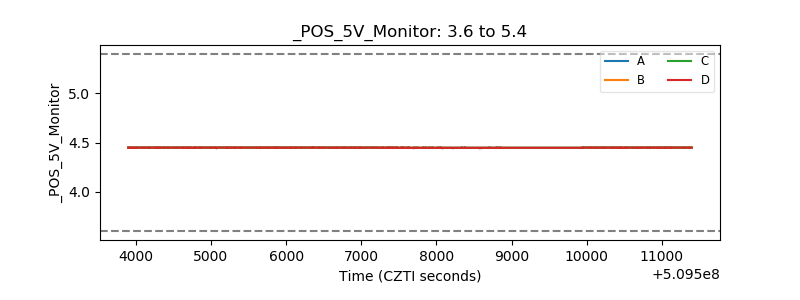 |
| _ROLL_ROT | 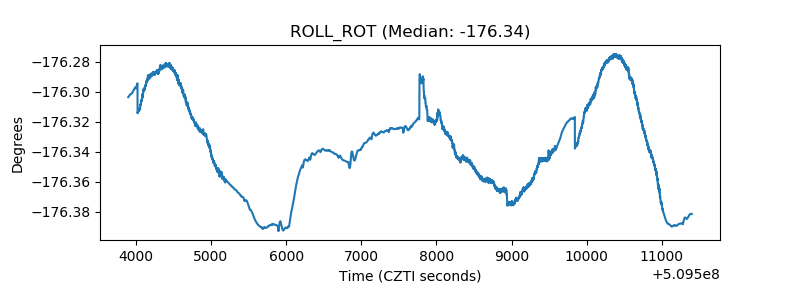 |
| _Roll_DEC | 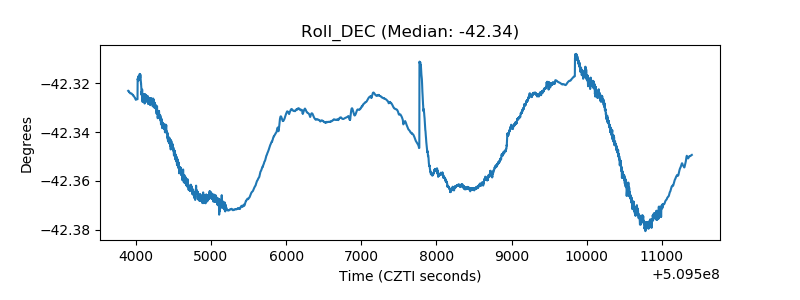 |
| _Roll_RA |  |
| Veto Counter | 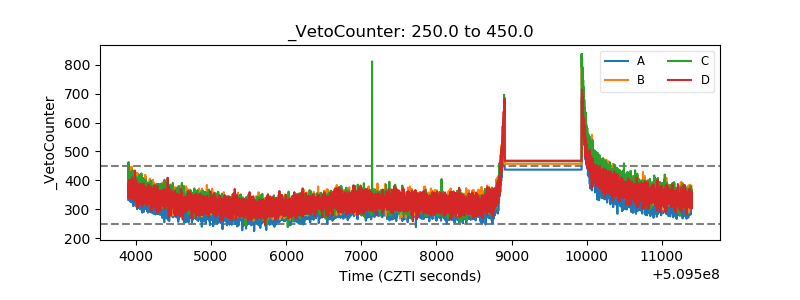 |