| Param | Original file | Final file |
|---|---|---|
| Filename | modeM0/AS1A14_049T01_9000006552_56302cztM0_level2.fits | modeM0/AS1A14_049T01_9000006552_56302cztM0_level2_quad_clean.evt |
| Size (bytes) | 701,991,360 | 84,648,960 |
| Size | 669.5 MB | 80.7 MB |
| Events in quadrant A | 12,362,604 | 301,928 |
| Events in quadrant B | 4,124,542 | 670,661 |
| Events in quadrant C | 4,786,115 | 580,466 |
| Events in quadrant D | 4,207,181 | 555,868 |
| Mode SS | |||
|---|---|---|---|
| Quadrant | BADHDUFLAG | Total packets | Discarded packets |
| A | 0 | 132 | 0 |
| B | 0 | 132 | 0 |
| C | 0 | 132 | 0 |
| D | 0 | 132 | 0 |
| Mode M9 | |||
|---|---|---|---|
| Quadrant | BADHDUFLAG | Total packets | Discarded packets |
| A | 0 | 11 | 0 |
| B | 0 | 11 | 0 |
| C | 0 | 11 | 0 |
| D | 0 | 11 | 0 |
| Mode M0 | |||
|---|---|---|---|
| Quadrant | BADHDUFLAG | Total packets | Discarded packets |
| A | 0 | 41235 | 1 |
| B | 0 | 16883 | 1 |
| C | 0 | 18793 | 1 |
| D | 0 | 17043 | 1 |
| Quadrant | Total seconds | Saturated seconds | Saturation percentage |
|---|---|---|---|
| A | 6509 | 3697 | 56.798279% |
| B | 6509 | 337 | 5.177447% |
| C | 6509 | 548 | 8.419112% |
| D | 6509 | 269 | 4.132739% |
Noise dominated data is calculated using 1-second bins in cleaned event files. If a bin has >2000 counts, and if more than 50% of those come from <1% of pixels, then it is considered to be noise-dominated and hence unusable.
| Quadrant | # 1 sec bins | Bins with >0 counts | Bins with >2000 counts | High rate bins dominated by noise | Noise dominated (total time) | Noise dominated (detector-on time) | Marked lightcurve |
|---|---|---|---|---|---|---|---|
| A | 7604 | 6510 | 3494 | 3494 | 45.95% | 53.67% | 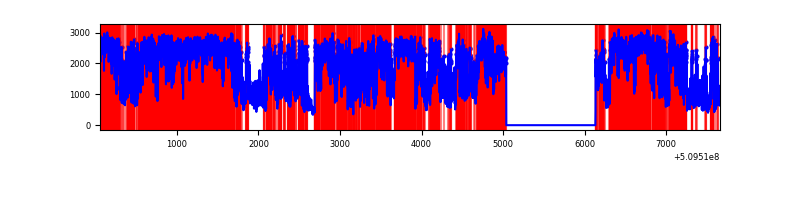 |
| B | 7604 | 6510 | 171 | 171 | 2.25% | 2.63% | 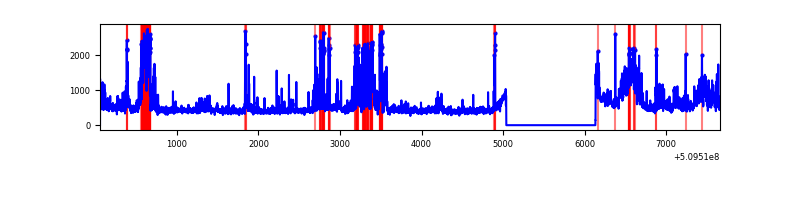 |
| C | 7604 | 6510 | 379 | 379 | 4.98% | 5.82% | 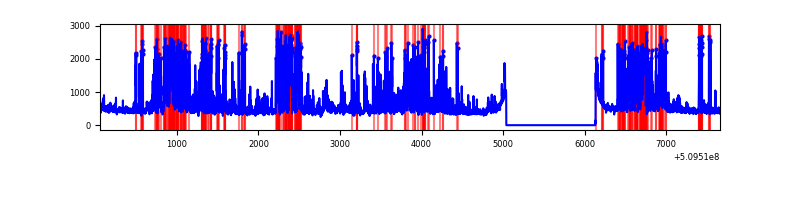 |
| D | 7604 | 6510 | 240 | 240 | 3.16% | 3.69% | 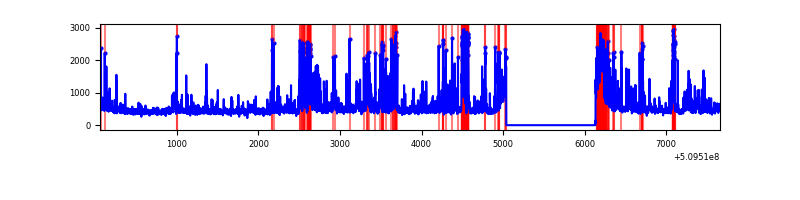 |
Top three noisy pixels from each quadrant. If the there are fewer than three noisy pixels in the level2.evt file, extra rows are filled as -1
| Pixel properties | Quadrant properties | ||||||
|---|---|---|---|---|---|---|---|
| Quadrant | DetID | PixID | Counts | Sigma | Mean | Median | Sigma |
| A | 15 | 32 | 8564123 | 65958.81 | 515 | 502 | 129.8 |
| A | 7 | 64 | 673986 | 5187.32 | 515 | 502 | 129.8 |
| A | 4 | 206 | 236473 | 1817.5 | 515 | 502 | 129.8 |
| B | 5 | 185 | 730033 | 4919.19 | 696 | 669 | 148.3 |
| B | 5 | 172 | 387650 | 2609.99 | 696 | 669 | 148.3 |
| B | 10 | 247 | 61615 | 411.05 | 696 | 669 | 148.3 |
| C | 5 | 250 | 1398907 | 7591.17 | 675 | 668 | 184.2 |
| C | 12 | 252 | 251491 | 1361.74 | 675 | 668 | 184.2 |
| C | 15 | 198 | 209444 | 1133.46 | 675 | 668 | 184.2 |
| D | 8 | 160 | 535007 | 2788.59 | 677 | 647 | 191.6 |
| D | 2 | 249 | 482979 | 2517.08 | 677 | 647 | 191.6 |
| D | 3 | 144 | 99008 | 513.3 | 677 | 647 | 191.6 |
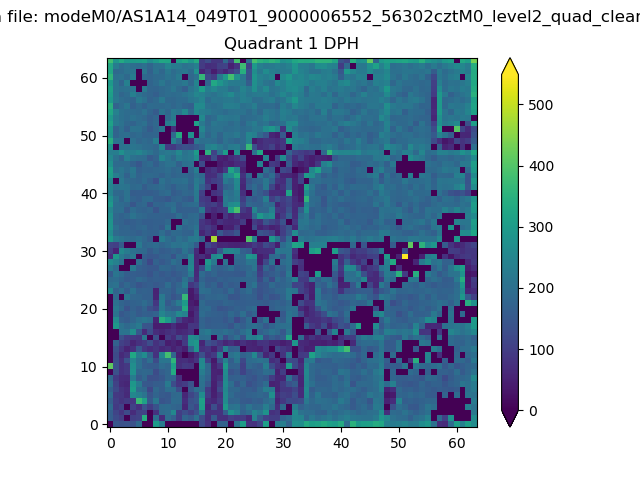
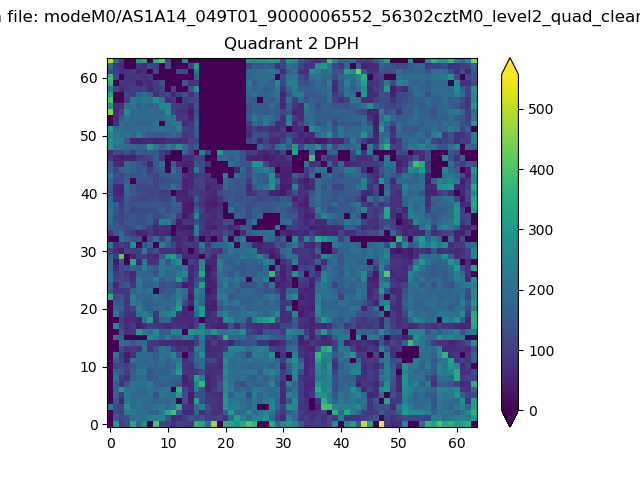
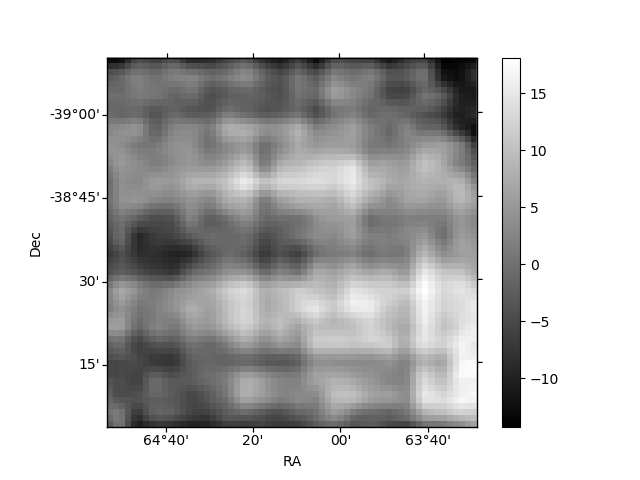
Histogram calculated using DETX and DETY for each event in the final _common_clean file
| Quadrant A |  |
 |
Quadrant B |
|---|---|---|---|
| Quadrant D |  |
 |
Quadrant C |
| Plot type | Count rate plots | Images |
|---|---|---|
| Comparison with Poisson distribution Blue bars denote a histogram of data divided into 1 sec bins. Red curve is a Poisson curve with rate = median count rate of data. |
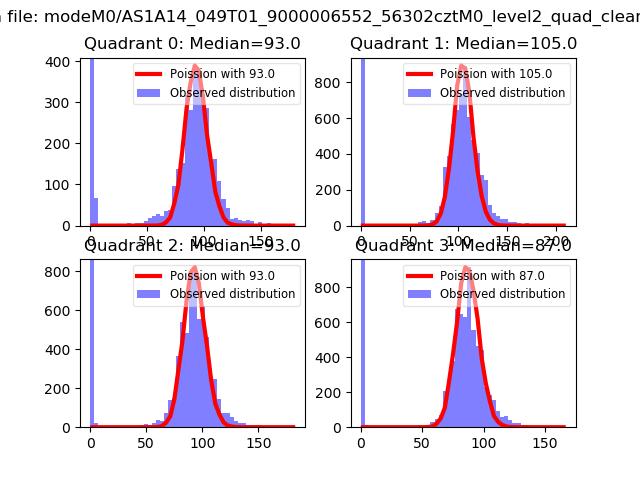 |
 |
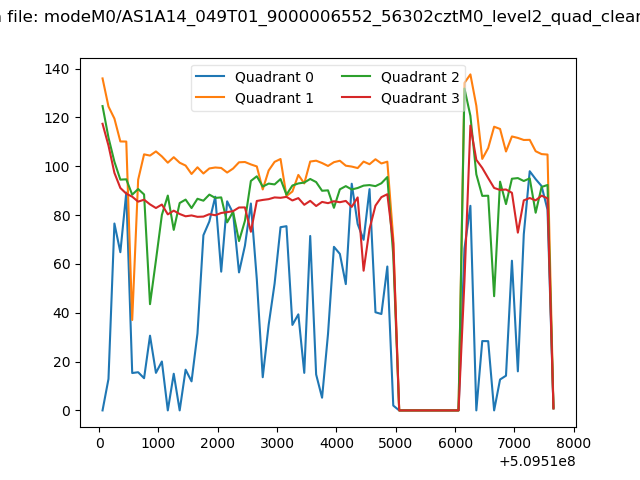
| Quadrant-wise count rates Data is divided into 100 sec bins |
 |
|
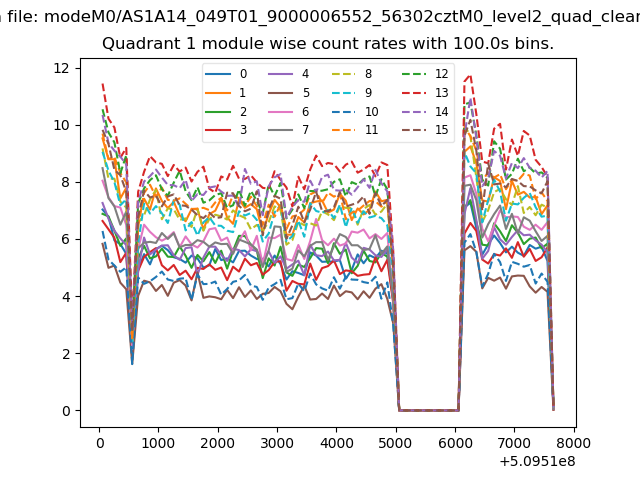
| Module-wise count rates for Quadrant A Data is divided into 100 sec bins |
 |
 |
| Module-wise count rates for Quadrant B Data is divided into 100 sec bins |
 |
 |
| Module-wise count rates for Quadrant C Data is divided into 100 sec bins |
 |
 |
| Module-wise count rates for Quadrant D Data is divided into 100 sec bins |
 |
 |
| Parameter | Plot |
|---|---|
| CZT HV Monitor | 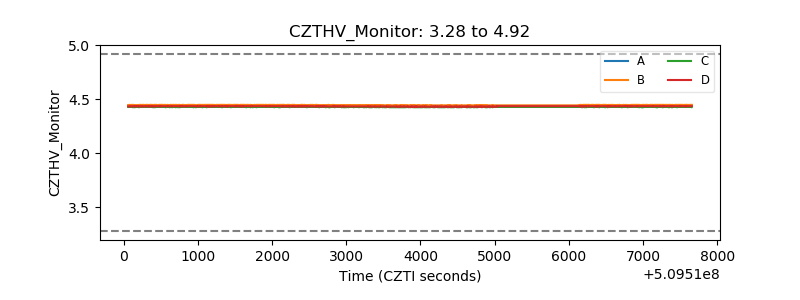 |
| D_VDD |  |
| Temperature 1 |  |
| Veto HV Monitor |  |
| Veto LLD |  |
| Alpha Counter |  |
| _CPM_Rate | 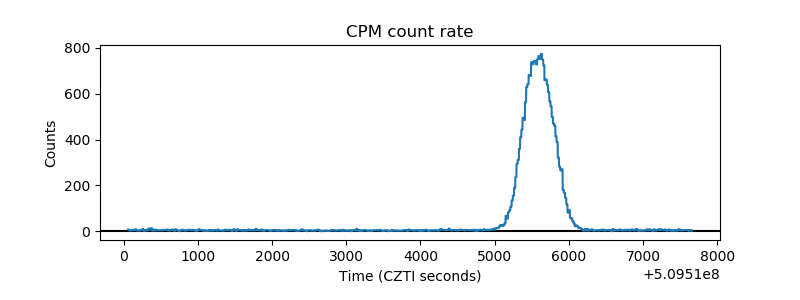 |
| CZT Counter | 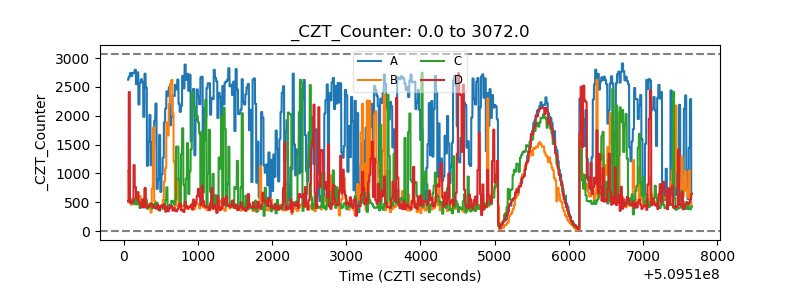 |
| +2.5 Volts monitor | 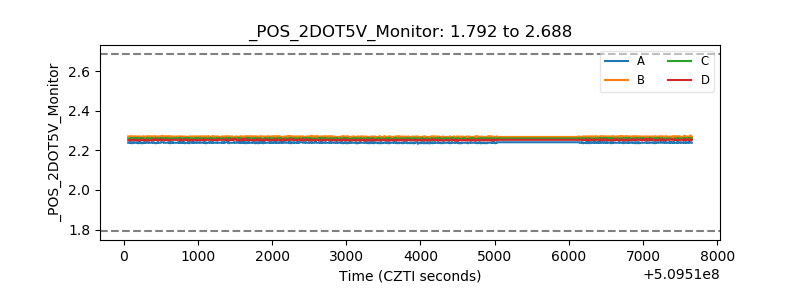 |
| +5 Volts monitor |  |
| _ROLL_ROT |  |
| _Roll_DEC |  |
| _Roll_RA | 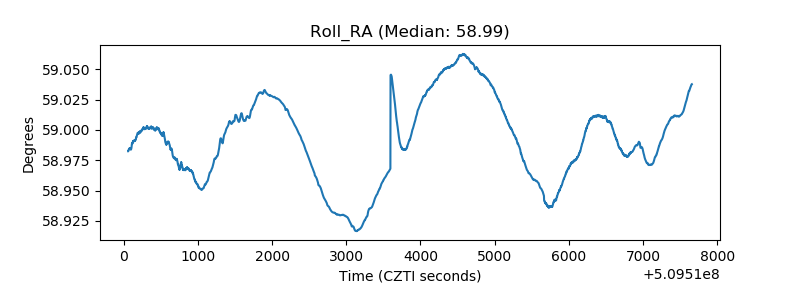 |
| Veto Counter |  |