| Param | Original file | Final file |
|---|---|---|
| Filename | modeM0/AS1A14_049T01_9000006552_56303cztM0_level2.fits | modeM0/AS1A14_049T01_9000006552_56303cztM0_level2_quad_clean.evt |
| Size (bytes) | 646,185,600 | 83,113,920 |
| Size | 616.3 MB | 79.3 MB |
| Events in quadrant A | 11,570,243 | 322,817 |
| Events in quadrant B | 4,415,542 | 649,888 |
| Events in quadrant C | 4,202,656 | 566,633 |
| Events in quadrant D | 3,250,640 | 545,242 |
| Mode SS | |||
|---|---|---|---|
| Quadrant | BADHDUFLAG | Total packets | Discarded packets |
| A | 0 | 124 | 0 |
| B | 0 | 124 | 0 |
| C | 0 | 124 | 0 |
| D | 0 | 124 | 0 |
| Mode M9 | |||
|---|---|---|---|
| Quadrant | BADHDUFLAG | Total packets | Discarded packets |
| A | 0 | 12 | 0 |
| B | 0 | 12 | 0 |
| C | 0 | 12 | 0 |
| D | 0 | 12 | 0 |
| Mode M0 | |||
|---|---|---|---|
| Quadrant | BADHDUFLAG | Total packets | Discarded packets |
| A | 0 | 38662 | 1 |
| B | 0 | 17130 | 1 |
| C | 0 | 16920 | 1 |
| D | 0 | 13934 | 1 |
| Quadrant | Total seconds | Saturated seconds | Saturation percentage |
|---|---|---|---|
| A | 6193 | 3250 | 52.478605% |
| B | 6193 | 286 | 4.618117% |
| C | 6194 | 402 | 6.490152% |
| D | 6194 | 124 | 2.001937% |
Noise dominated data is calculated using 1-second bins in cleaned event files. If a bin has >2000 counts, and if more than 50% of those come from <1% of pixels, then it is considered to be noise-dominated and hence unusable.
| Quadrant | # 1 sec bins | Bins with >0 counts | Bins with >2000 counts | High rate bins dominated by noise | Noise dominated (total time) | Noise dominated (detector-on time) | Marked lightcurve |
|---|---|---|---|---|---|---|---|
| A | 7353 | 6194 | 3125 | 3125 | 42.50% | 50.45% | 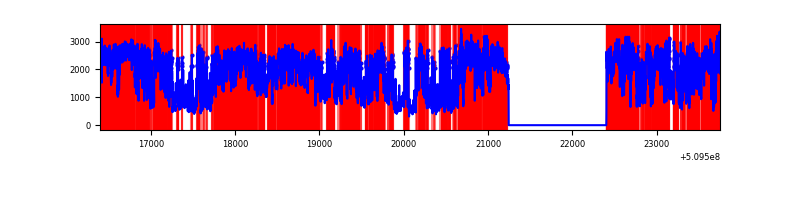 |
| B | 7353 | 6194 | 139 | 139 | 1.89% | 2.24% | 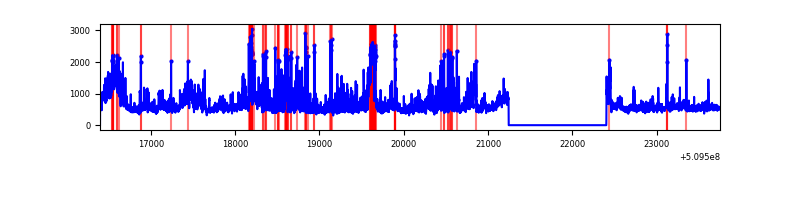 |
| C | 7354 | 6195 | 269 | 269 | 3.66% | 4.34% |  |
| D | 7354 | 6195 | 43 | 43 | 0.58% | 0.69% | 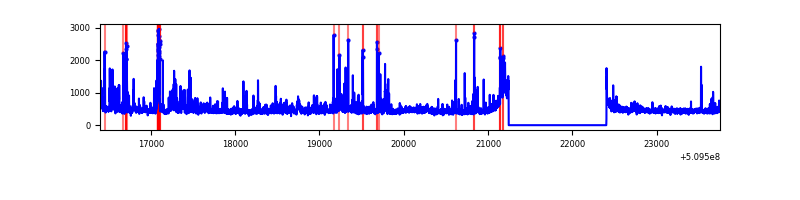 |
Top three noisy pixels from each quadrant. If the there are fewer than three noisy pixels in the level2.evt file, extra rows are filled as -1
| Pixel properties | Quadrant properties | ||||||
|---|---|---|---|---|---|---|---|
| Quadrant | DetID | PixID | Counts | Sigma | Mean | Median | Sigma |
| A | 15 | 32 | 4437018 | 34304.51 | 519 | 507 | 129.3 |
| A | 12 | 115 | 1305512 | 10090.71 | 519 | 507 | 129.3 |
| A | 4 | 95 | 1292650 | 9991.26 | 519 | 507 | 129.3 |
| B | 5 | 172 | 866562 | 6024.79 | 673 | 648 | 143.7 |
| B | 5 | 185 | 447883 | 3111.74 | 673 | 648 | 143.7 |
| B | 0 | 183 | 131576 | 910.96 | 673 | 648 | 143.7 |
| C | 5 | 250 | 983566 | 5470.39 | 657 | 651 | 179.7 |
| C | 15 | 198 | 210337 | 1167.0 | 657 | 651 | 179.7 |
| C | 12 | 252 | 179558 | 995.7 | 657 | 651 | 179.7 |
| D | 8 | 160 | 144639 | 777.97 | 658 | 628 | 185.1 |
| D | 2 | 120 | 121147 | 651.06 | 658 | 628 | 185.1 |
| D | 2 | 249 | 91921 | 493.18 | 658 | 628 | 185.1 |
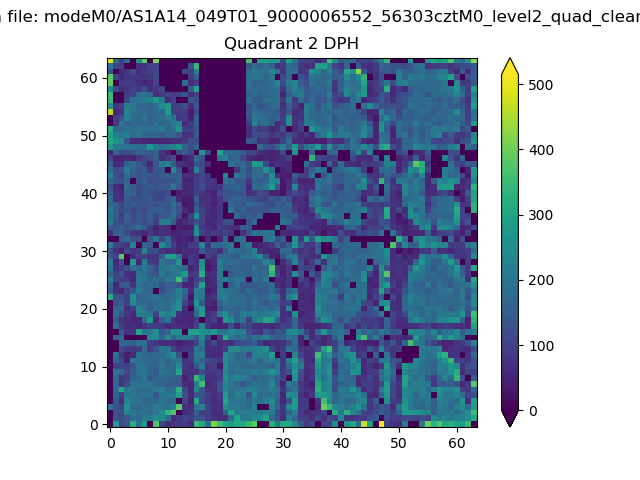
Histogram calculated using DETX and DETY for each event in the final _common_clean file
| Quadrant A | 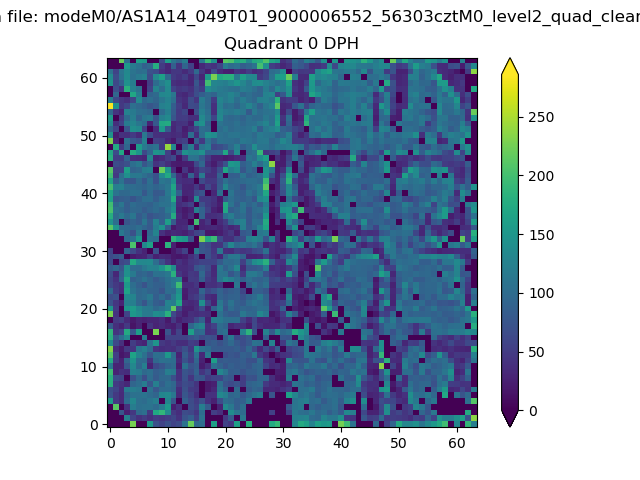 |
 |
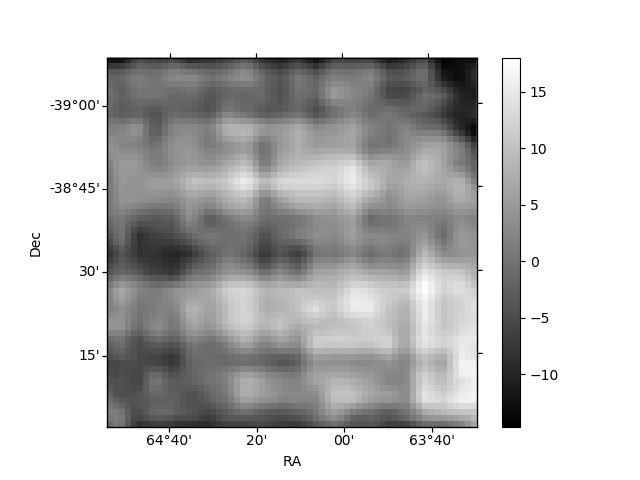
Quadrant B |
|---|---|---|---|
| Quadrant D | 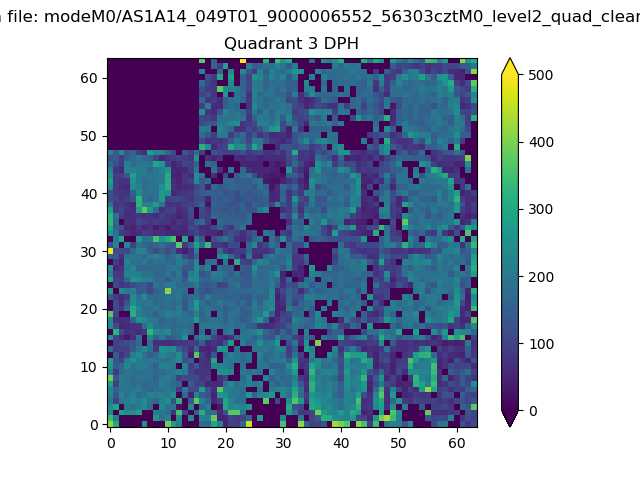 |
 |
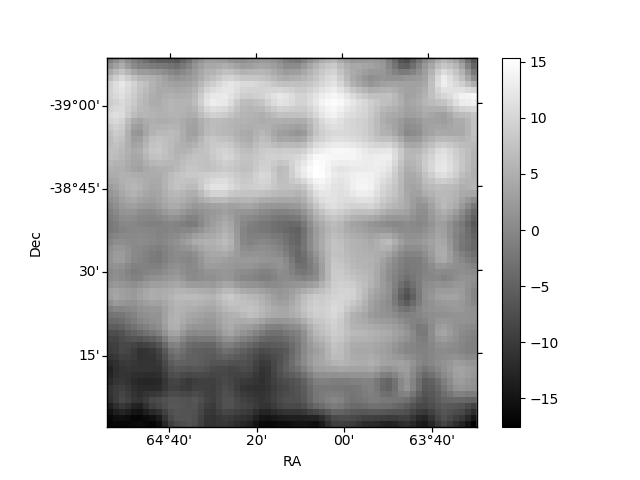
Quadrant C |
| Plot type | Count rate plots | Images |
|---|---|---|
| Comparison with Poisson distribution Blue bars denote a histogram of data divided into 1 sec bins. Red curve is a Poisson curve with rate = median count rate of data. |
 |
 |
| Quadrant-wise count rates Data is divided into 100 sec bins |
 |
|
| Module-wise count rates for Quadrant A Data is divided into 100 sec bins |
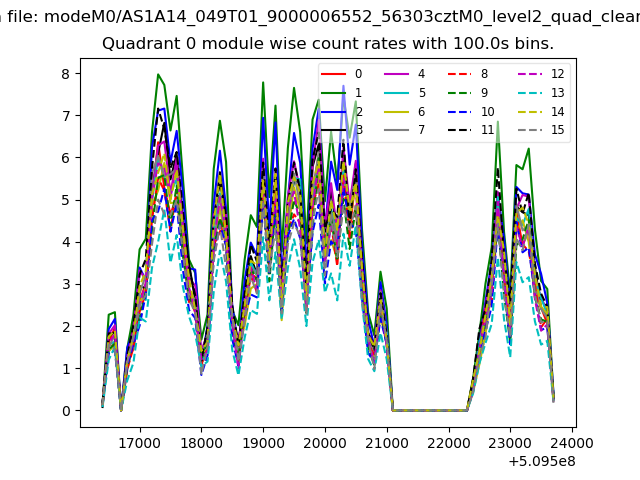 |
 |
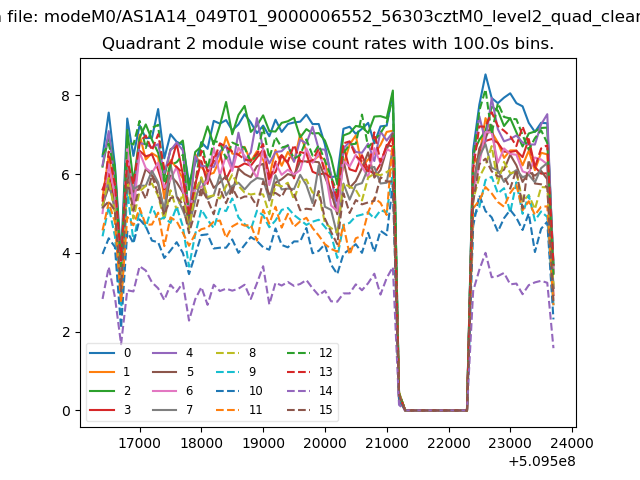
| Module-wise count rates for Quadrant B Data is divided into 100 sec bins |
 |
 |
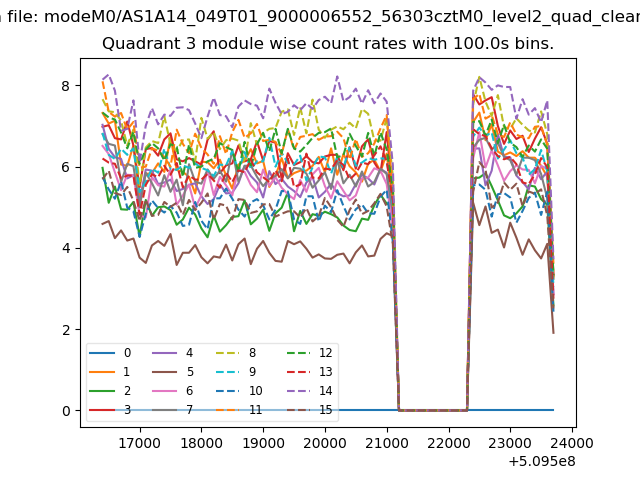
| Module-wise count rates for Quadrant C Data is divided into 100 sec bins |
 |
 |
| Module-wise count rates for Quadrant D Data is divided into 100 sec bins |
 |
 |
| Parameter | Plot |
|---|---|
| CZT HV Monitor | 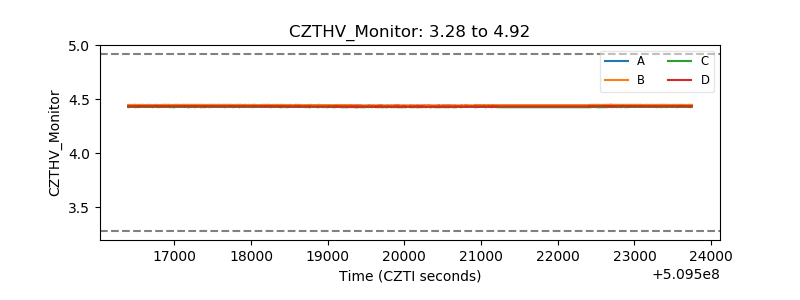 |
| D_VDD |  |
| Temperature 1 | 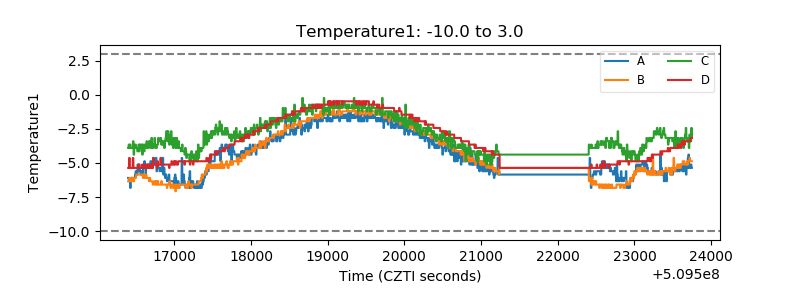 |
| Veto HV Monitor | 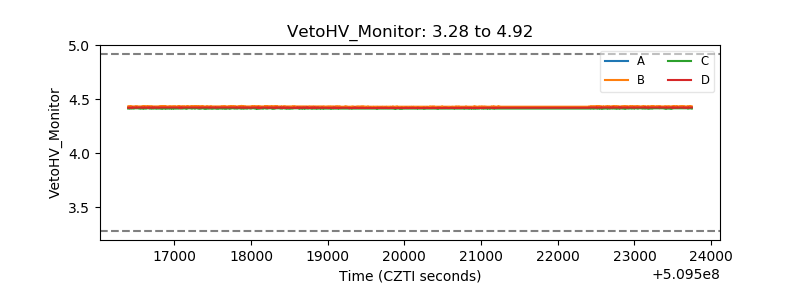 |
| Veto LLD |  |
| Alpha Counter |  |
| _CPM_Rate |  |
| CZT Counter | 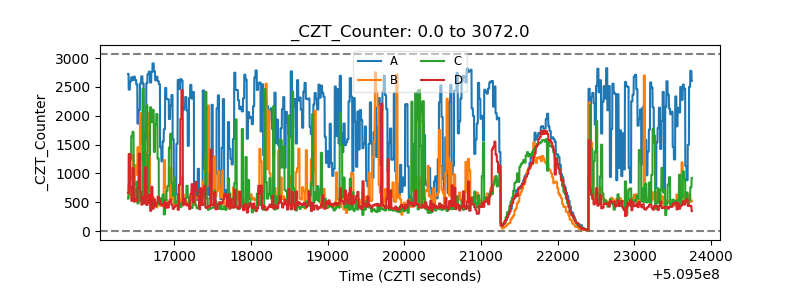 |
| +2.5 Volts monitor | 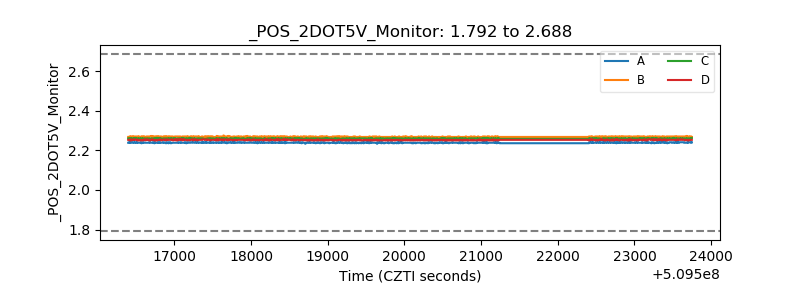 |
| +5 Volts monitor | 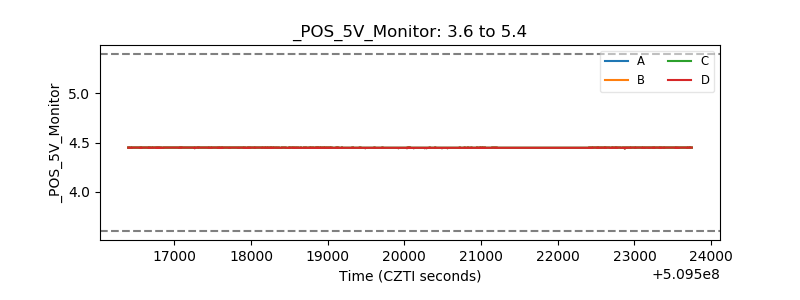 |
| _ROLL_ROT | 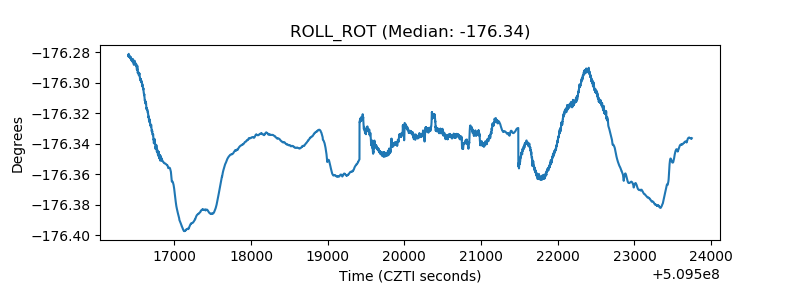 |
| _Roll_DEC | 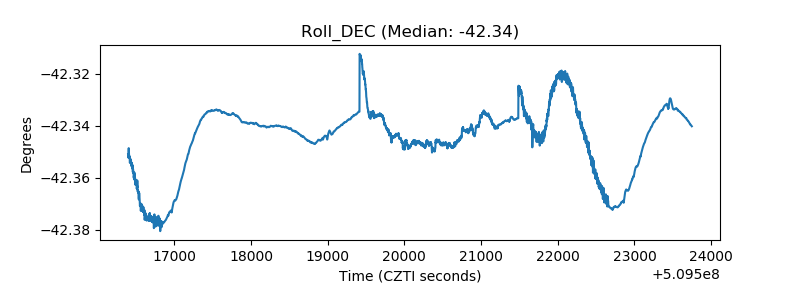 |
| _Roll_RA | 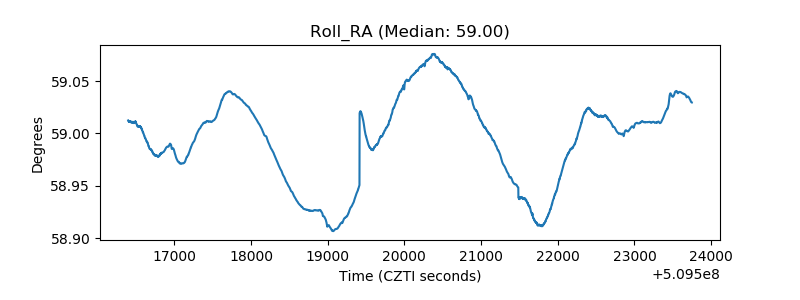 |
| Veto Counter | 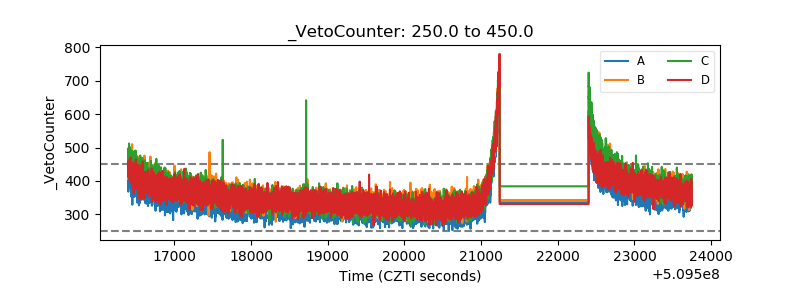 |