| Param | Original file | Final file |
|---|---|---|
| Filename | modeM0/AS1A14_049T01_9000006552_56304cztM0_level2.fits | modeM0/AS1A14_049T01_9000006552_56304cztM0_level2_quad_clean.evt |
| Size (bytes) | 791,591,040 | 82,379,520 |
| Size | 754.9 MB | 78.6 MB |
| Events in quadrant A | 15,584,391 | 131,482 |
| Events in quadrant B | 5,159,100 | 681,842 |
| Events in quadrant C | 4,330,827 | 622,824 |
| Events in quadrant D | 3,705,859 | 589,766 |
| Mode SS | |||
|---|---|---|---|
| Quadrant | BADHDUFLAG | Total packets | Discarded packets |
| A | 0 | 138 | 0 |
| B | 0 | 138 | 0 |
| C | 0 | 138 | 0 |
| D | 0 | 138 | 0 |
| Mode M9 | |||
|---|---|---|---|
| Quadrant | BADHDUFLAG | Total packets | Discarded packets |
| A | 0 | 23 | 0 |
| B | 0 | 23 | 0 |
| C | 0 | 23 | 0 |
| D | 0 | 23 | 0 |
| Mode M0 | |||
|---|---|---|---|
| Quadrant | BADHDUFLAG | Total packets | Discarded packets |
| A | 0 | 50948 | 7 |
| B | 0 | 19708 | 2 |
| C | 0 | 17573 | 2 |
| D | 0 | 15640 | 2 |
| Quadrant | Total seconds | Saturated seconds | Saturation percentage |
|---|---|---|---|
| A | 6722 | 5662 | 84.230884% |
| B | 6722 | 547 | 8.137459% |
| C | 6722 | 372 | 5.534067% |
| D | 6723 | 218 | 3.242600% |
Noise dominated data is calculated using 1-second bins in cleaned event files. If a bin has >2000 counts, and if more than 50% of those come from <1% of pixels, then it is considered to be noise-dominated and hence unusable.
| Quadrant | # 1 sec bins | Bins with >0 counts | Bins with >2000 counts | High rate bins dominated by noise | Noise dominated (total time) | Noise dominated (detector-on time) | Marked lightcurve |
|---|---|---|---|---|---|---|---|
| A | 8987 | 6725 | 5365 | 5365 | 59.70% | 79.78% |  |
| B | 8987 | 6725 | 246 | 246 | 2.74% | 3.66% |  |
| C | 8987 | 6725 | 175 | 175 | 1.95% | 2.60% | 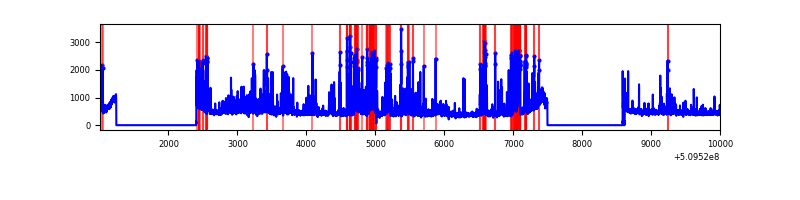 |
| D | 8988 | 6726 | 44 | 44 | 0.49% | 0.65% |  |
Top three noisy pixels from each quadrant. If the there are fewer than three noisy pixels in the level2.evt file, extra rows are filled as -1
| Pixel properties | Quadrant properties | ||||||
|---|---|---|---|---|---|---|---|
| Quadrant | DetID | PixID | Counts | Sigma | Mean | Median | Sigma |
| A | 15 | 32 | 6227893 | 57511.17 | 438 | 425 | 108.3 |
| A | 7 | 64 | 3083348 | 28471.04 | 438 | 425 | 108.3 |
| A | 4 | 95 | 3053072 | 28191.44 | 438 | 425 | 108.3 |
| B | 5 | 172 | 1350538 | 8524.38 | 739 | 712 | 158.3 |
| B | 5 | 185 | 555112 | 3501.13 | 739 | 712 | 158.3 |
| B | 0 | 183 | 141927 | 891.8 | 739 | 712 | 158.3 |
| C | 5 | 250 | 785930 | 3925.89 | 740 | 735 | 200.0 |
| C | 12 | 252 | 171251 | 852.56 | 740 | 735 | 200.0 |
| C | 12 | 249 | 113526 | 563.94 | 740 | 735 | 200.0 |
| D | 2 | 249 | 178763 | 852.35 | 744 | 712 | 208.9 |
| D | 14 | 52 | 121453 | 578.0 | 744 | 712 | 208.9 |
| D | 2 | 120 | 91049 | 432.45 | 744 | 712 | 208.9 |
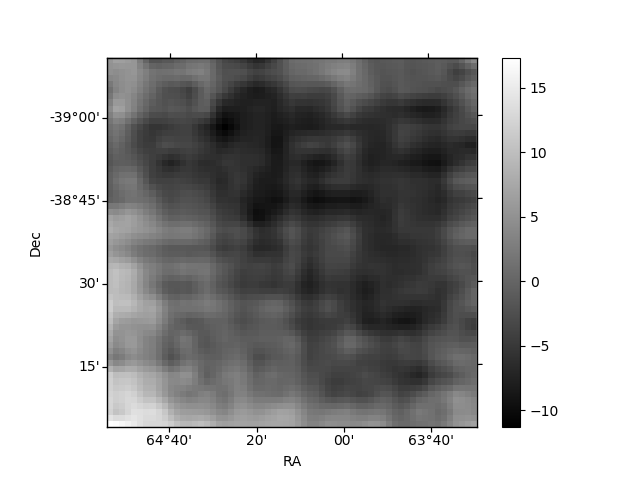
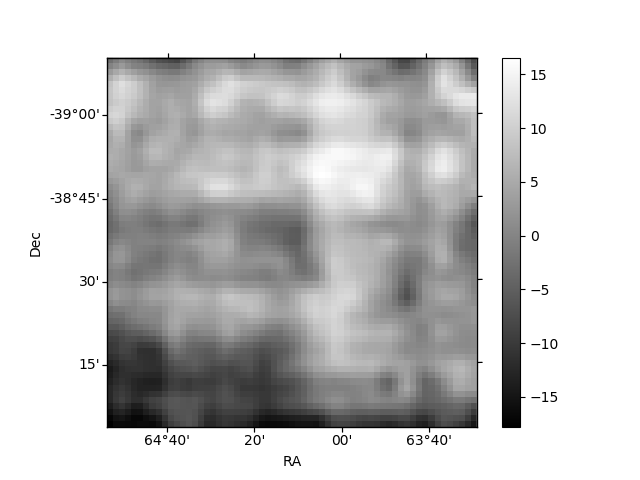
Histogram calculated using DETX and DETY for each event in the final _common_clean file
| Quadrant A | 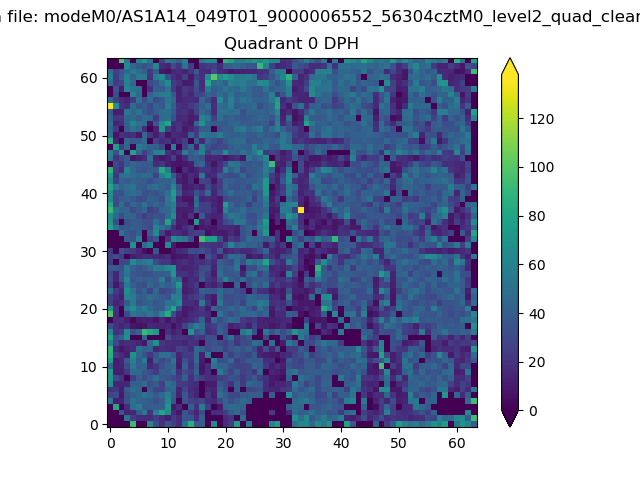 |
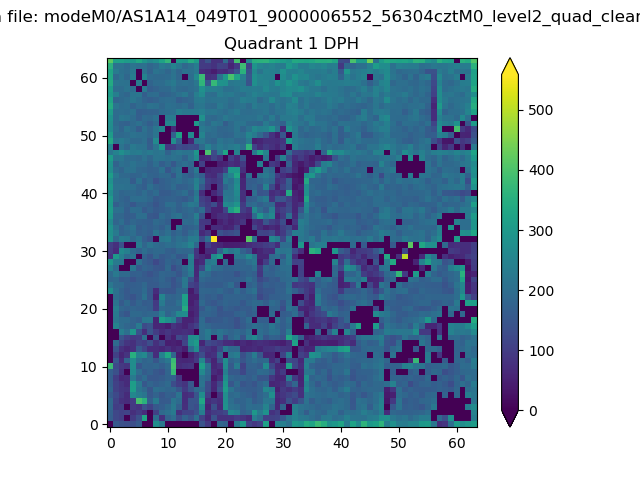 |
Quadrant B |
|---|---|---|---|
| Quadrant D |  |
 |
Quadrant C |
| Plot type | Count rate plots | Images |
|---|---|---|
| Comparison with Poisson distribution Blue bars denote a histogram of data divided into 1 sec bins. Red curve is a Poisson curve with rate = median count rate of data. |
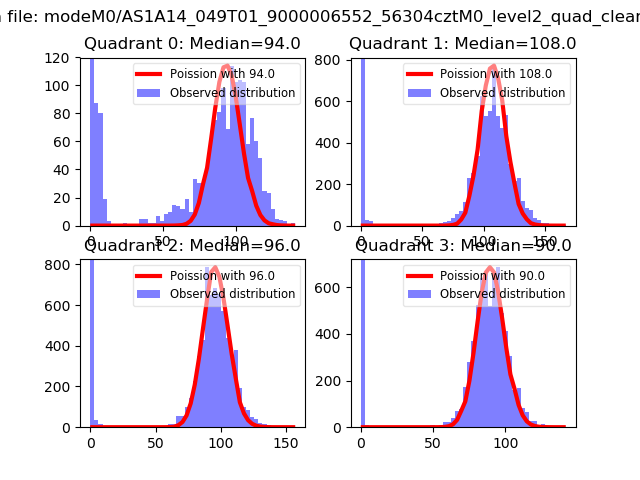 |
 |
| Quadrant-wise count rates Data is divided into 100 sec bins |
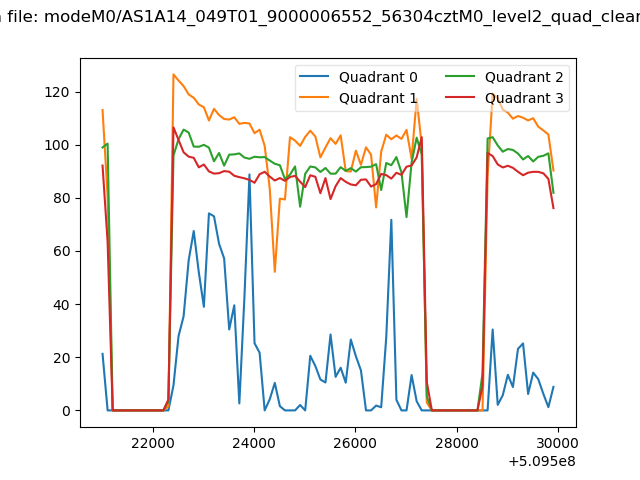 |
|
| Module-wise count rates for Quadrant A Data is divided into 100 sec bins |
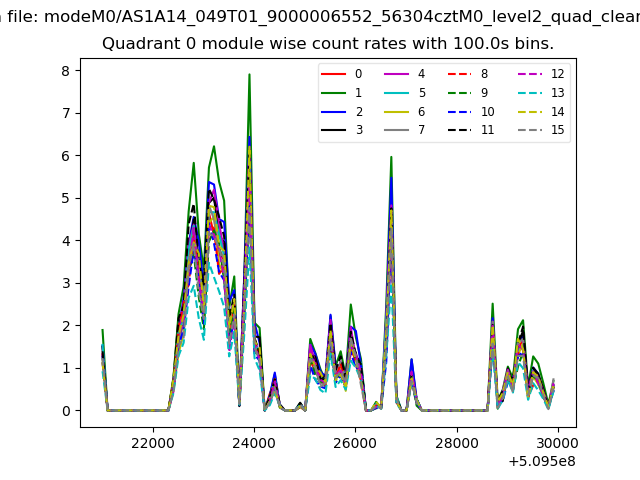 |
 |
| Module-wise count rates for Quadrant B Data is divided into 100 sec bins |
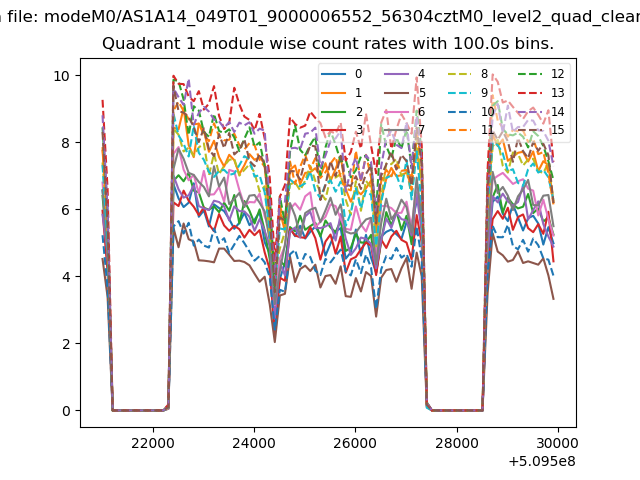 |
 |
| Module-wise count rates for Quadrant C Data is divided into 100 sec bins |
 |
 |
| Module-wise count rates for Quadrant D Data is divided into 100 sec bins |
 |
 |
| Parameter | Plot |
|---|---|
| CZT HV Monitor |  |
| D_VDD |  |
| Temperature 1 |  |
| Veto HV Monitor | 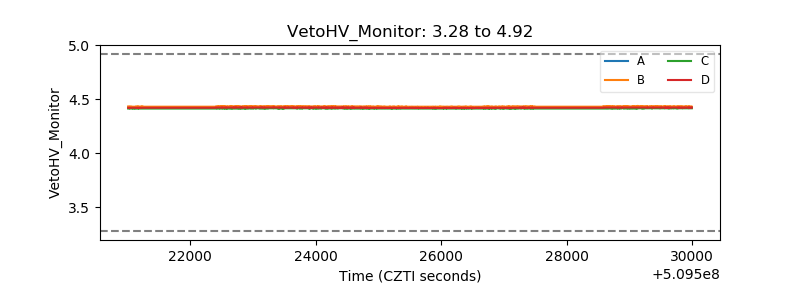 |
| Veto LLD | 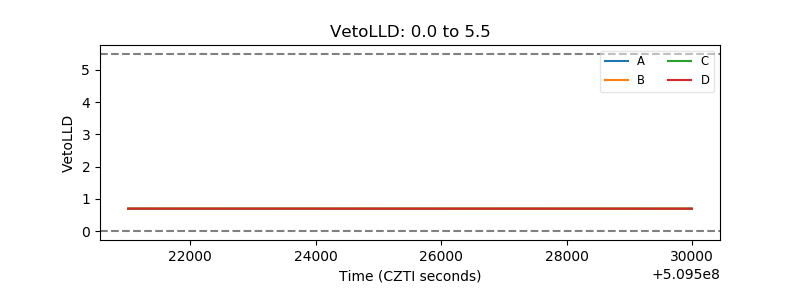 |
| Alpha Counter |  |
| _CPM_Rate | 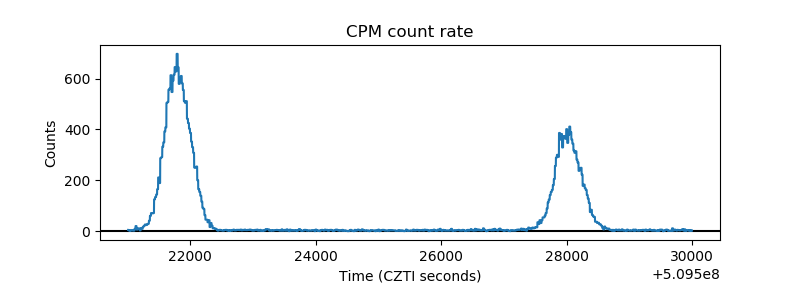 |
| CZT Counter | 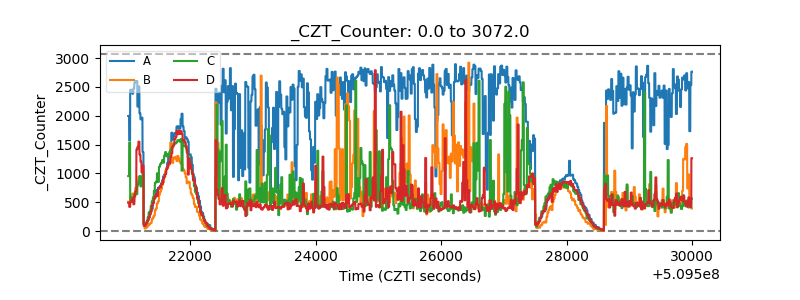 |
| +2.5 Volts monitor |  |
| +5 Volts monitor |  |
| _ROLL_ROT | 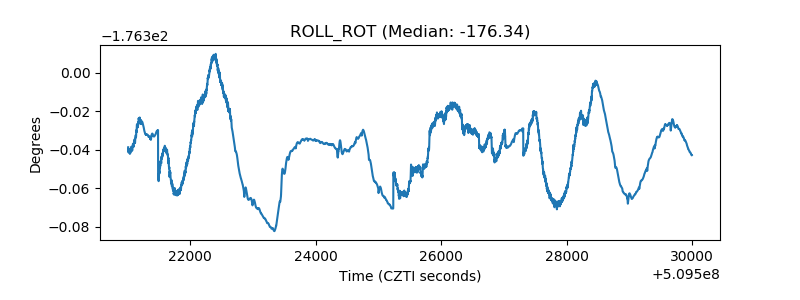 |
| _Roll_DEC | 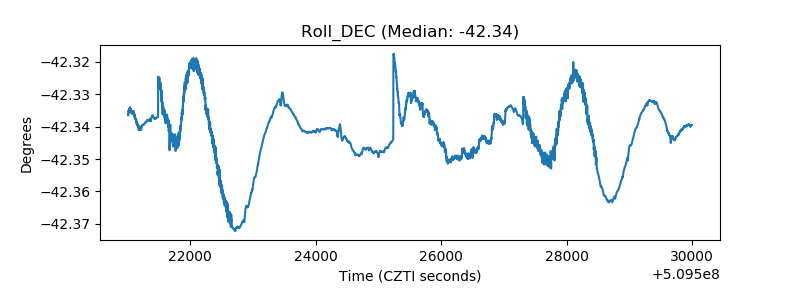 |
| _Roll_RA |  |
| Veto Counter | 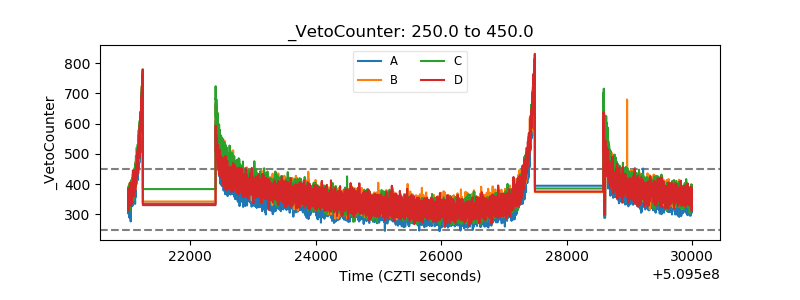 |