| Param | Original file | Final file |
|---|---|---|
| Filename | modeM0/AS1A14_049T01_9000006552_56305cztM0_level2.fits | modeM0/AS1A14_049T01_9000006552_56305cztM0_level2_quad_clean.evt |
| Size (bytes) | 790,784,640 | 78,606,720 |
| Size | 754.2 MB | 75.0 MB |
| Events in quadrant A | 15,373,062 | 144,939 |
| Events in quadrant B | 4,732,052 | 617,479 |
| Events in quadrant C | 4,470,711 | 587,448 |
| Events in quadrant D | 4,177,550 | 564,255 |
| Mode SS | |||
|---|---|---|---|
| Quadrant | BADHDUFLAG | Total packets | Discarded packets |
| A | 0 | 136 | 0 |
| B | 0 | 136 | 0 |
| C | 0 | 136 | 0 |
| D | 0 | 136 | 0 |
| Mode M9 | |||
|---|---|---|---|
| Quadrant | BADHDUFLAG | Total packets | Discarded packets |
| A | 0 | 10 | 0 |
| B | 0 | 10 | 0 |
| C | 0 | 10 | 0 |
| D | 0 | 10 | 0 |
| Mode M0 | |||
|---|---|---|---|
| Quadrant | BADHDUFLAG | Total packets | Discarded packets |
| A | 0 | 50285 | 2 |
| B | 0 | 18623 | 2 |
| C | 0 | 18059 | 10 |
| D | 0 | 16965 | 2 |
| Quadrant | Total seconds | Saturated seconds | Saturation percentage |
|---|---|---|---|
| A | 6683 | 5380 | 80.502768% |
| B | 6683 | 866 | 12.958252% |
| C | 6680 | 525 | 7.859281% |
| D | 6684 | 292 | 4.368642% |
Noise dominated data is calculated using 1-second bins in cleaned event files. If a bin has >2000 counts, and if more than 50% of those come from <1% of pixels, then it is considered to be noise-dominated and hence unusable.
| Quadrant | # 1 sec bins | Bins with >0 counts | Bins with >2000 counts | High rate bins dominated by noise | Noise dominated (total time) | Noise dominated (detector-on time) | Marked lightcurve |
|---|---|---|---|---|---|---|---|
| A | 7668 | 6684 | 5228 | 5228 | 68.18% | 78.22% |  |
| B | 7668 | 6684 | 254 | 254 | 3.31% | 3.80% |  |
| C | 7668 | 6682 | 450 | 450 | 5.87% | 6.73% | 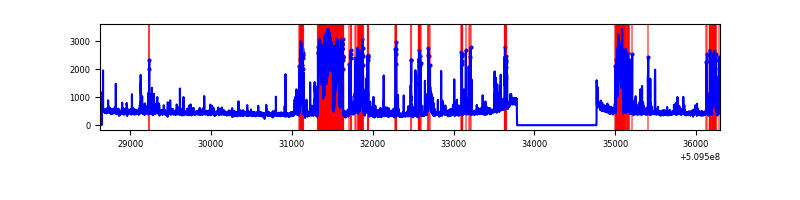 |
| D | 7669 | 6685 | 211 | 211 | 2.75% | 3.16% |  |
Top three noisy pixels from each quadrant. If the there are fewer than three noisy pixels in the level2.evt file, extra rows are filled as -1
| Pixel properties | Quadrant properties | ||||||
|---|---|---|---|---|---|---|---|
| Quadrant | DetID | PixID | Counts | Sigma | Mean | Median | Sigma |
| A | 15 | 32 | 7424818 | 70994.56 | 416 | 406 | 104.6 |
| A | 4 | 95 | 2845278 | 27203.56 | 416 | 406 | 104.6 |
| A | 7 | 64 | 1376727 | 13160.81 | 416 | 406 | 104.6 |
| B | 5 | 172 | 1168896 | 8312.18 | 660 | 637 | 140.5 |
| B | 5 | 185 | 434717 | 3088.49 | 660 | 637 | 140.5 |
| B | 1 | 159 | 133434 | 944.85 | 660 | 637 | 140.5 |
| C | 15 | 198 | 829092 | 4319.87 | 694 | 686 | 191.8 |
| C | 12 | 94 | 323071 | 1681.14 | 694 | 686 | 191.8 |
| C | 5 | 250 | 148533 | 770.98 | 694 | 686 | 191.8 |
| D | 2 | 249 | 309618 | 1540.05 | 704 | 673 | 200.6 |
| D | 13 | 153 | 255503 | 1270.29 | 704 | 673 | 200.6 |
| D | 6 | 239 | 238129 | 1183.68 | 704 | 673 | 200.6 |
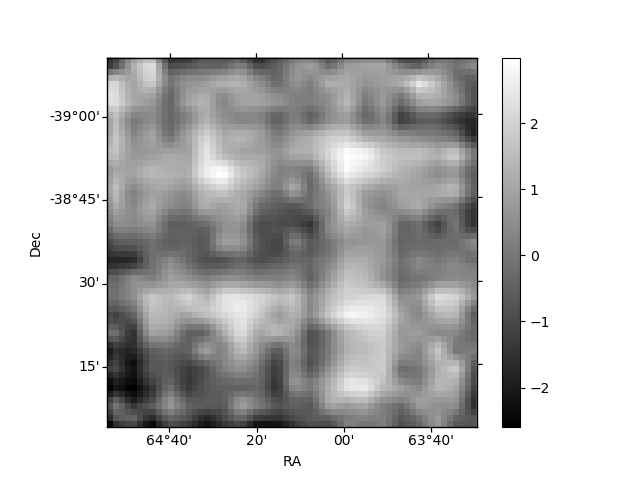
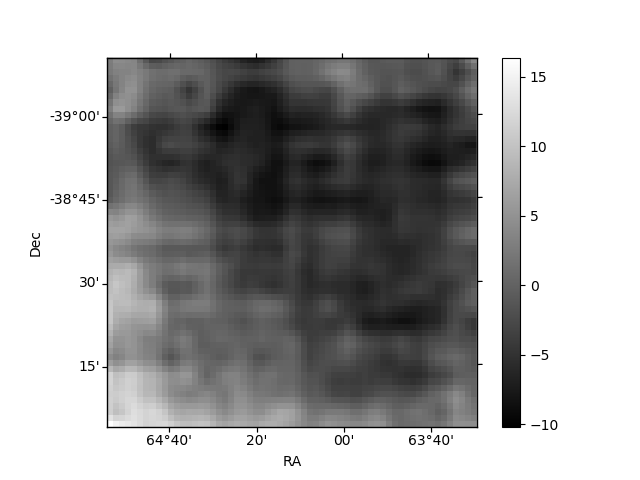
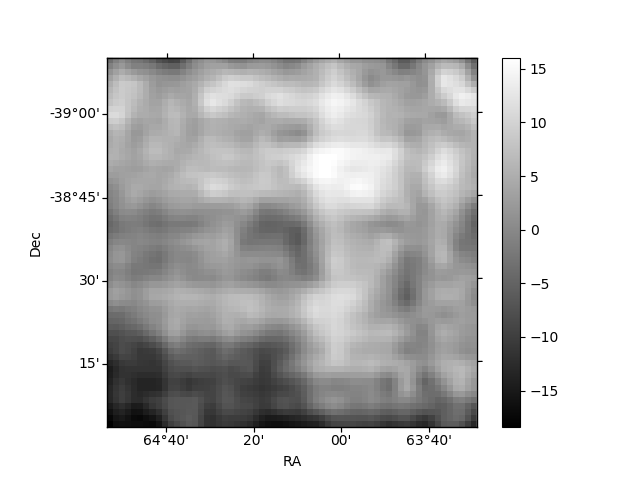
Histogram calculated using DETX and DETY for each event in the final _common_clean file
| Quadrant A | 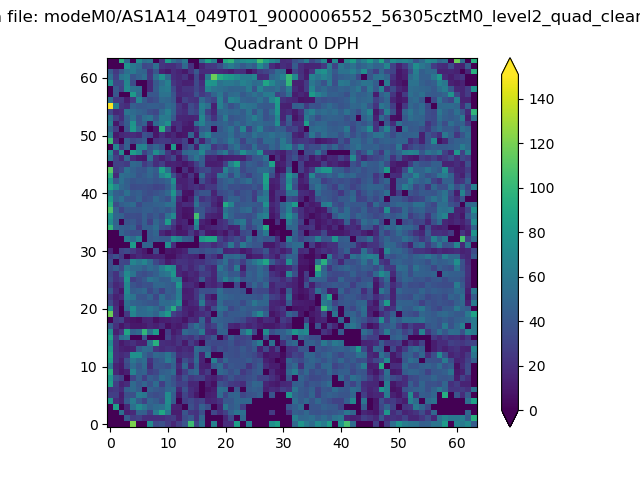 |
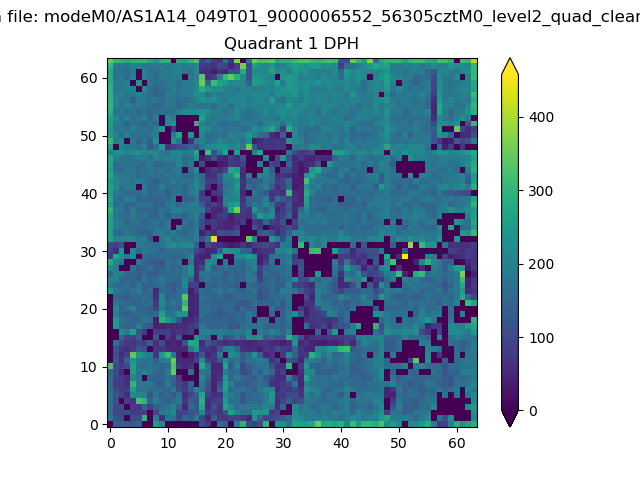 |
Quadrant B |
|---|---|---|---|
| Quadrant D | 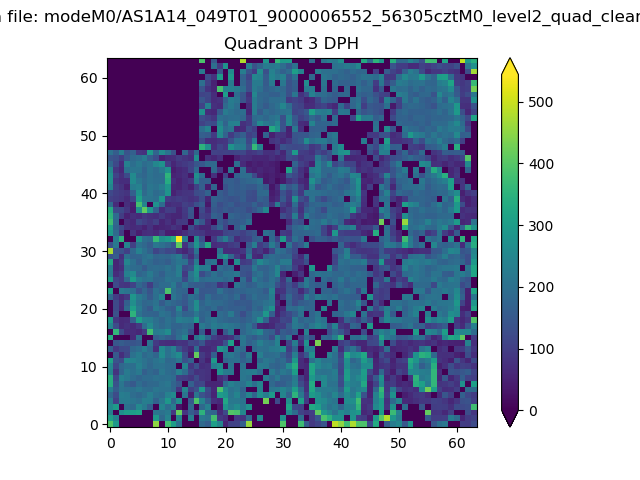 |
 |
Quadrant C |
| Plot type | Count rate plots | Images |
|---|---|---|
| Comparison with Poisson distribution Blue bars denote a histogram of data divided into 1 sec bins. Red curve is a Poisson curve with rate = median count rate of data. |
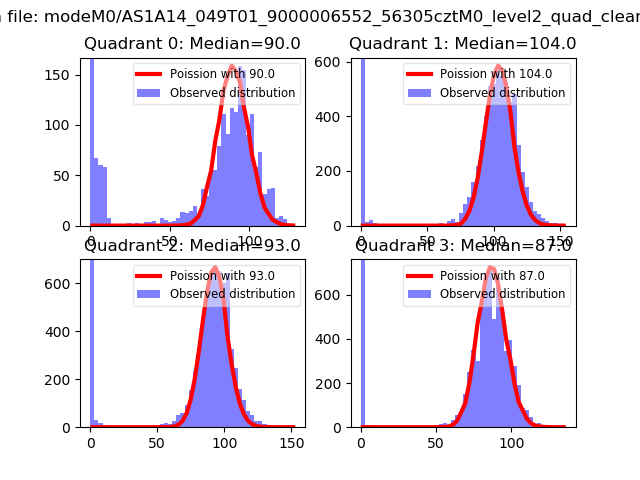 |
 |
| Quadrant-wise count rates Data is divided into 100 sec bins |
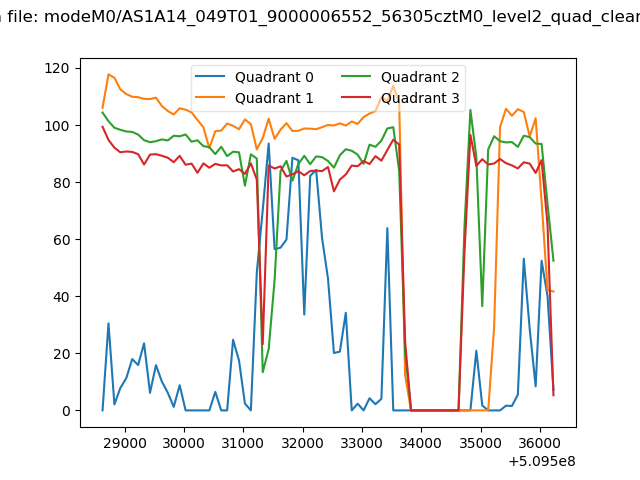 |
|
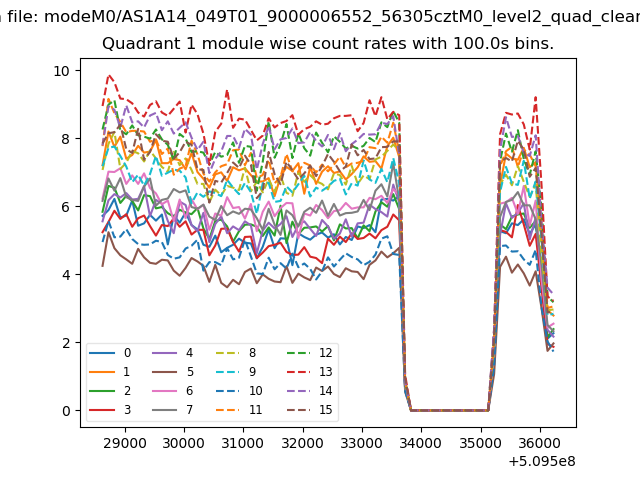
| Module-wise count rates for Quadrant A Data is divided into 100 sec bins |
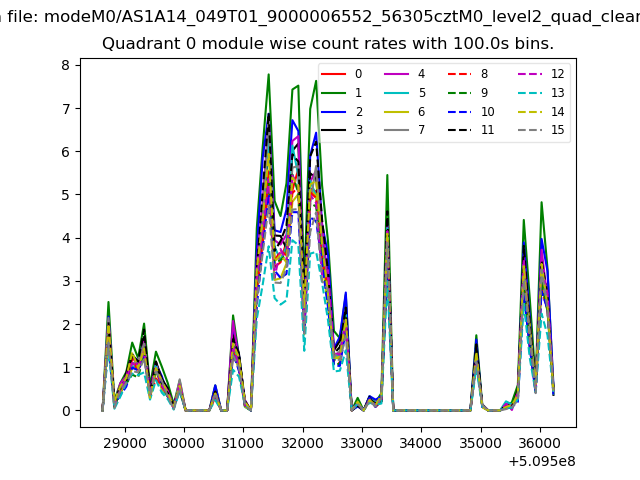 |
 |
| Module-wise count rates for Quadrant B Data is divided into 100 sec bins |
 |
 |
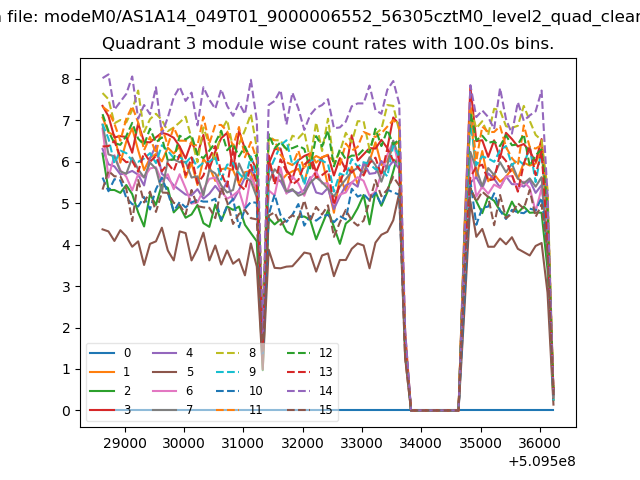
| Module-wise count rates for Quadrant C Data is divided into 100 sec bins |
 |
 |
| Module-wise count rates for Quadrant D Data is divided into 100 sec bins |
 |
 |
| Parameter | Plot |
|---|---|
| CZT HV Monitor |  |
| D_VDD | 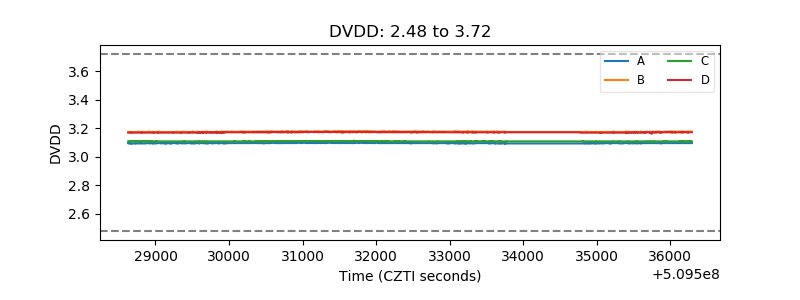 |
| Temperature 1 |  |
| Veto HV Monitor | 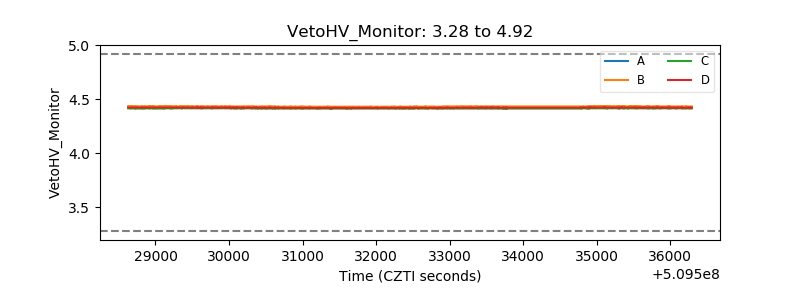 |
| Veto LLD | 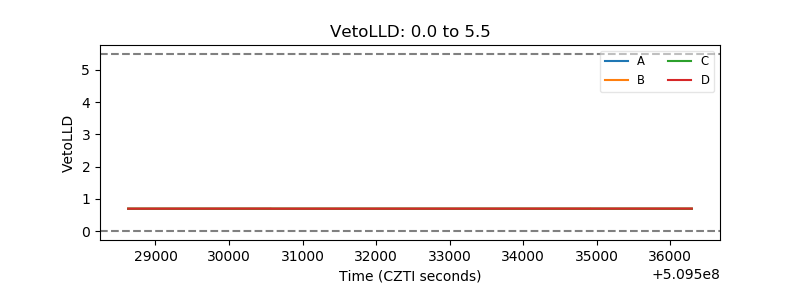 |
| Alpha Counter |  |
| _CPM_Rate | 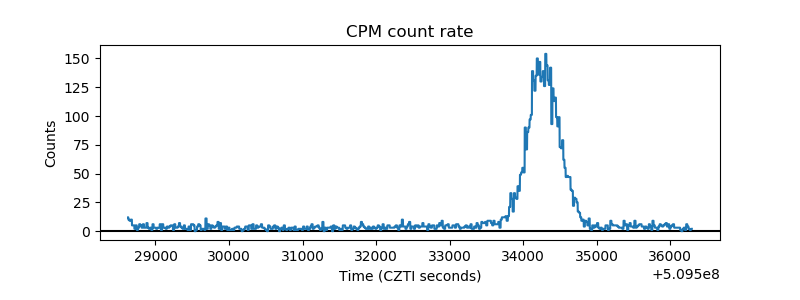 |
| CZT Counter | 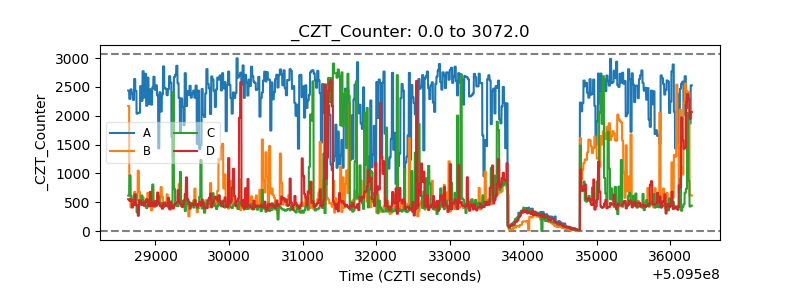 |
| +2.5 Volts monitor | 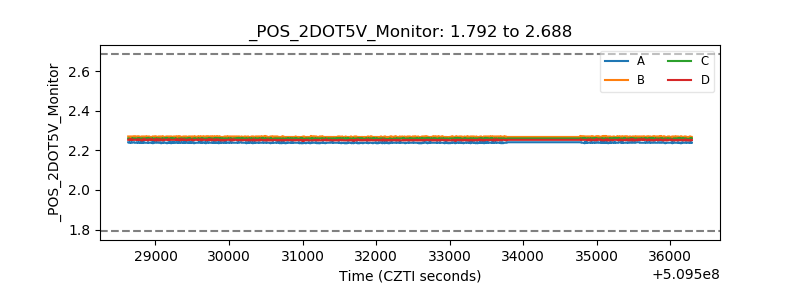 |
| +5 Volts monitor |  |
| _ROLL_ROT | 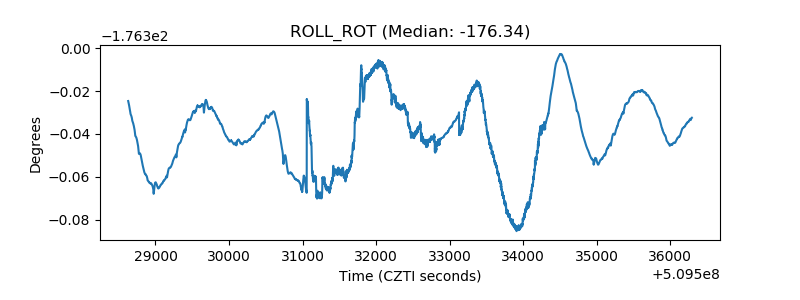 |
| _Roll_DEC | 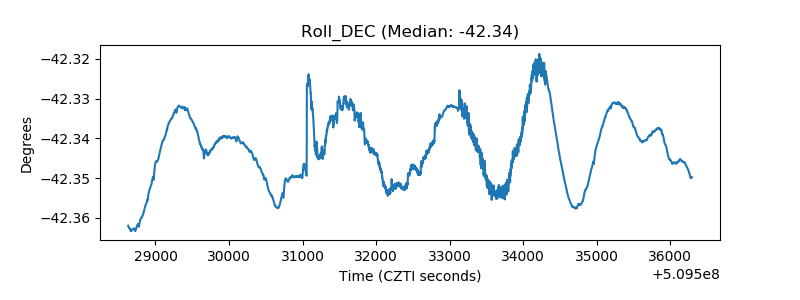 |
| _Roll_RA | 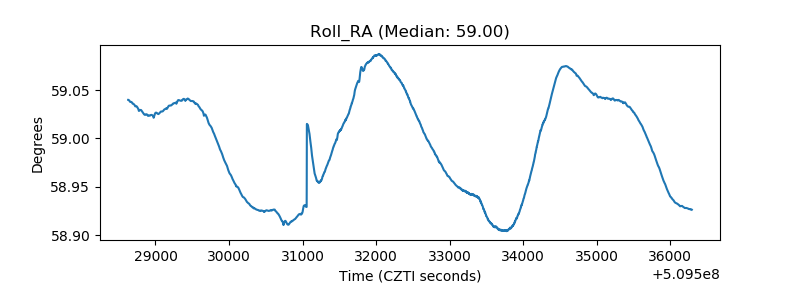 |
| Veto Counter | 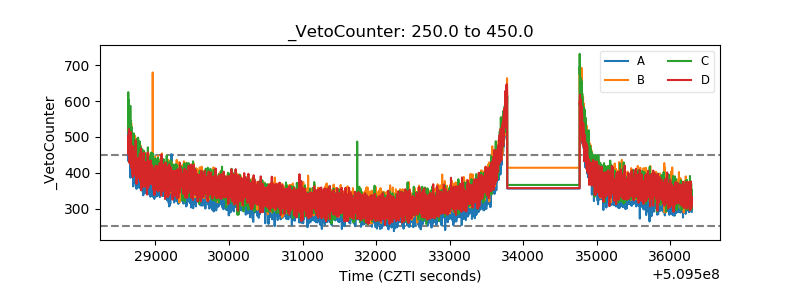 |