| Param | Original file | Final file |
|---|---|---|
| Filename | modeM0/AS1A14_049T01_9000006552_56307cztM0_level2.fits | modeM0/AS1A14_049T01_9000006552_56307cztM0_level2_quad_clean.evt |
| Size (bytes) | 842,688,000 | 85,829,760 |
| Size | 803.6 MB | 81.9 MB |
| Events in quadrant A | 15,235,335 | 222,399 |
| Events in quadrant B | 3,855,477 | 711,385 |
| Events in quadrant C | 5,857,360 | 605,424 |
| Events in quadrant D | 5,699,028 | 568,179 |
| Mode SS | |||
|---|---|---|---|
| Quadrant | BADHDUFLAG | Total packets | Discarded packets |
| A | 0 | 142 | 0 |
| B | 0 | 142 | 0 |
| C | 0 | 142 | 0 |
| D | 0 | 142 | 0 |
| Mode M0 | |||
|---|---|---|---|
| Quadrant | BADHDUFLAG | Total packets | Discarded packets |
| A | 0 | 50072 | 1 |
| B | 0 | 16621 | 1 |
| C | 0 | 22359 | 1 |
| D | 0 | 21726 | 1 |
| Quadrant | Total seconds | Saturated seconds | Saturation percentage |
|---|---|---|---|
| A | 7046 | 5051 | 71.686063% |
| B | 7046 | 300 | 4.257735% |
| C | 7047 | 694 | 9.848162% |
| D | 7047 | 641 | 9.096069% |
Noise dominated data is calculated using 1-second bins in cleaned event files. If a bin has >2000 counts, and if more than 50% of those come from <1% of pixels, then it is considered to be noise-dominated and hence unusable.
| Quadrant | # 1 sec bins | Bins with >0 counts | Bins with >2000 counts | High rate bins dominated by noise | Noise dominated (total time) | Noise dominated (detector-on time) | Marked lightcurve |
|---|---|---|---|---|---|---|---|
| A | 7076 | 7047 | 4687 | 4687 | 66.24% | 66.51% |  |
| B | 7076 | 7047 | 82 | 82 | 1.16% | 1.16% |  |
| C | 7077 | 7048 | 695 | 695 | 9.82% | 9.86% | 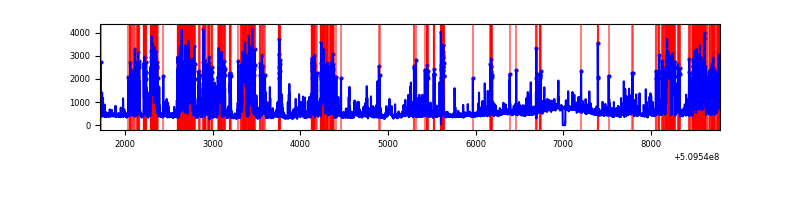 |
| D | 7077 | 7048 | 551 | 551 | 7.79% | 7.82% |  |
Top three noisy pixels from each quadrant. If the there are fewer than three noisy pixels in the level2.evt file, extra rows are filled as -1
| Pixel properties | Quadrant properties | ||||||
|---|---|---|---|---|---|---|---|
| Quadrant | DetID | PixID | Counts | Sigma | Mean | Median | Sigma |
| A | 15 | 32 | 9503383 | 78317.06 | 481 | 469 | 121.3 |
| A | 4 | 95 | 1232603 | 10154.48 | 481 | 469 | 121.3 |
| A | 4 | 206 | 693990 | 5715.56 | 481 | 469 | 121.3 |
| B | 5 | 185 | 399076 | 2442.76 | 761 | 734 | 163.1 |
| B | 0 | 182 | 162413 | 991.47 | 761 | 734 | 163.1 |
| B | 10 | 247 | 66319 | 402.19 | 761 | 734 | 163.1 |
| C | 12 | 94 | 2594387 | 13075.48 | 720 | 713 | 198.4 |
| C | 12 | 252 | 156305 | 784.39 | 720 | 713 | 198.4 |
| C | 13 | 3 | 73002 | 364.43 | 720 | 713 | 198.4 |
| D | 13 | 153 | 676470 | 3254.19 | 725 | 691 | 207.7 |
| D | 2 | 120 | 617957 | 2972.42 | 725 | 691 | 207.7 |
| D | 11 | 129 | 519786 | 2499.68 | 725 | 691 | 207.7 |
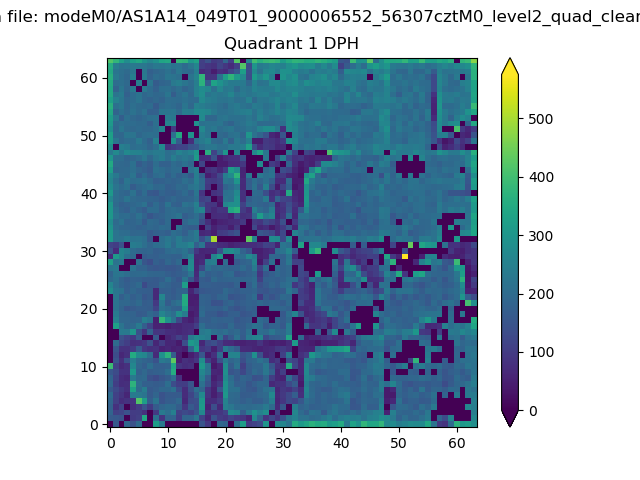
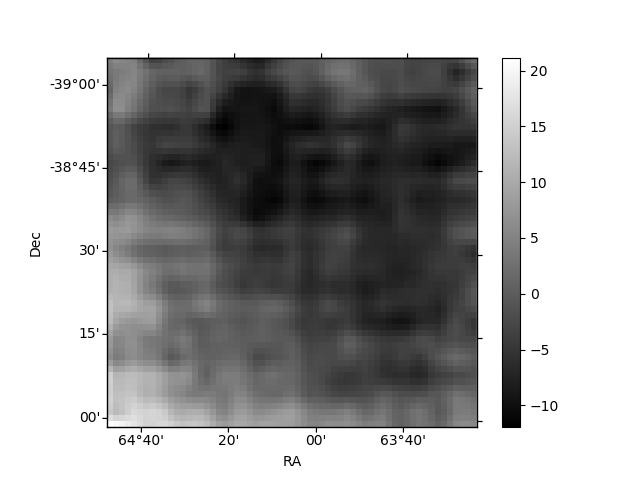
Histogram calculated using DETX and DETY for each event in the final _common_clean file
| Quadrant A |  |
 |
Quadrant B |
|---|---|---|---|
| Quadrant D | 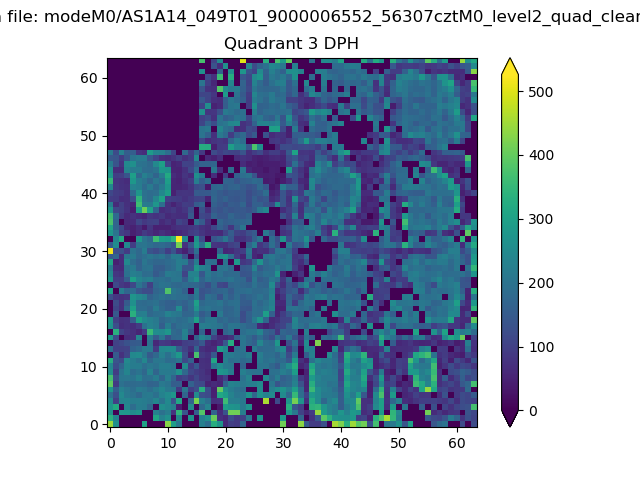 |
 |
Quadrant C |
| Plot type | Count rate plots | Images |
|---|---|---|
| Comparison with Poisson distribution Blue bars denote a histogram of data divided into 1 sec bins. Red curve is a Poisson curve with rate = median count rate of data. |
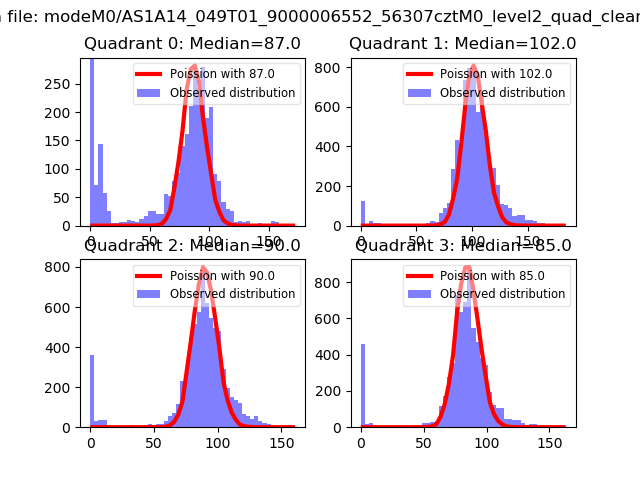 |
 |
| Quadrant-wise count rates Data is divided into 100 sec bins |
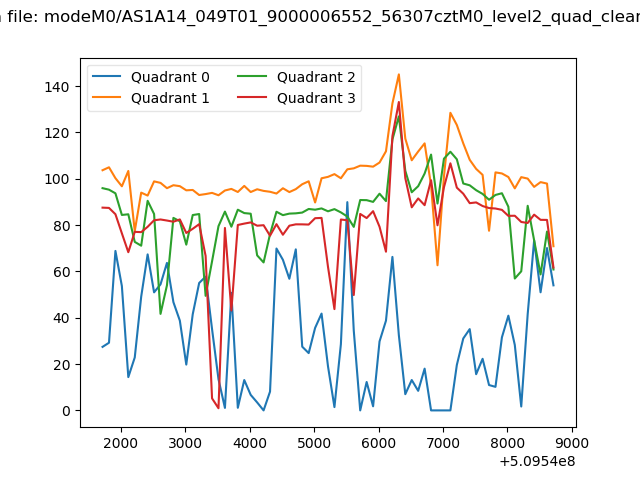 |
|
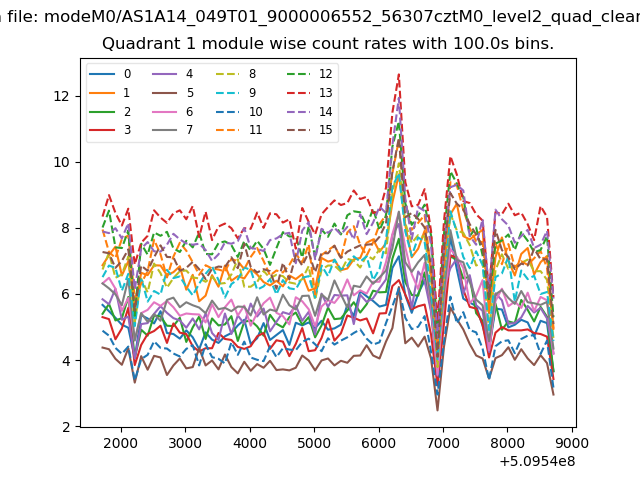
| Module-wise count rates for Quadrant A Data is divided into 100 sec bins |
 |
 |
| Module-wise count rates for Quadrant B Data is divided into 100 sec bins |
 |
 |
| Module-wise count rates for Quadrant C Data is divided into 100 sec bins |
 |
 |
| Module-wise count rates for Quadrant D Data is divided into 100 sec bins |
 |
 |
| Parameter | Plot |
|---|---|
| CZT HV Monitor | 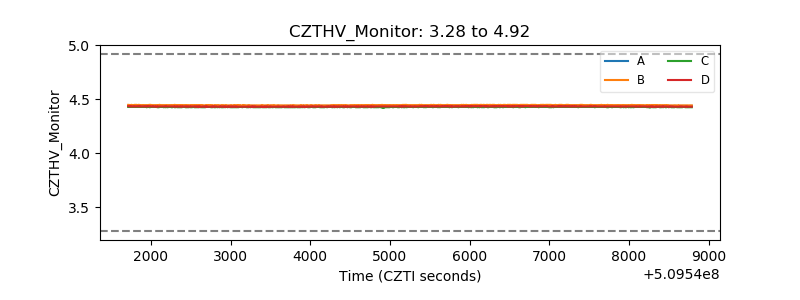 |
| D_VDD |  |
| Temperature 1 |  |
| Veto HV Monitor | 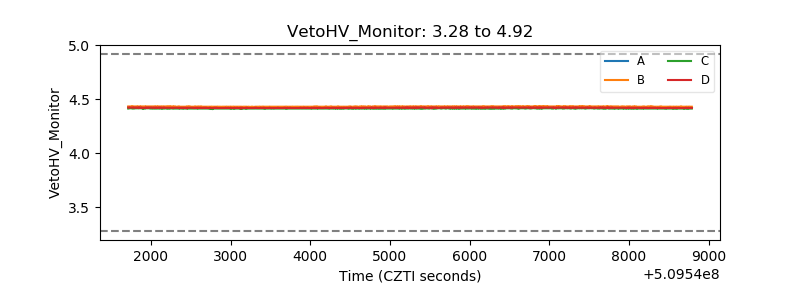 |
| Veto LLD | 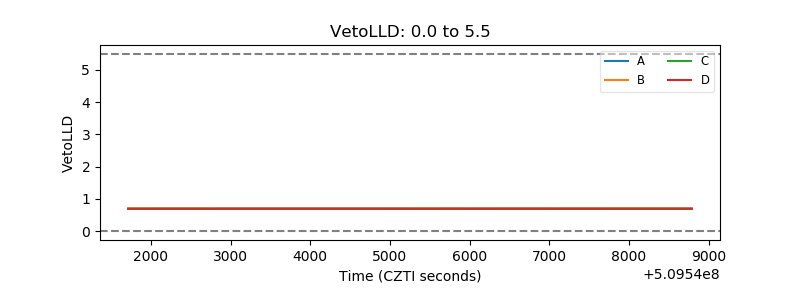 |
| Alpha Counter |  |
| _CPM_Rate | 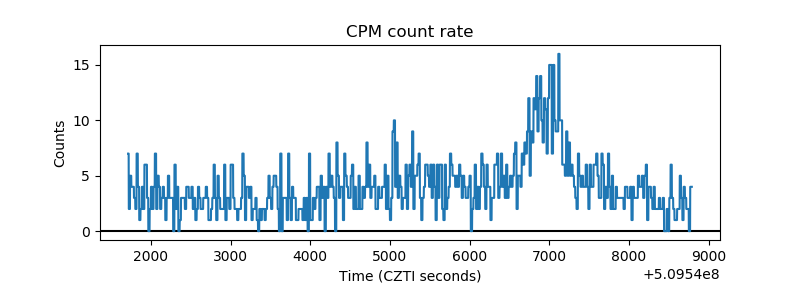 |
| CZT Counter |  |
| +2.5 Volts monitor |  |
| +5 Volts monitor | 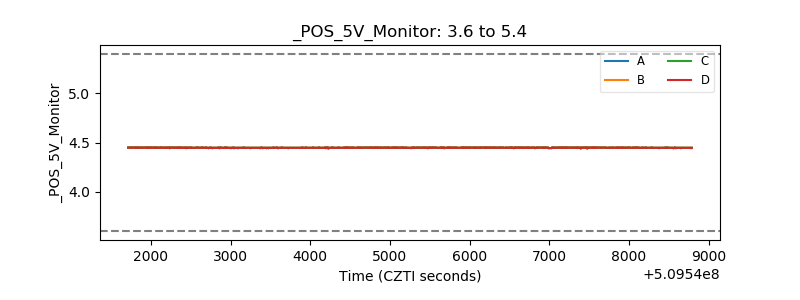 |
| _ROLL_ROT | 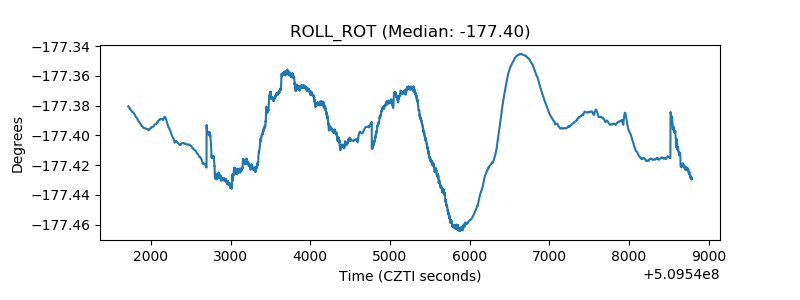 |
| _Roll_DEC | 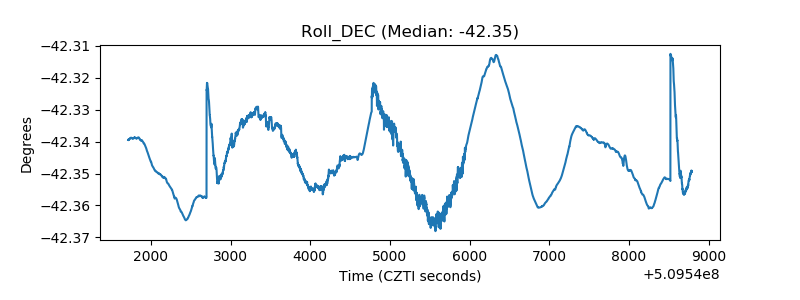 |
| _Roll_RA |  |
| Veto Counter | 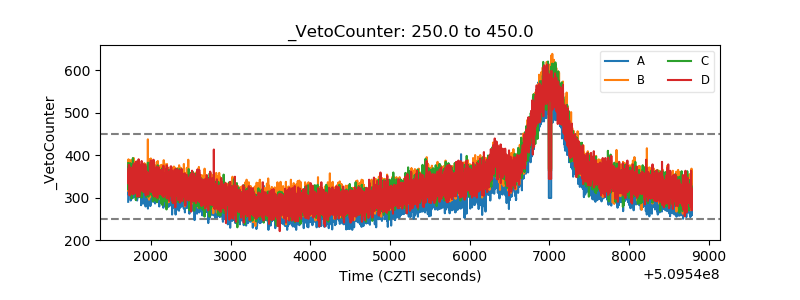 |