| Param | Original file | Final file |
|---|---|---|
| Filename | modeM0/AS1A14_049T01_9000006552_56309cztM0_level2.fits | modeM0/AS1A14_049T01_9000006552_56309cztM0_level2_quad_clean.evt |
| Size (bytes) | 889,629,120 | 80,965,440 |
| Size | 848.4 MB | 77.2 MB |
| Events in quadrant A | 15,828,783 | 183,409 |
| Events in quadrant B | 5,482,545 | 685,316 |
| Events in quadrant C | 7,048,388 | 507,775 |
| Events in quadrant D | 4,025,343 | 583,302 |
| Mode SS | |||
|---|---|---|---|
| Quadrant | BADHDUFLAG | Total packets | Discarded packets |
| A | 0 | 142 | 0 |
| B | 0 | 142 | 0 |
| C | 0 | 142 | 0 |
| D | 0 | 142 | 0 |
| Mode M0 | |||
|---|---|---|---|
| Quadrant | BADHDUFLAG | Total packets | Discarded packets |
| A | 0 | 51914 | 2 |
| B | 0 | 21577 | 0 |
| C | 0 | 25932 | 0 |
| D | 0 | 17167 | 0 |
| Quadrant | Total seconds | Saturated seconds | Saturation percentage |
|---|---|---|---|
| A | 7052 | 5341 | 75.737379% |
| B | 7053 | 326 | 4.622147% |
| C | 7053 | 1507 | 21.366794% |
| D | 7053 | 157 | 2.226003% |
Noise dominated data is calculated using 1-second bins in cleaned event files. If a bin has >2000 counts, and if more than 50% of those come from <1% of pixels, then it is considered to be noise-dominated and hence unusable.
| Quadrant | # 1 sec bins | Bins with >0 counts | Bins with >2000 counts | High rate bins dominated by noise | Noise dominated (total time) | Noise dominated (detector-on time) | Marked lightcurve |
|---|---|---|---|---|---|---|---|
| A | 7052 | 7052 | 5019 | 5019 | 71.17% | 71.17% |  |
| B | 7053 | 7053 | 195 | 195 | 2.76% | 2.76% |  |
| C | 7053 | 7053 | 1057 | 1057 | 14.99% | 14.99% | 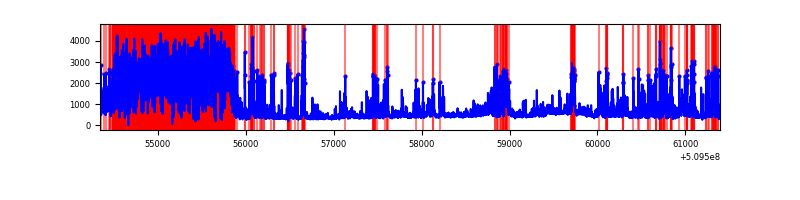 |
| D | 7053 | 7053 | 172 | 172 | 2.44% | 2.44% |  |
Top three noisy pixels from each quadrant. If the there are fewer than three noisy pixels in the level2.evt file, extra rows are filled as -1
| Pixel properties | Quadrant properties | ||||||
|---|---|---|---|---|---|---|---|
| Quadrant | DetID | PixID | Counts | Sigma | Mean | Median | Sigma |
| A | 15 | 32 | 11571240 | 106645.77 | 429 | 420 | 108.5 |
| A | 8 | 249 | 764725 | 7044.44 | 429 | 420 | 108.5 |
| A | 8 | 25 | 629833 | 5801.16 | 429 | 420 | 108.5 |
| B | 5 | 172 | 1629614 | 10432.85 | 726 | 701 | 156.1 |
| B | 5 | 185 | 481848 | 3081.65 | 726 | 701 | 156.1 |
| B | 0 | 231 | 162942 | 1039.12 | 726 | 701 | 156.1 |
| C | 12 | 94 | 3091490 | 18054.7 | 622 | 616 | 171.2 |
| C | 5 | 250 | 431558 | 2517.26 | 622 | 616 | 171.2 |
| C | 15 | 209 | 368929 | 2151.42 | 622 | 616 | 171.2 |
| D | 2 | 249 | 252544 | 1253.5 | 710 | 676 | 200.9 |
| D | 2 | 62 | 184298 | 913.85 | 710 | 676 | 200.9 |
| D | 8 | 129 | 164602 | 815.83 | 710 | 676 | 200.9 |
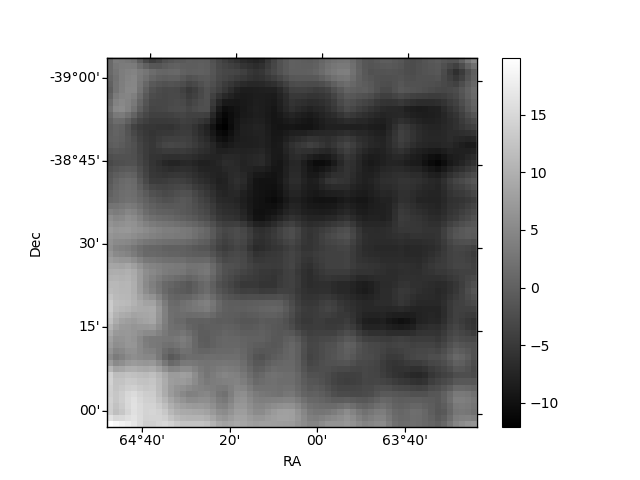
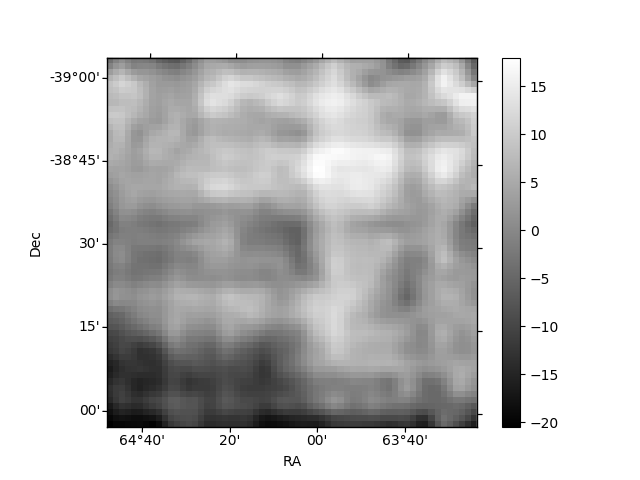
Histogram calculated using DETX and DETY for each event in the final _common_clean file
| Quadrant A | 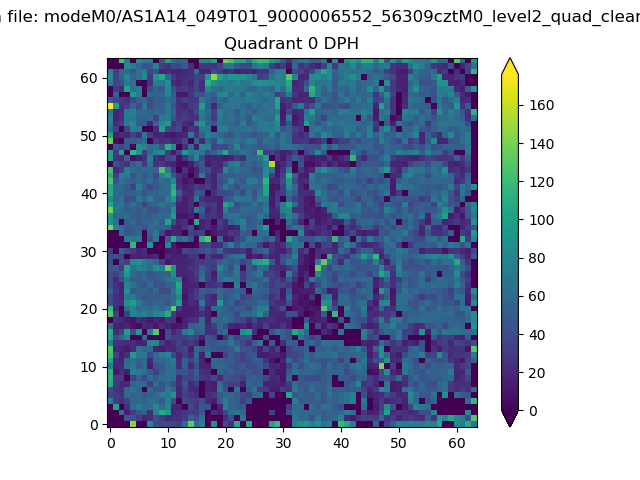 |
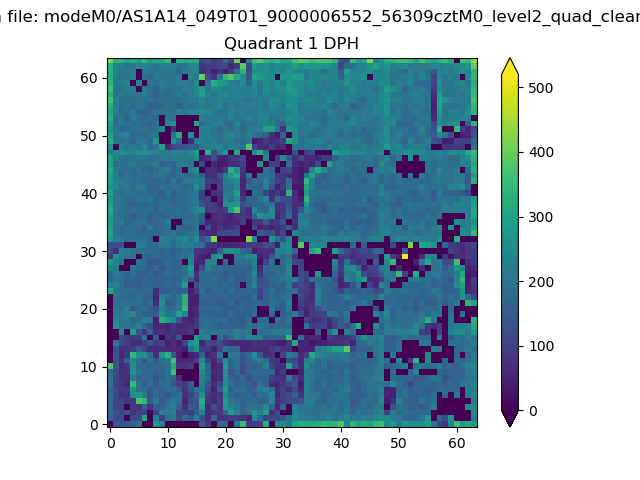 |
Quadrant B |
|---|---|---|---|
| Quadrant D | 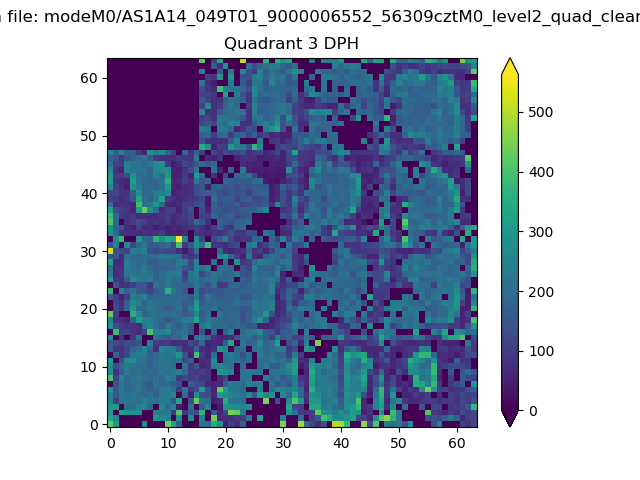 |
 |
Quadrant C |
| Plot type | Count rate plots | Images |
|---|---|---|
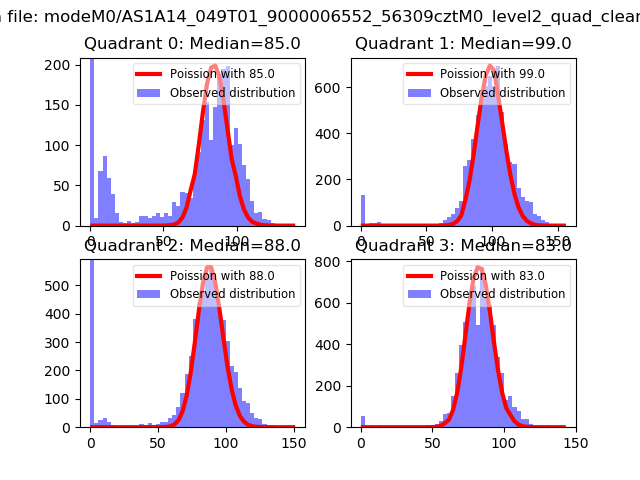
| Comparison with Poisson distribution Blue bars denote a histogram of data divided into 1 sec bins. Red curve is a Poisson curve with rate = median count rate of data. |
 |
 |
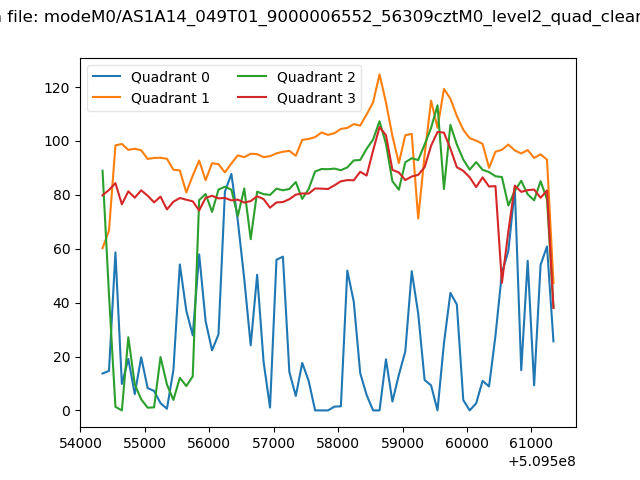
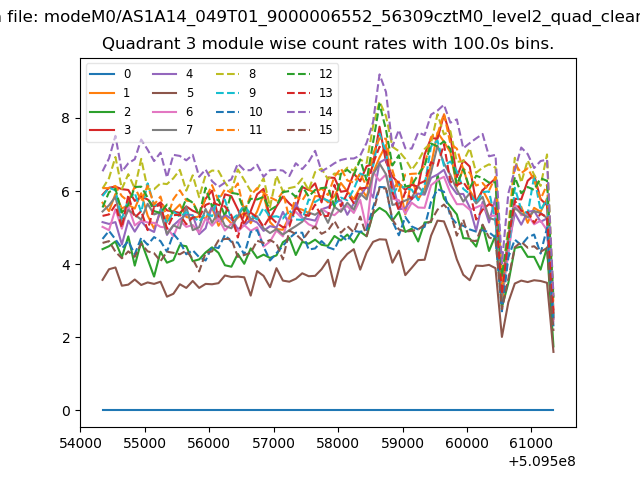
| Quadrant-wise count rates Data is divided into 100 sec bins |
 |
|
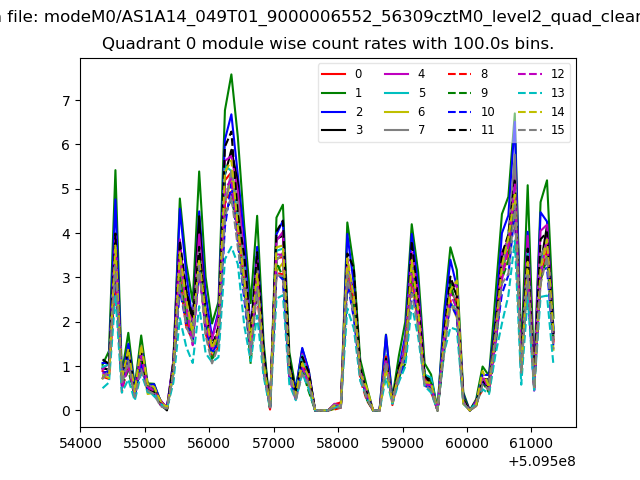
| Module-wise count rates for Quadrant A Data is divided into 100 sec bins |
 |
 |
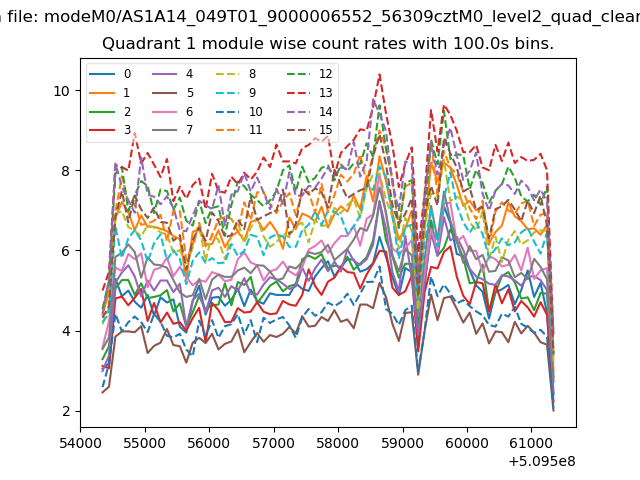
| Module-wise count rates for Quadrant B Data is divided into 100 sec bins |
 |
 |
| Module-wise count rates for Quadrant C Data is divided into 100 sec bins |
 |
 |
| Module-wise count rates for Quadrant D Data is divided into 100 sec bins |
 |
 |
| Parameter | Plot |
|---|---|
| CZT HV Monitor | 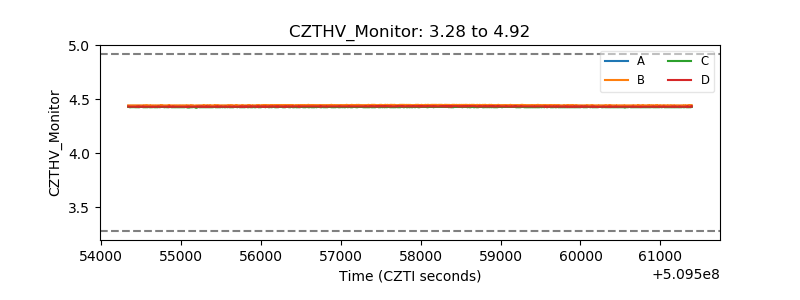 |
| D_VDD |  |
| Temperature 1 |  |
| Veto HV Monitor | 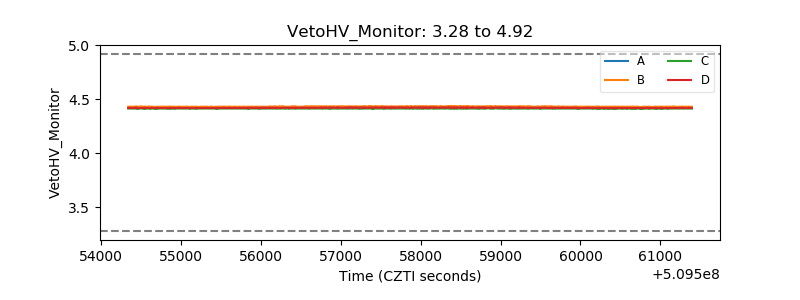 |
| Veto LLD | 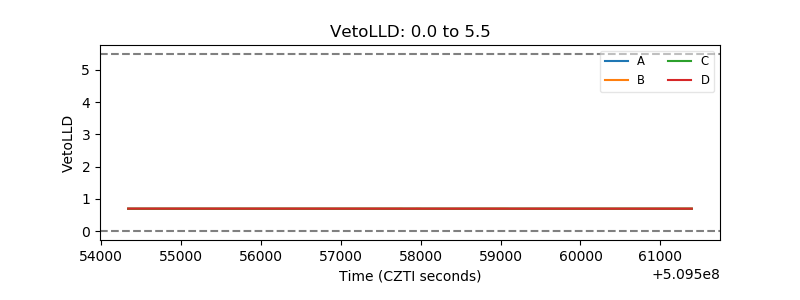 |
| Alpha Counter |  |
| _CPM_Rate | 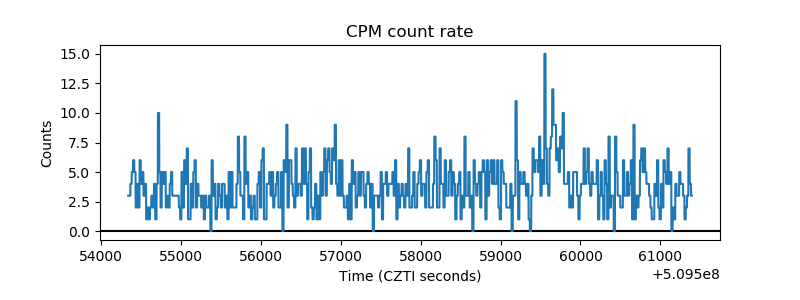 |
| CZT Counter | 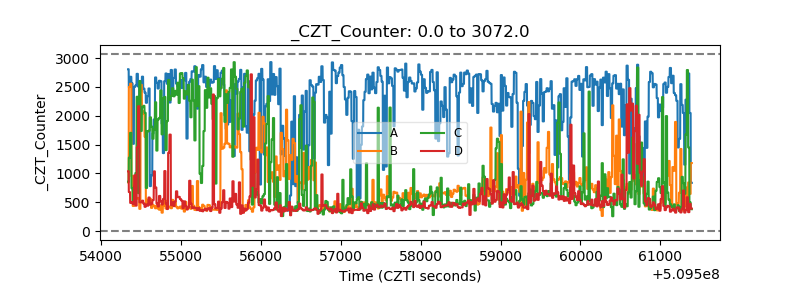 |
| +2.5 Volts monitor |  |
| +5 Volts monitor | 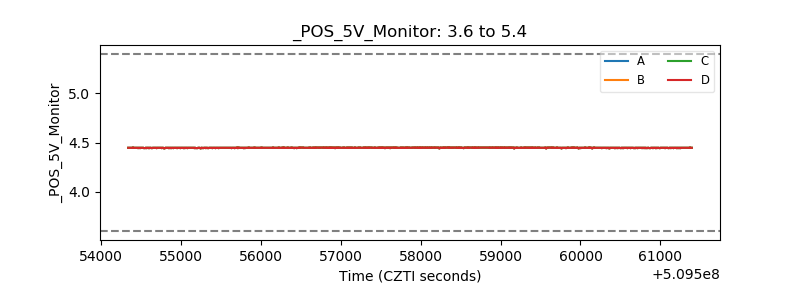 |
| _ROLL_ROT | 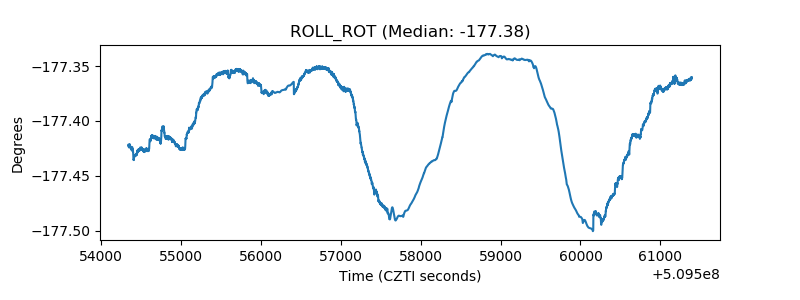 |
| _Roll_DEC | 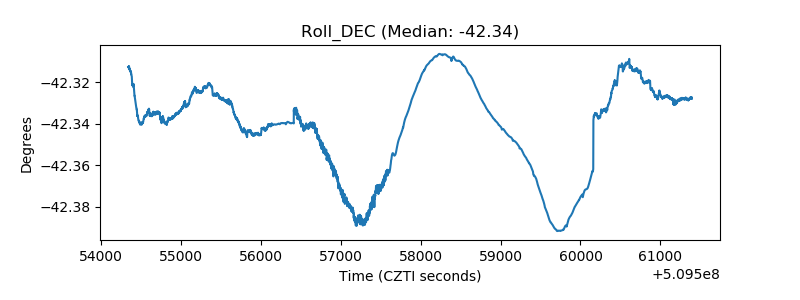 |
| _Roll_RA |  |
| Veto Counter | 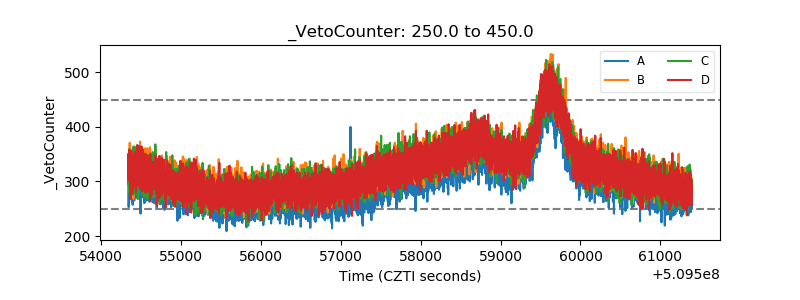 |