| Param | Original file | Final file |
|---|---|---|
| Filename | modeM0/AS1A14_049T01_9000006552_56312cztM0_level2.fits | modeM0/AS1A14_049T01_9000006552_56312cztM0_level2_quad_clean.evt |
| Size (bytes) | 1,995,160,320 | 229,331,520 |
| Size | 1.9 GB | 218.7 MB |
| Events in quadrant A | 37,442,945 | 731,087 |
| Events in quadrant B | 12,477,956 | 1,815,908 |
| Events in quadrant C | 10,711,480 | 1,596,076 |
| Events in quadrant D | 11,757,166 | 1,492,743 |
| Mode SS | |||
|---|---|---|---|
| Quadrant | BADHDUFLAG | Total packets | Discarded packets |
| A | 0 | 386 | 0 |
| B | 0 | 386 | 0 |
| C | 0 | 386 | 0 |
| D | 0 | 386 | 0 |
| Mode M9 | |||
|---|---|---|---|
| Quadrant | BADHDUFLAG | Total packets | Discarded packets |
| A | 0 | 12 | 0 |
| B | 0 | 12 | 0 |
| C | 0 | 12 | 0 |
| D | 0 | 12 | 0 |
| Mode M0 | |||
|---|---|---|---|
| Quadrant | BADHDUFLAG | Total packets | Discarded packets |
| A | 0 | 124313 | 5 |
| B | 0 | 51039 | 3 |
| C | 0 | 45934 | 3 |
| D | 0 | 48625 | 3 |
| Quadrant | Total seconds | Saturated seconds | Saturation percentage |
|---|---|---|---|
| A | 18959 | 11585 | 61.105544% |
| B | 18960 | 729 | 3.844937% |
| C | 18960 | 498 | 2.626582% |
| D | 18960 | 730 | 3.850211% |
Noise dominated data is calculated using 1-second bins in cleaned event files. If a bin has >2000 counts, and if more than 50% of those come from <1% of pixels, then it is considered to be noise-dominated and hence unusable.
| Quadrant | # 1 sec bins | Bins with >0 counts | Bins with >2000 counts | High rate bins dominated by noise | Noise dominated (total time) | Noise dominated (detector-on time) | Marked lightcurve |
|---|---|---|---|---|---|---|---|
| A | 20194 | 18963 | 10287 | 10287 | 50.94% | 54.25% |  |
| B | 20195 | 18964 | 336 | 336 | 1.66% | 1.77% |  |
| C | 20195 | 18964 | 373 | 373 | 1.85% | 1.97% | 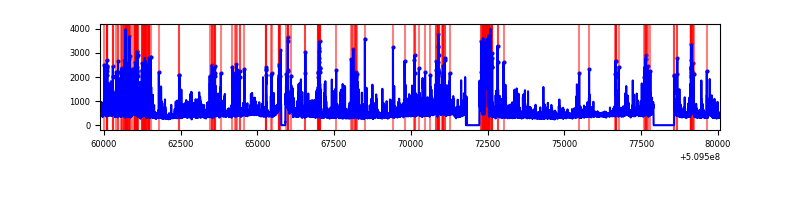 |
| D | 20195 | 18964 | 718 | 718 | 3.56% | 3.79% |  |
Top three noisy pixels from each quadrant. If the there are fewer than three noisy pixels in the level2.evt file, extra rows are filled as -1
| Pixel properties | Quadrant properties | ||||||
|---|---|---|---|---|---|---|---|
| Quadrant | DetID | PixID | Counts | Sigma | Mean | Median | Sigma |
| A | 15 | 32 | 24534934 | 71025.0 | 1374 | 1337 | 345.4 |
| A | 4 | 95 | 2403692 | 6954.84 | 1374 | 1337 | 345.4 |
| A | 8 | 25 | 1592819 | 4607.35 | 1374 | 1337 | 345.4 |
| B | 5 | 172 | 1641264 | 3928.76 | 1962 | 1890 | 417.3 |
| B | 5 | 185 | 938067 | 2243.55 | 1962 | 1890 | 417.3 |
| B | 0 | 231 | 666536 | 1592.82 | 1962 | 1890 | 417.3 |
| C | 12 | 252 | 994900 | 1901.29 | 1913 | 1897 | 522.3 |
| C | 12 | 94 | 652228 | 1245.18 | 1913 | 1897 | 522.3 |
| C | 5 | 250 | 416939 | 794.68 | 1913 | 1897 | 522.3 |
| D | 8 | 129 | 1698345 | 3126.96 | 1900 | 1810 | 542.6 |
| D | 2 | 249 | 672450 | 1236.09 | 1900 | 1810 | 542.6 |
| D | 3 | 12 | 366482 | 672.14 | 1900 | 1810 | 542.6 |
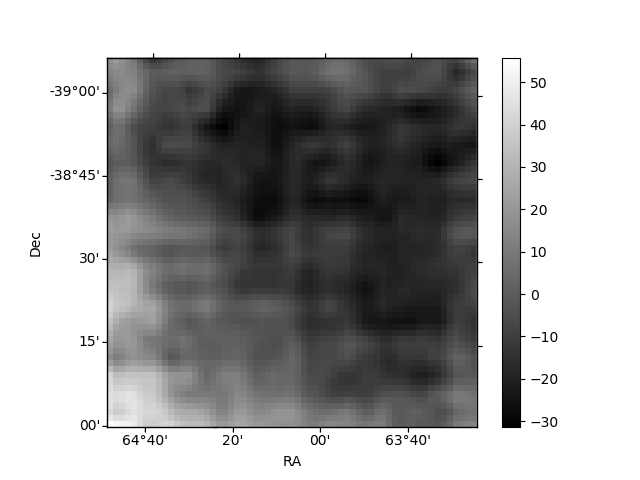
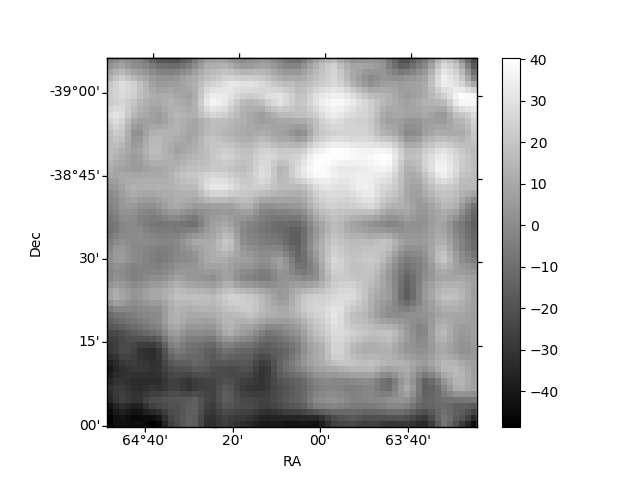
Histogram calculated using DETX and DETY for each event in the final _common_clean file
| Quadrant A | 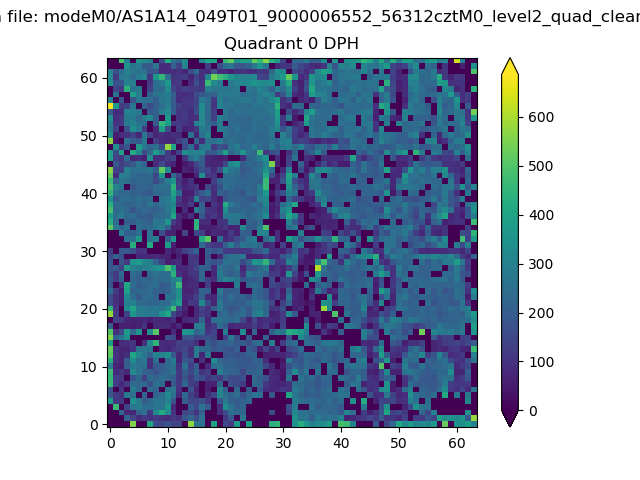 |
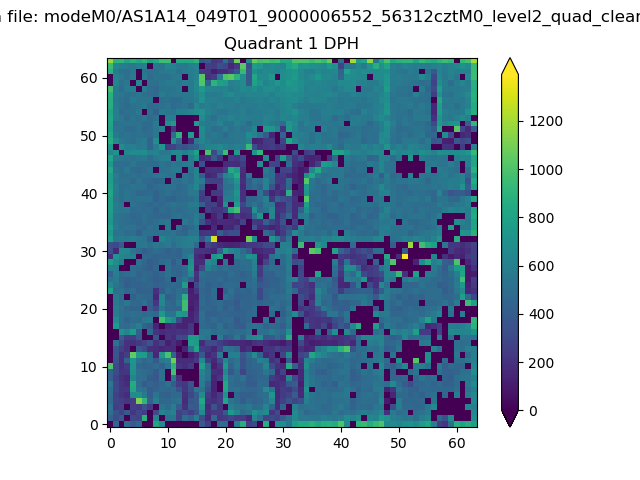 |
Quadrant B |
|---|---|---|---|
| Quadrant D | 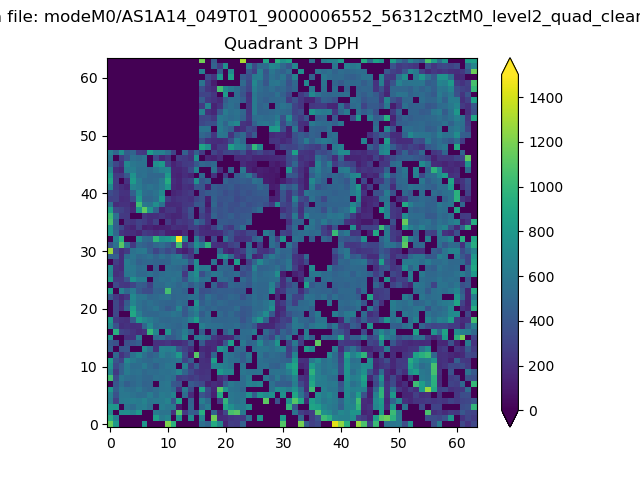 |
 |
Quadrant C |
| Plot type | Count rate plots | Images |
|---|---|---|
| Comparison with Poisson distribution Blue bars denote a histogram of data divided into 1 sec bins. Red curve is a Poisson curve with rate = median count rate of data. |
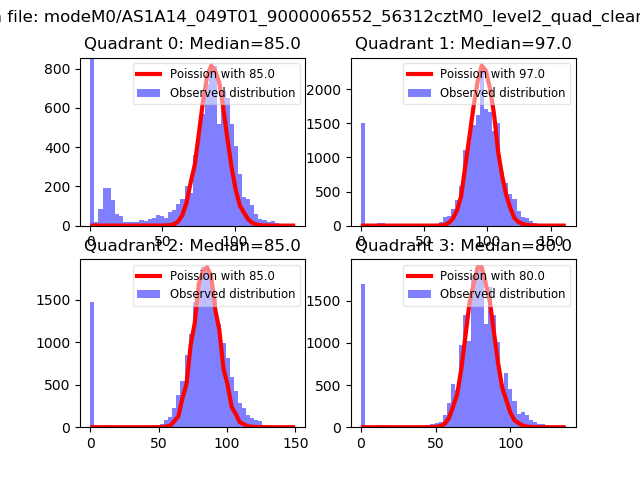 |
 |
| Quadrant-wise count rates Data is divided into 100 sec bins |
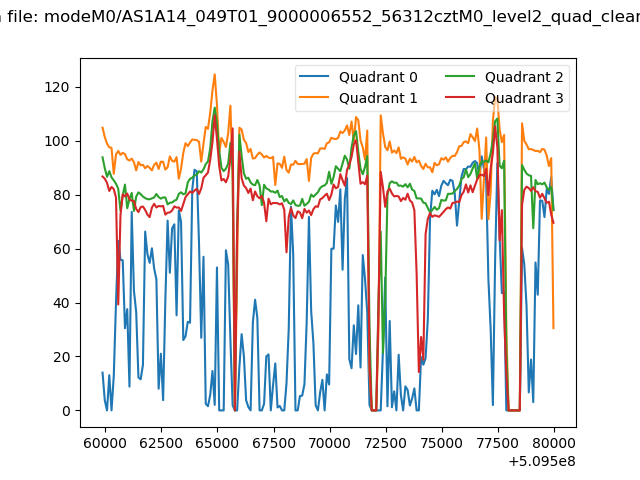 |
|
| Module-wise count rates for Quadrant A Data is divided into 100 sec bins |
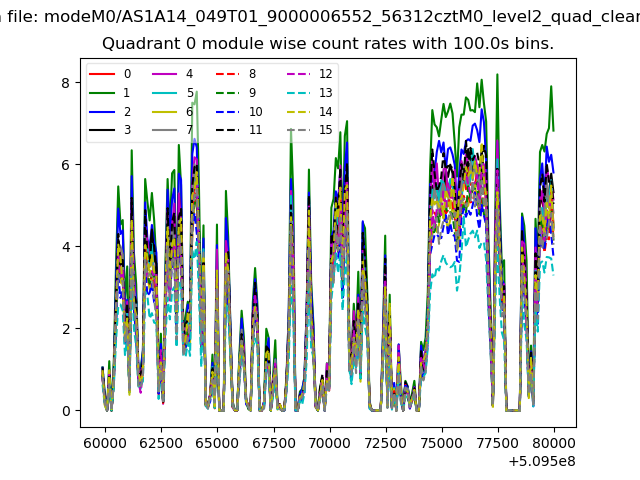 |
 |
| Module-wise count rates for Quadrant B Data is divided into 100 sec bins |
 |
 |
| Module-wise count rates for Quadrant C Data is divided into 100 sec bins |
 |
 |
| Module-wise count rates for Quadrant D Data is divided into 100 sec bins |
 |
 |
| Parameter | Plot |
|---|---|
| CZT HV Monitor | 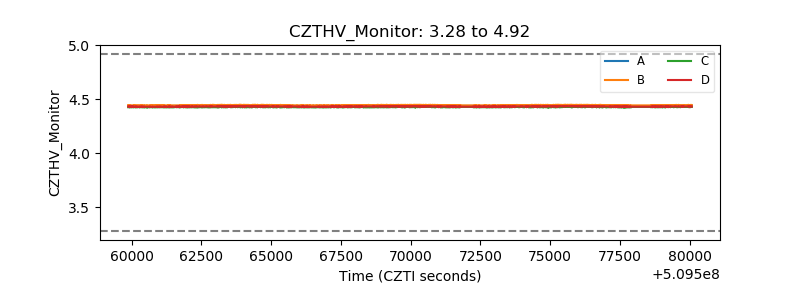 |
| D_VDD |  |
| Temperature 1 |  |
| Veto HV Monitor | 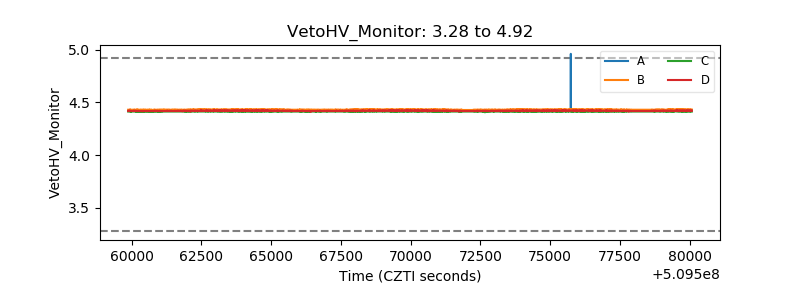 |
| Veto LLD | 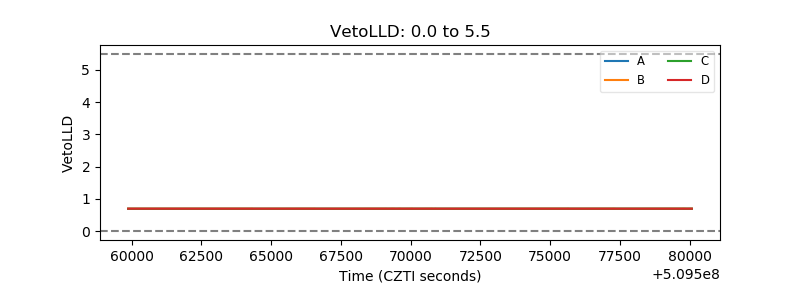 |
| Alpha Counter |  |
| _CPM_Rate | 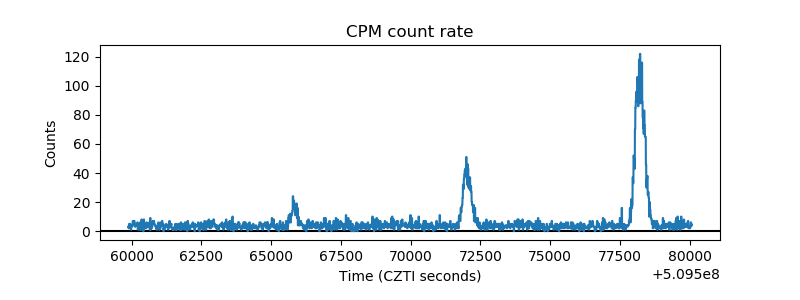 |
| CZT Counter |  |
| +2.5 Volts monitor |  |
| +5 Volts monitor | 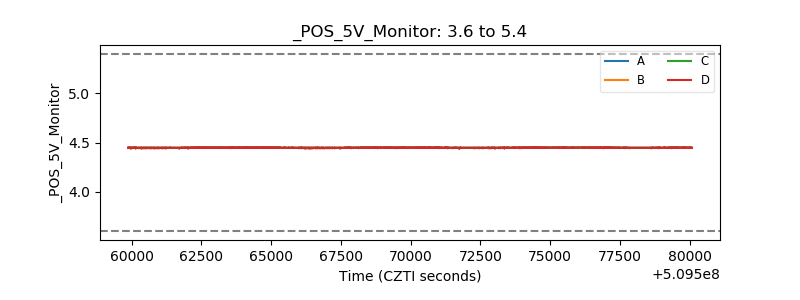 |
| _ROLL_ROT | 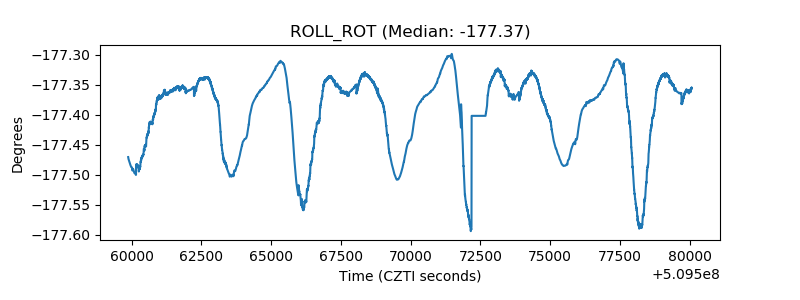 |
| _Roll_DEC | 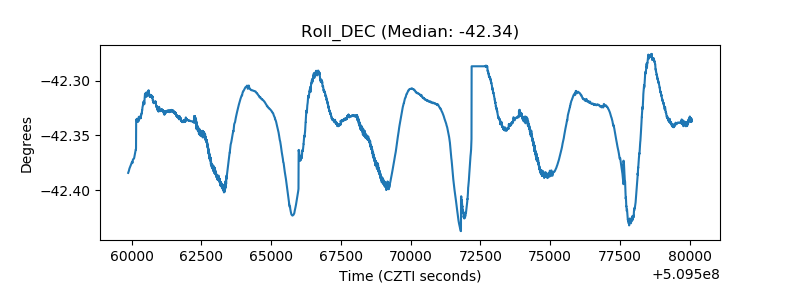 |
| _Roll_RA |  |
| Veto Counter | 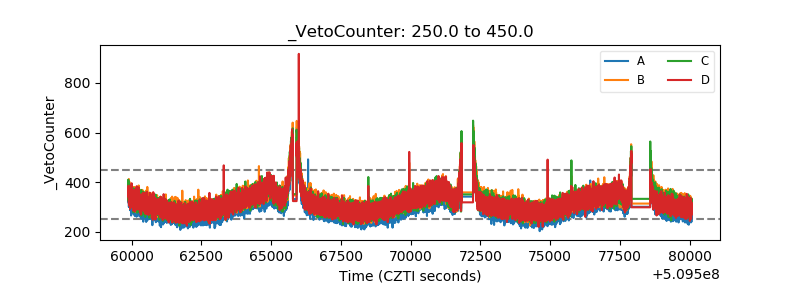 |