| Param | Original file | Final file |
|---|---|---|
| Filename | modeM0/AS1A14_049T01_9000006552_56315cztM0_level2.fits | modeM0/AS1A14_049T01_9000006552_56315cztM0_level2_quad_clean.evt |
| Size (bytes) | 850,389,120 | 83,113,920 |
| Size | 811.0 MB | 79.3 MB |
| Events in quadrant A | 13,848,166 | 272,369 |
| Events in quadrant B | 7,916,860 | 564,584 |
| Events in quadrant C | 3,417,040 | 629,506 |
| Events in quadrant D | 5,754,734 | 562,273 |
| Mode SS | |||
|---|---|---|---|
| Quadrant | BADHDUFLAG | Total packets | Discarded packets |
| A | 0 | 144 | 0 |
| B | 0 | 144 | 0 |
| C | 0 | 144 | 0 |
| D | 0 | 144 | 0 |
| Mode M9 | |||
|---|---|---|---|
| Quadrant | BADHDUFLAG | Total packets | Discarded packets |
| A | 0 | 19 | 0 |
| B | 0 | 19 | 0 |
| C | 0 | 19 | 0 |
| D | 0 | 19 | 0 |
| Mode M0 | |||
|---|---|---|---|
| Quadrant | BADHDUFLAG | Total packets | Discarded packets |
| A | 0 | 45961 | 2 |
| B | 0 | 28318 | 2 |
| C | 0 | 15449 | 2 |
| D | 0 | 21968 | 2 |
| Quadrant | Total seconds | Saturated seconds | Saturation percentage |
|---|---|---|---|
| A | 6998 | 4352 | 62.189197% |
| B | 6998 | 1740 | 24.864247% |
| C | 6998 | 71 | 1.014576% |
| D | 6999 | 484 | 6.915274% |
Noise dominated data is calculated using 1-second bins in cleaned event files. If a bin has >2000 counts, and if more than 50% of those come from <1% of pixels, then it is considered to be noise-dominated and hence unusable.
| Quadrant | # 1 sec bins | Bins with >0 counts | Bins with >2000 counts | High rate bins dominated by noise | Noise dominated (total time) | Noise dominated (detector-on time) | Marked lightcurve |
|---|---|---|---|---|---|---|---|
| A | 8858 | 6999 | 3914 | 3914 | 44.19% | 55.92% |  |
| B | 8858 | 7000 | 1380 | 1380 | 15.58% | 19.71% |  |
| C | 8858 | 7000 | 37 | 37 | 0.42% | 0.53% |  |
| D | 8859 | 7001 | 501 | 501 | 5.66% | 7.16% |  |
Top three noisy pixels from each quadrant. If the there are fewer than three noisy pixels in the level2.evt file, extra rows are filled as -1
| Pixel properties | Quadrant properties | ||||||
|---|---|---|---|---|---|---|---|
| Quadrant | DetID | PixID | Counts | Sigma | Mean | Median | Sigma |
| A | 15 | 32 | 6641739 | 50854.45 | 515 | 502 | 130.6 |
| A | 4 | 95 | 2419610 | 18524.02 | 515 | 502 | 130.6 |
| A | 3 | 62 | 1277927 | 9781.72 | 515 | 502 | 130.6 |
| B | 5 | 172 | 3654128 | 26389.54 | 654 | 630 | 138.4 |
| B | 5 | 185 | 1151030 | 8309.44 | 654 | 630 | 138.4 |
| B | 0 | 231 | 189762 | 1366.12 | 654 | 630 | 138.4 |
| C | 15 | 148 | 241487 | 1216.43 | 720 | 713 | 197.9 |
| C | 12 | 252 | 236549 | 1191.48 | 720 | 713 | 197.9 |
| C | 9 | 237 | 35821 | 177.37 | 720 | 713 | 197.9 |
| D | 8 | 240 | 1097041 | 5551.06 | 692 | 660 | 197.5 |
| D | 8 | 160 | 1023337 | 5177.89 | 692 | 660 | 197.5 |
| D | 2 | 249 | 540384 | 2732.66 | 692 | 660 | 197.5 |
Histogram calculated using DETX and DETY for each event in the final _common_clean file
| Quadrant A |  |
 |
Quadrant B |
|---|---|---|---|
| Quadrant D | 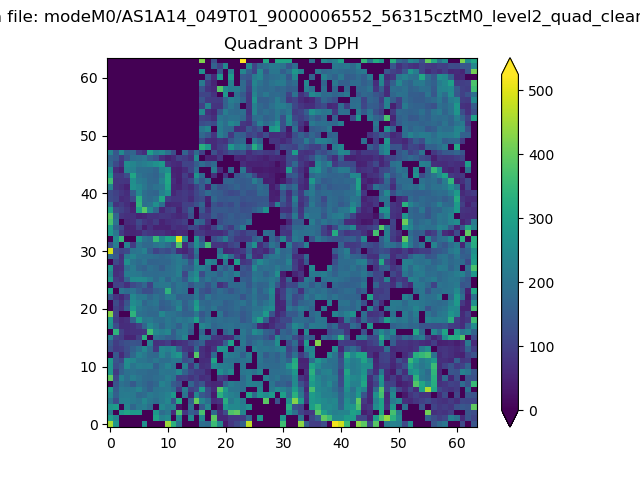 |
 |
Quadrant C |
| Plot type | Count rate plots | Images |
|---|---|---|
| Comparison with Poisson distribution Blue bars denote a histogram of data divided into 1 sec bins. Red curve is a Poisson curve with rate = median count rate of data. |
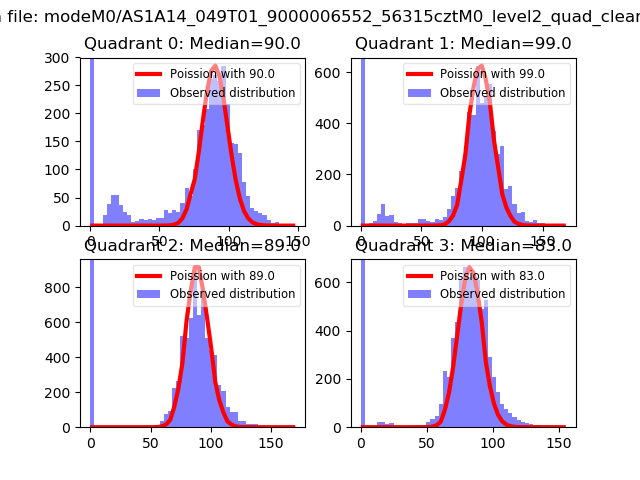 |
 |
| Quadrant-wise count rates Data is divided into 100 sec bins |
 |
|
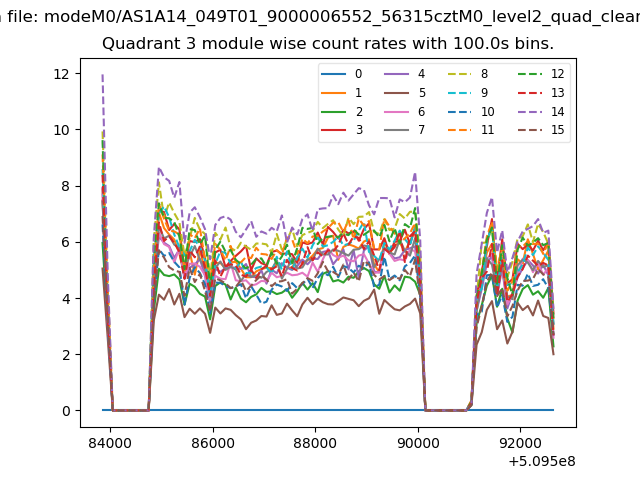
| Module-wise count rates for Quadrant A Data is divided into 100 sec bins |
 |
 |
| Module-wise count rates for Quadrant B Data is divided into 100 sec bins |
 |
 |
| Module-wise count rates for Quadrant C Data is divided into 100 sec bins |
 |
 |
| Module-wise count rates for Quadrant D Data is divided into 100 sec bins |
 |
 |
| Parameter | Plot |
|---|---|
| CZT HV Monitor | 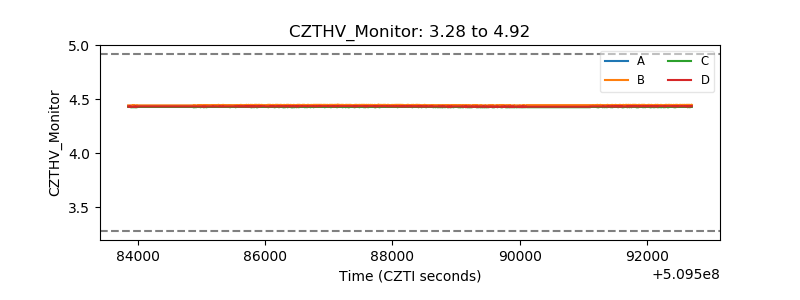 |
| D_VDD |  |
| Temperature 1 | 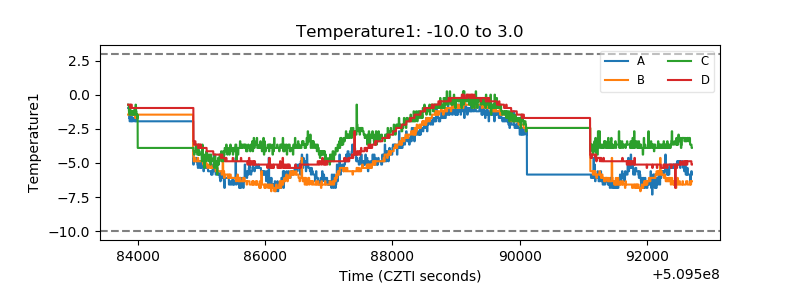 |
| Veto HV Monitor | 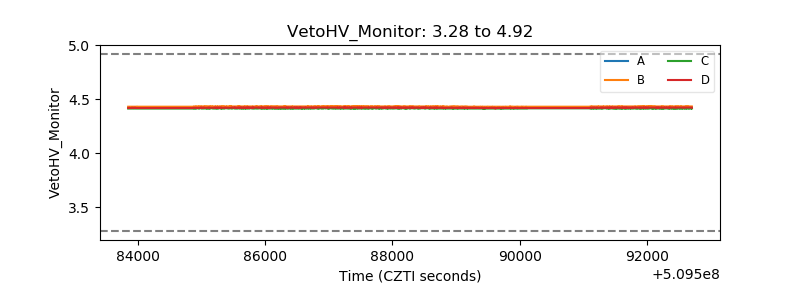 |
| Veto LLD |  |
| Alpha Counter |  |
| _CPM_Rate | 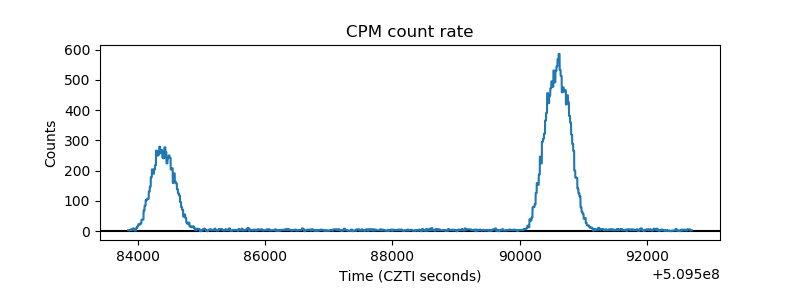 |
| CZT Counter | 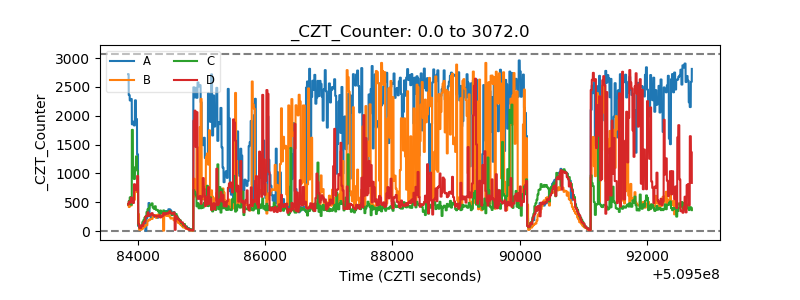 |
| +2.5 Volts monitor | 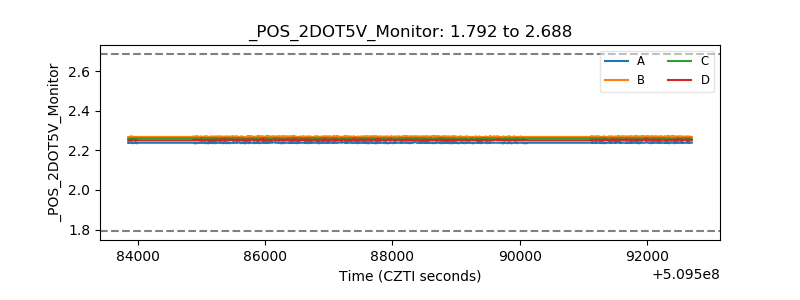 |
| +5 Volts monitor | 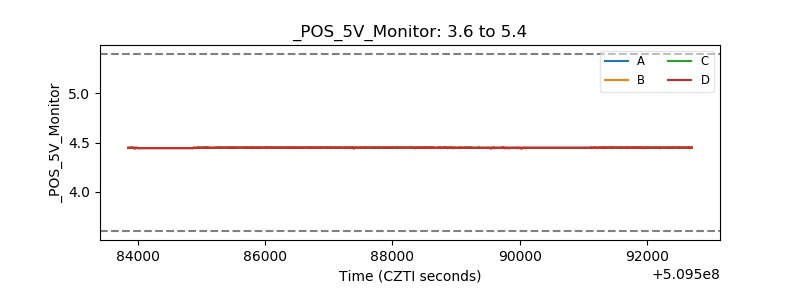 |
| _ROLL_ROT | 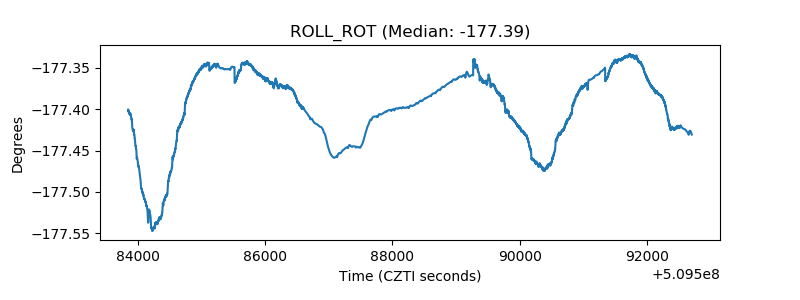 |
| _Roll_DEC | 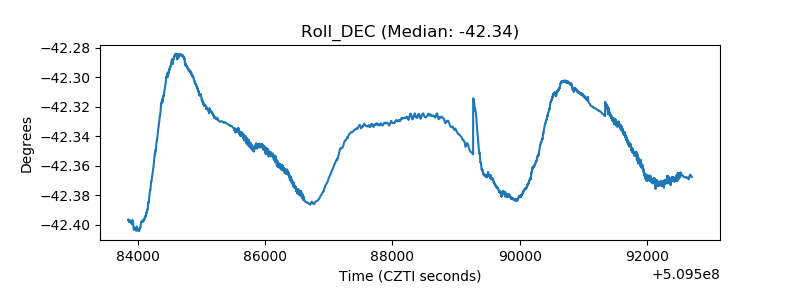 |
| _Roll_RA |  |
| Veto Counter | 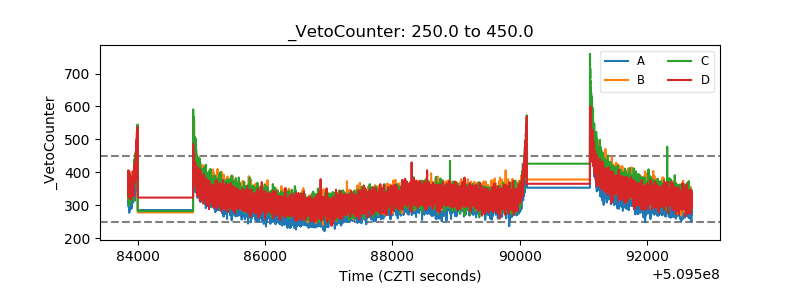 |