| Param | Original file | Final file |
|---|---|---|
| Filename | modeM0/AS1A14_049T01_9000006552_56316cztM0_level2.fits | modeM0/AS1A14_049T01_9000006552_56316cztM0_level2_quad_clean.evt |
| Size (bytes) | 856,056,960 | 74,496,960 |
| Size | 816.4 MB | 71.0 MB |
| Events in quadrant A | 15,831,075 | 83,054 |
| Events in quadrant B | 4,846,170 | 649,683 |
| Events in quadrant C | 3,140,702 | 594,962 |
| Events in quadrant D | 7,367,739 | 475,202 |
| Mode SS | |||
|---|---|---|---|
| Quadrant | BADHDUFLAG | Total packets | Discarded packets |
| A | 0 | 132 | 0 |
| B | 0 | 132 | 0 |
| C | 0 | 132 | 0 |
| D | 0 | 132 | 0 |
| Mode M9 | |||
|---|---|---|---|
| Quadrant | BADHDUFLAG | Total packets | Discarded packets |
| A | 0 | 11 | 0 |
| B | 0 | 11 | 0 |
| C | 0 | 11 | 0 |
| D | 0 | 11 | 0 |
| Mode M0 | |||
|---|---|---|---|
| Quadrant | BADHDUFLAG | Total packets | Discarded packets |
| A | 0 | 51415 | 5 |
| B | 0 | 18775 | 1 |
| C | 0 | 14037 | 1 |
| D | 0 | 26327 | 1 |
| Quadrant | Total seconds | Saturated seconds | Saturation percentage |
|---|---|---|---|
| A | 6486 | 5813 | 89.623805% |
| B | 6486 | 402 | 6.197965% |
| C | 6487 | 52 | 0.801603% |
| D | 6487 | 1111 | 17.126561% |
Noise dominated data is calculated using 1-second bins in cleaned event files. If a bin has >2000 counts, and if more than 50% of those come from <1% of pixels, then it is considered to be noise-dominated and hence unusable.
| Quadrant | # 1 sec bins | Bins with >0 counts | Bins with >2000 counts | High rate bins dominated by noise | Noise dominated (total time) | Noise dominated (detector-on time) | Marked lightcurve |
|---|---|---|---|---|---|---|---|
| A | 7551 | 6486 | 5314 | 5314 | 70.37% | 81.93% |  |
| B | 7551 | 6487 | 263 | 263 | 3.48% | 4.05% |  |
| C | 7552 | 6488 | 11 | 11 | 0.15% | 0.17% |  |
| D | 7552 | 6488 | 1077 | 1077 | 14.26% | 16.60% |  |
Top three noisy pixels from each quadrant. If the there are fewer than three noisy pixels in the level2.evt file, extra rows are filled as -1
| Pixel properties | Quadrant properties | ||||||
|---|---|---|---|---|---|---|---|
| Quadrant | DetID | PixID | Counts | Sigma | Mean | Median | Sigma |
| A | 15 | 32 | 9043312 | 96866.57 | 368 | 360 | 93.4 |
| A | 4 | 95 | 3180095 | 34060.78 | 368 | 360 | 93.4 |
| A | 3 | 14 | 1071513 | 11474.01 | 368 | 360 | 93.4 |
| B | 5 | 172 | 1344406 | 9349.41 | 680 | 656 | 143.7 |
| B | 1 | 255 | 265140 | 1840.2 | 680 | 656 | 143.7 |
| B | 0 | 231 | 184182 | 1276.92 | 680 | 656 | 143.7 |
| C | 12 | 252 | 307838 | 1640.59 | 680 | 675 | 187.2 |
| C | 12 | 94 | 73704 | 390.06 | 680 | 675 | 187.2 |
| C | 6 | 223 | 22083 | 114.34 | 680 | 675 | 187.2 |
| D | 8 | 160 | 1971052 | 11069.37 | 626 | 596 | 178.0 |
| D | 8 | 240 | 1825967 | 10254.33 | 626 | 596 | 178.0 |
| D | 2 | 249 | 504085 | 2828.43 | 626 | 596 | 178.0 |
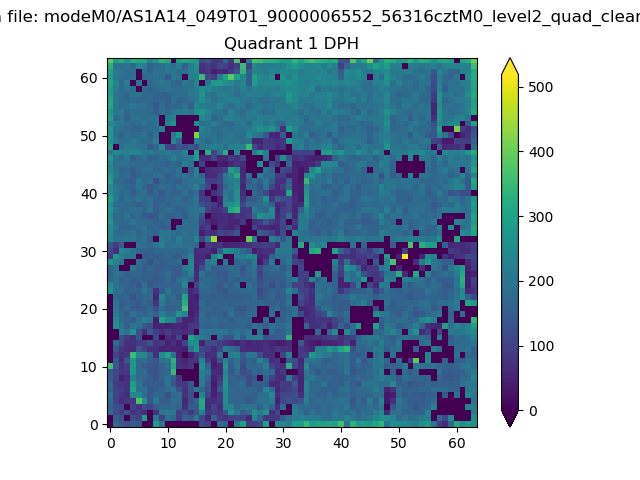
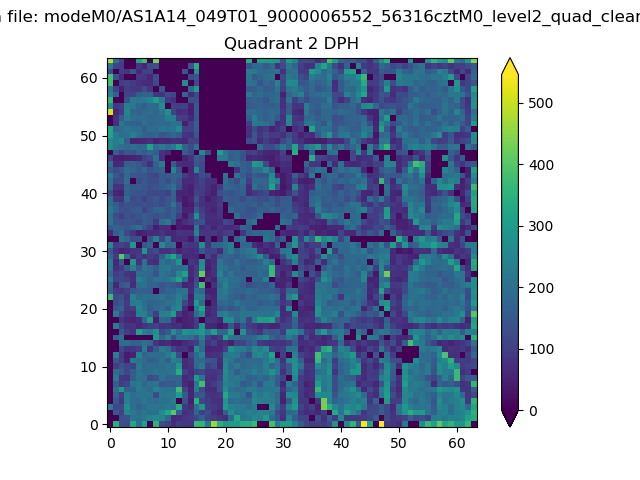
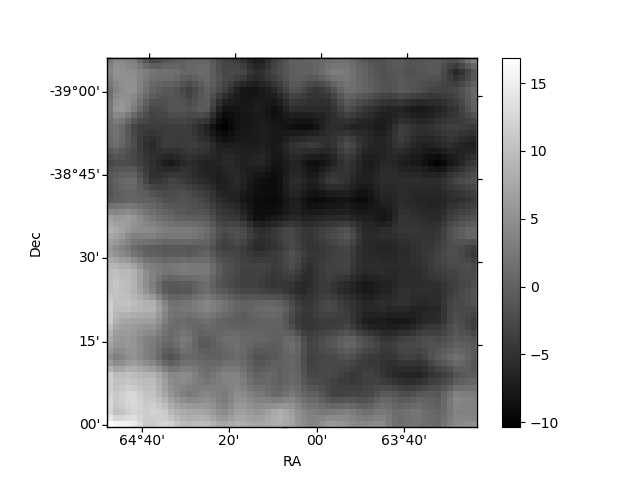
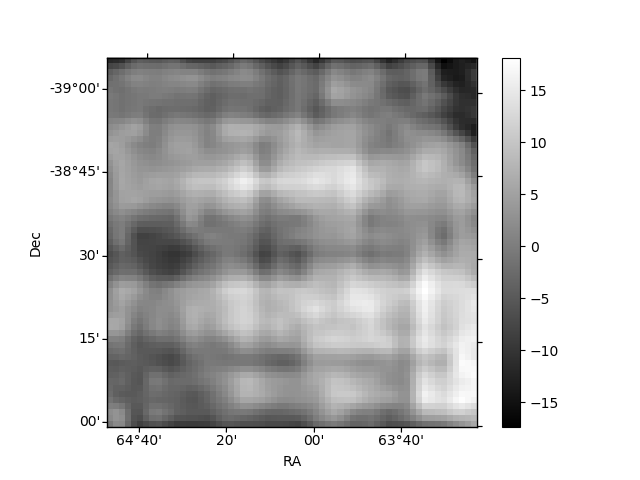
Histogram calculated using DETX and DETY for each event in the final _common_clean file
| Quadrant A |  |
 |
Quadrant B |
|---|---|---|---|
| Quadrant D |  |
 |
Quadrant C |
| Plot type | Count rate plots | Images |
|---|---|---|
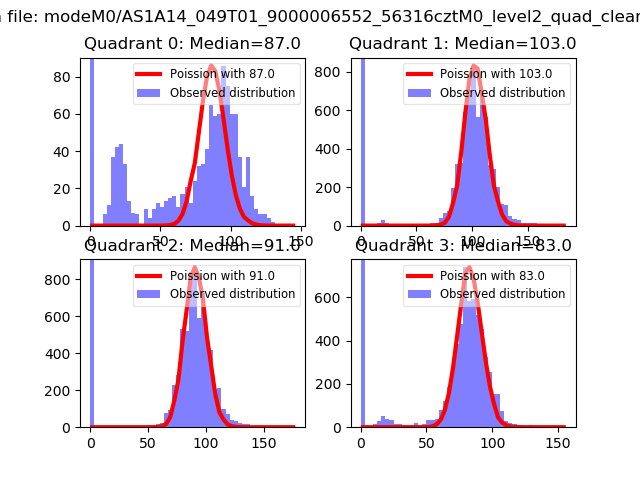
| Comparison with Poisson distribution Blue bars denote a histogram of data divided into 1 sec bins. Red curve is a Poisson curve with rate = median count rate of data. |
 |
 |
| Quadrant-wise count rates Data is divided into 100 sec bins |
 |
|
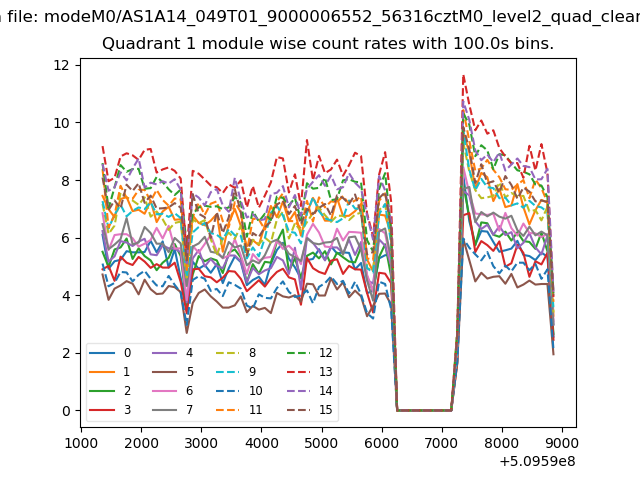
| Module-wise count rates for Quadrant A Data is divided into 100 sec bins |
 |
 |
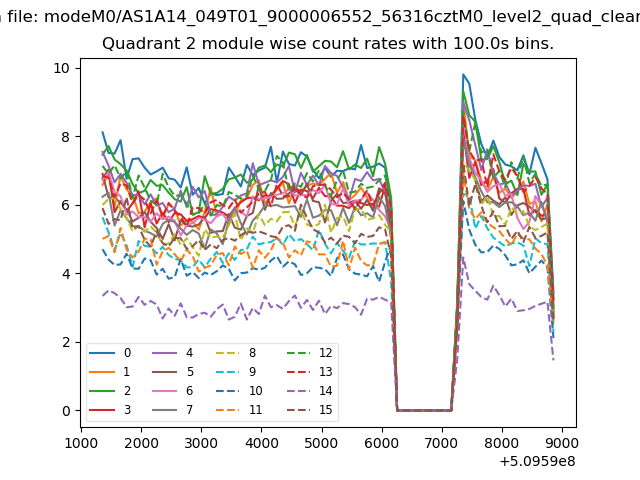
| Module-wise count rates for Quadrant B Data is divided into 100 sec bins |
 |
 |
| Module-wise count rates for Quadrant C Data is divided into 100 sec bins |
 |
 |
| Module-wise count rates for Quadrant D Data is divided into 100 sec bins |
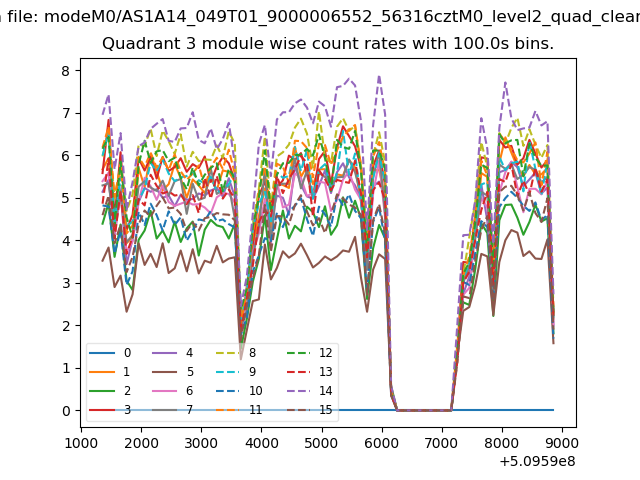 |
 |
| Parameter | Plot |
|---|---|
| CZT HV Monitor |  |
| D_VDD |  |
| Temperature 1 | 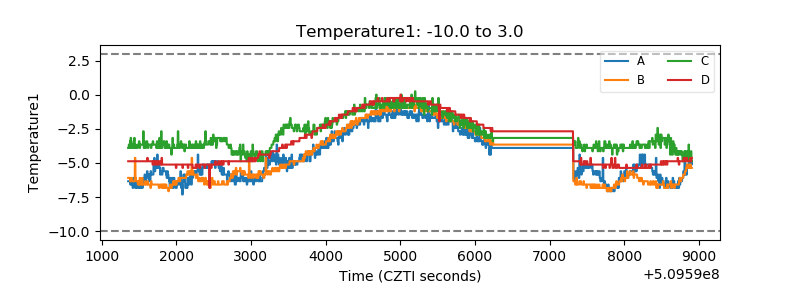 |
| Veto HV Monitor | 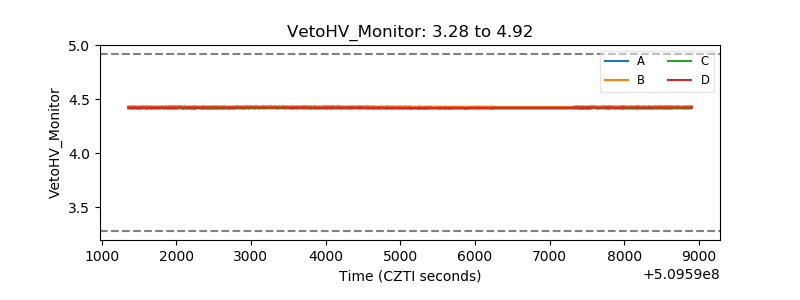 |
| Veto LLD |  |
| Alpha Counter | 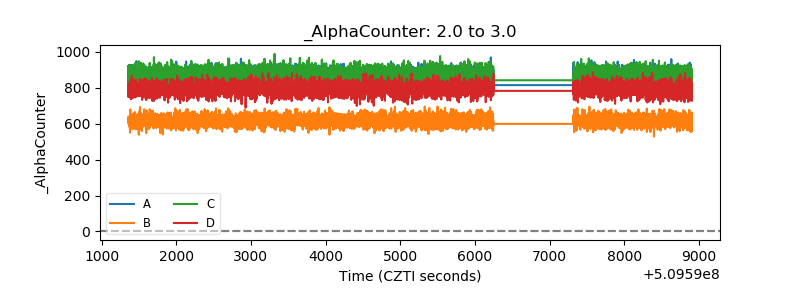 |
| _CPM_Rate | 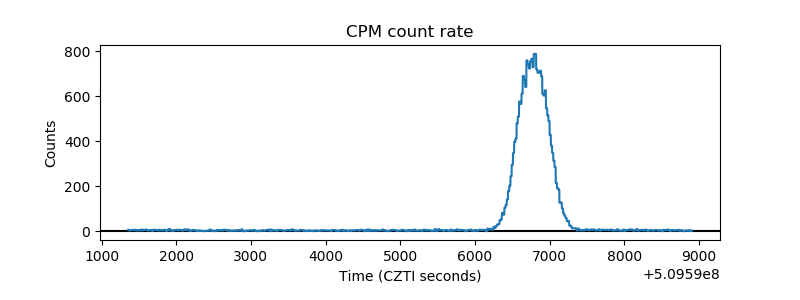 |
| CZT Counter | 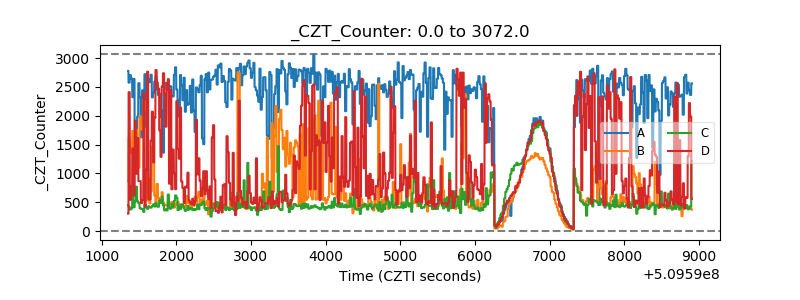 |
| +2.5 Volts monitor | 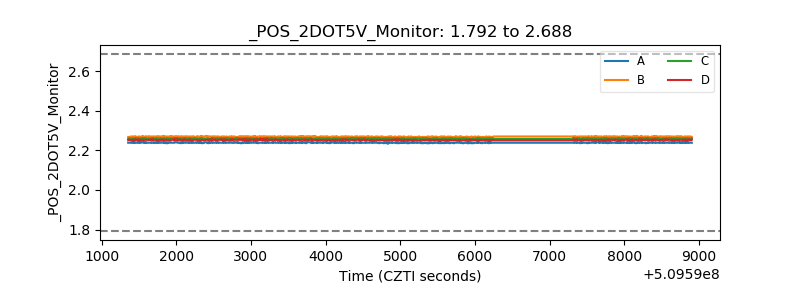 |
| +5 Volts monitor | 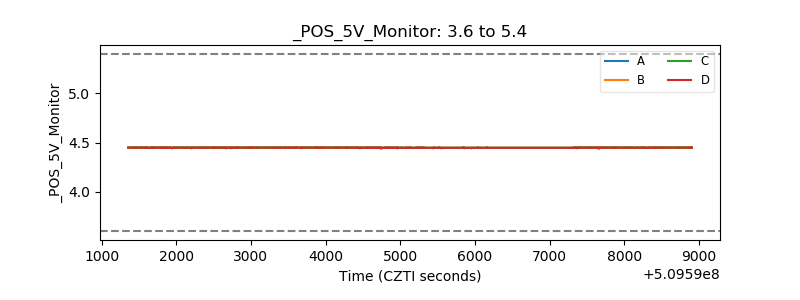 |
| _ROLL_ROT | 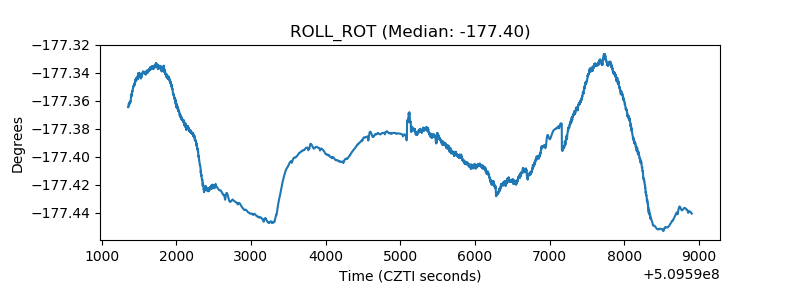 |
| _Roll_DEC | 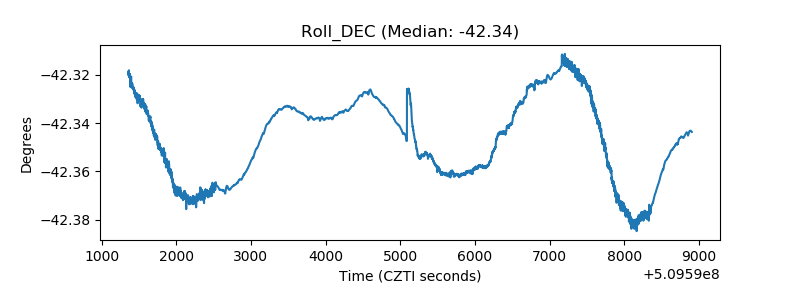 |
| _Roll_RA |  |
| Veto Counter | 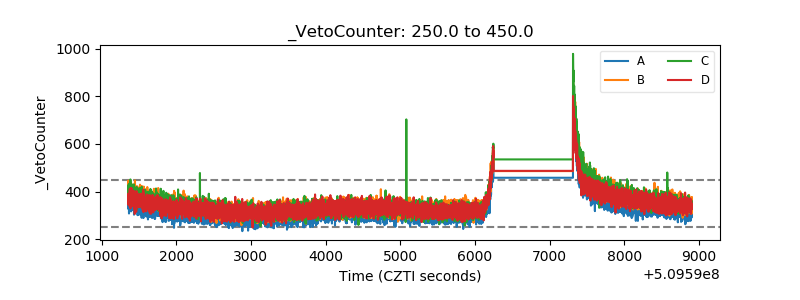 |