| Param | Original file | Final file |
|---|---|---|
| Filename | modeM0/AS1A14_049T01_9000006552_56317cztM0_level2.fits | modeM0/AS1A14_049T01_9000006552_56317cztM0_level2_quad_clean.evt |
| Size (bytes) | 806,074,560 | 77,086,080 |
| Size | 768.7 MB | 73.5 MB |
| Events in quadrant A | 15,003,163 | 121,001 |
| Events in quadrant B | 3,782,265 | 674,503 |
| Events in quadrant C | 3,235,852 | 605,722 |
| Events in quadrant D | 7,320,458 | 486,187 |
| Mode SS | |||
|---|---|---|---|
| Quadrant | BADHDUFLAG | Total packets | Discarded packets |
| A | 0 | 130 | 0 |
| B | 0 | 130 | 0 |
| C | 0 | 130 | 0 |
| D | 0 | 130 | 0 |
| Mode M9 | |||
|---|---|---|---|
| Quadrant | BADHDUFLAG | Total packets | Discarded packets |
| A | 0 | 16 | 0 |
| B | 0 | 17 | 0 |
| C | 0 | 17 | 0 |
| D | 0 | 17 | 0 |
| Mode M0 | |||
|---|---|---|---|
| Quadrant | BADHDUFLAG | Total packets | Discarded packets |
| A | 0 | 48990 | 5 |
| B | 0 | 15570 | 2 |
| C | 0 | 14120 | 2 |
| D | 0 | 26159 | 2 |
| Quadrant | Total seconds | Saturated seconds | Saturation percentage |
|---|---|---|---|
| A | 6401 | 5442 | 85.017966% |
| B | 6401 | 225 | 3.515076% |
| C | 6401 | 90 | 1.406030% |
| D | 6401 | 1175 | 18.356507% |
Noise dominated data is calculated using 1-second bins in cleaned event files. If a bin has >2000 counts, and if more than 50% of those come from <1% of pixels, then it is considered to be noise-dominated and hence unusable.
| Quadrant | # 1 sec bins | Bins with >0 counts | Bins with >2000 counts | High rate bins dominated by noise | Noise dominated (total time) | Noise dominated (detector-on time) | Marked lightcurve |
|---|---|---|---|---|---|---|---|
| A | 7566 | 6401 | 4860 | 4860 | 64.23% | 75.93% |  |
| B | 7566 | 6402 | 59 | 59 | 0.78% | 0.92% |  |
| C | 7566 | 6402 | 27 | 27 | 0.36% | 0.42% | 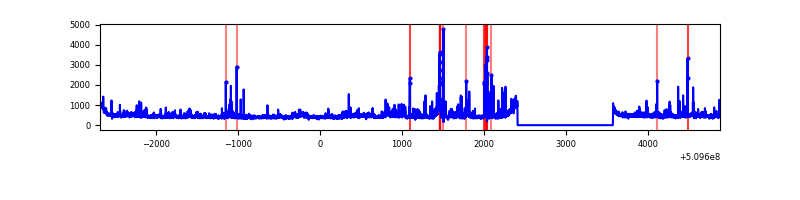 |
| D | 7566 | 6402 | 1113 | 1113 | 14.71% | 17.39% |  |
Top three noisy pixels from each quadrant. If the there are fewer than three noisy pixels in the level2.evt file, extra rows are filled as -1
| Pixel properties | Quadrant properties | ||||||
|---|---|---|---|---|---|---|---|
| Quadrant | DetID | PixID | Counts | Sigma | Mean | Median | Sigma |
| A | 15 | 32 | 7570096 | 71545.77 | 418 | 408 | 105.8 |
| A | 4 | 95 | 4451604 | 42070.98 | 418 | 408 | 105.8 |
| A | 4 | 249 | 360094 | 3399.61 | 418 | 408 | 105.8 |
| B | 1 | 255 | 397359 | 2674.32 | 699 | 675 | 148.3 |
| B | 5 | 185 | 239823 | 1612.26 | 699 | 675 | 148.3 |
| B | 0 | 231 | 142362 | 955.21 | 699 | 675 | 148.3 |
| C | 12 | 252 | 154158 | 804.36 | 695 | 689 | 190.8 |
| C | 12 | 94 | 86559 | 450.06 | 695 | 689 | 190.8 |
| C | 9 | 237 | 66509 | 344.97 | 695 | 689 | 190.8 |
| D | 8 | 160 | 3350552 | 18346.43 | 644 | 614 | 182.6 |
| D | 2 | 249 | 547591 | 2995.6 | 644 | 614 | 182.6 |
| D | 14 | 52 | 371666 | 2032.12 | 644 | 614 | 182.6 |
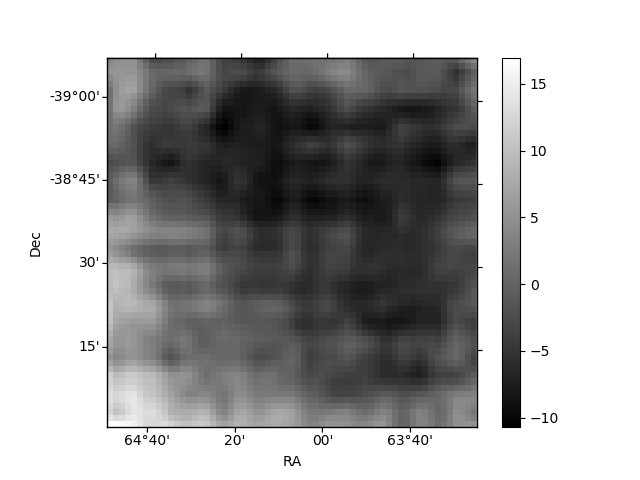
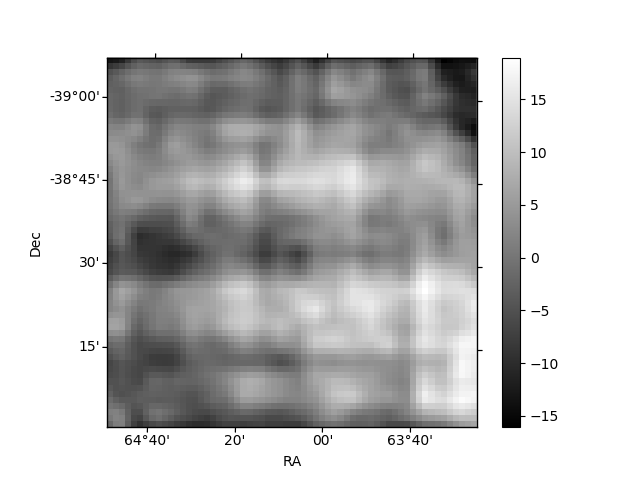
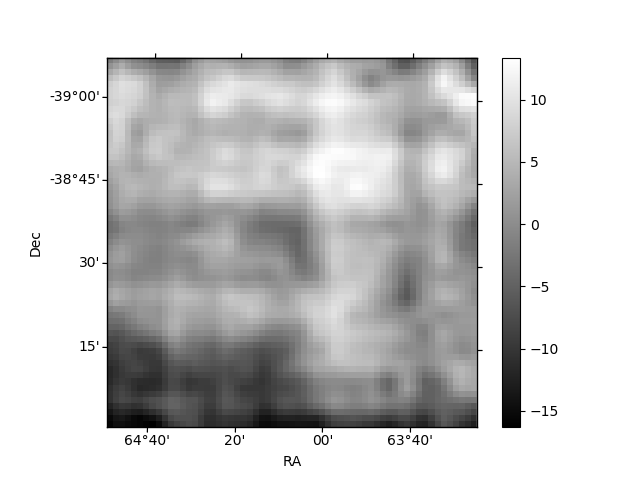
Histogram calculated using DETX and DETY for each event in the final _common_clean file
| Quadrant A | 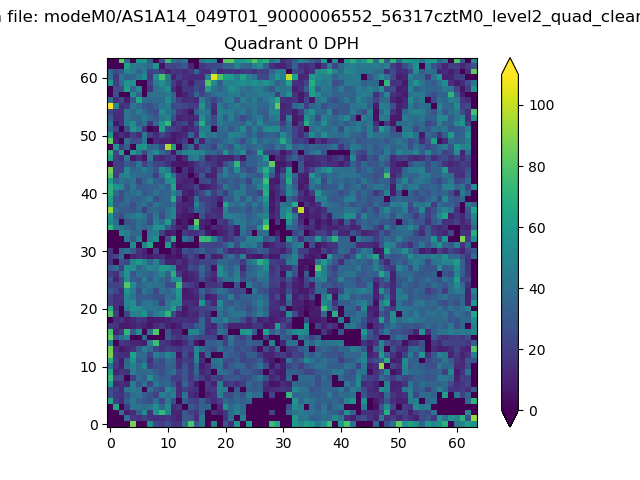 |
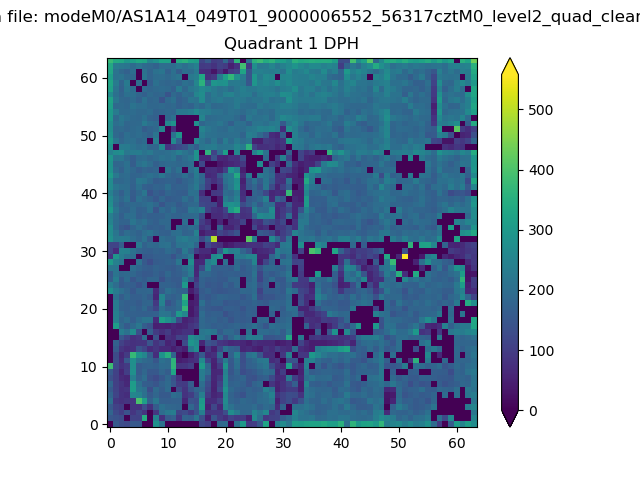 |
Quadrant B |
|---|---|---|---|
| Quadrant D | 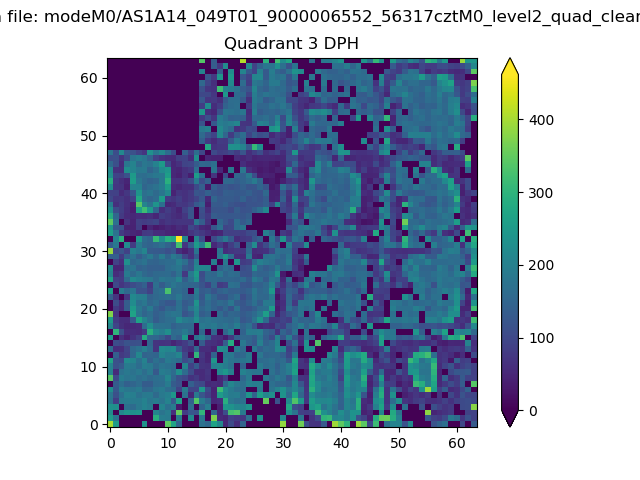 |
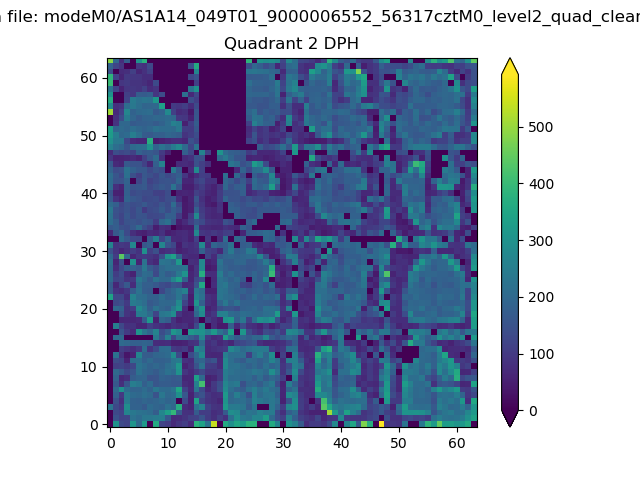 |
Quadrant C |
| Plot type | Count rate plots | Images |
|---|---|---|
| Comparison with Poisson distribution Blue bars denote a histogram of data divided into 1 sec bins. Red curve is a Poisson curve with rate = median count rate of data. |
 |
 |
| Quadrant-wise count rates Data is divided into 100 sec bins |
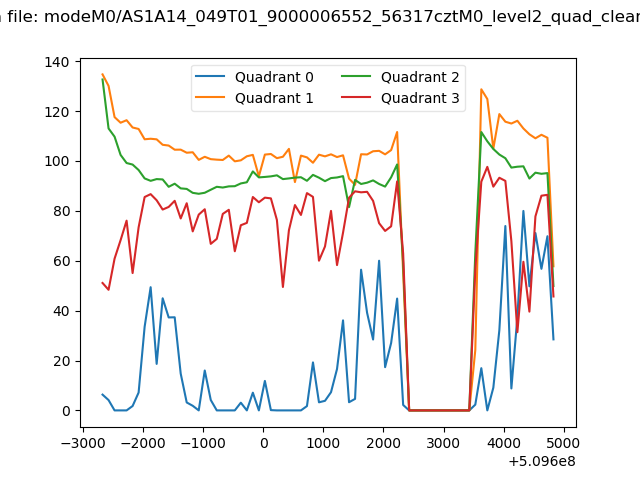 |
|
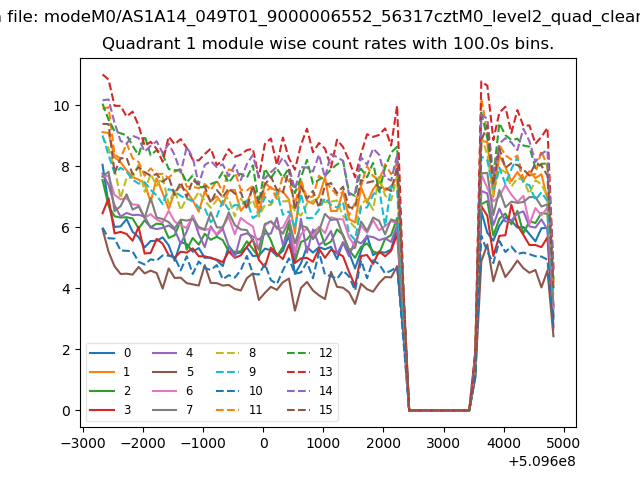
| Module-wise count rates for Quadrant A Data is divided into 100 sec bins |
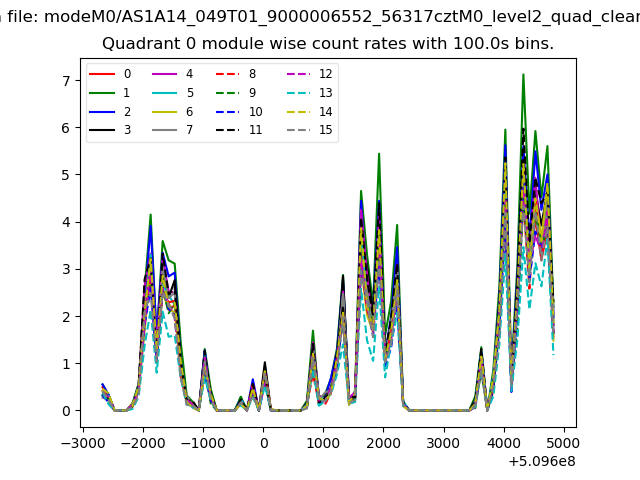 |
 |
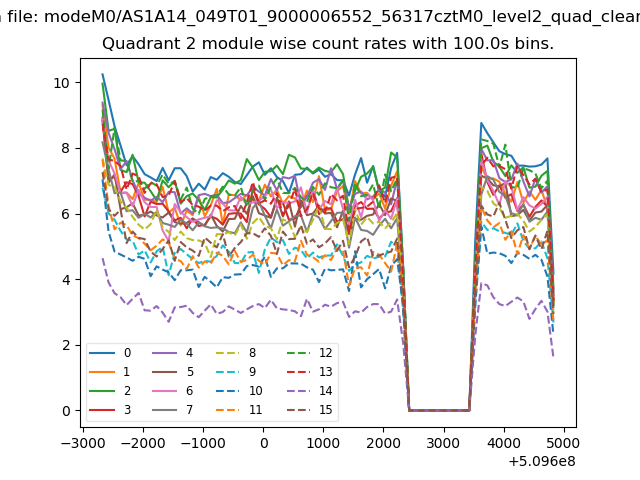
| Module-wise count rates for Quadrant B Data is divided into 100 sec bins |
 |
 |
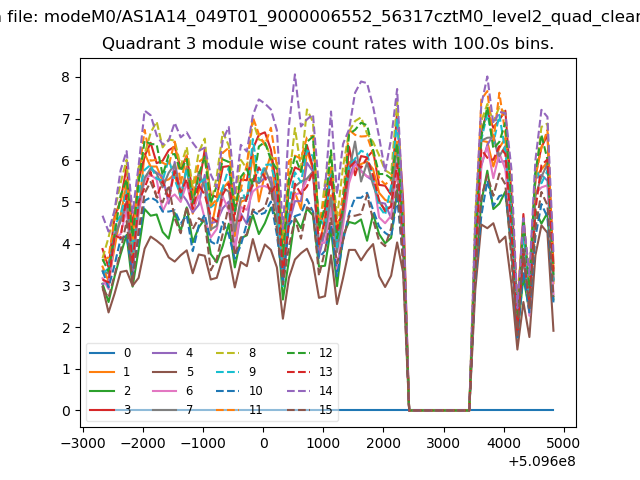
| Module-wise count rates for Quadrant C Data is divided into 100 sec bins |
 |
 |
| Module-wise count rates for Quadrant D Data is divided into 100 sec bins |
 |
 |
| Parameter | Plot |
|---|---|
| CZT HV Monitor | 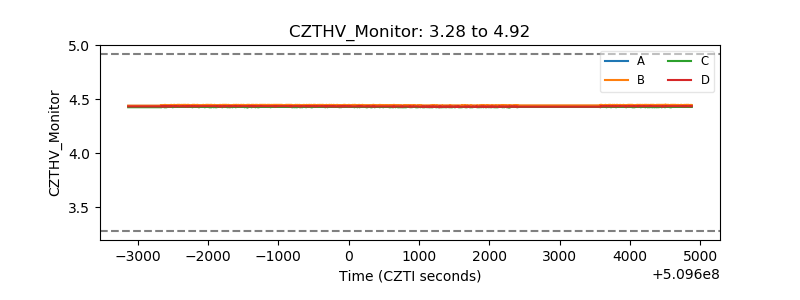 |
| D_VDD | 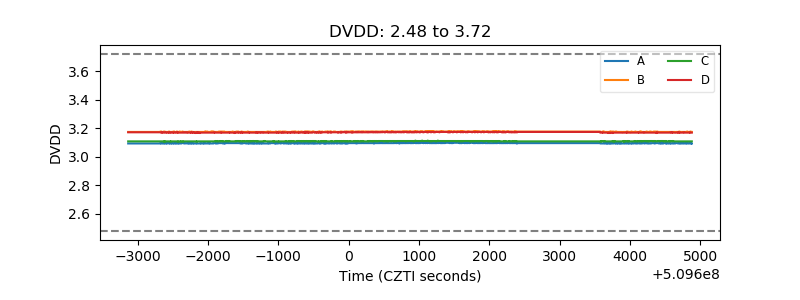 |
| Temperature 1 | 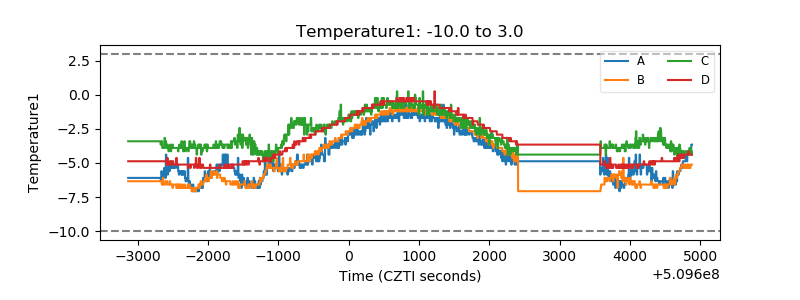 |
| Veto HV Monitor | 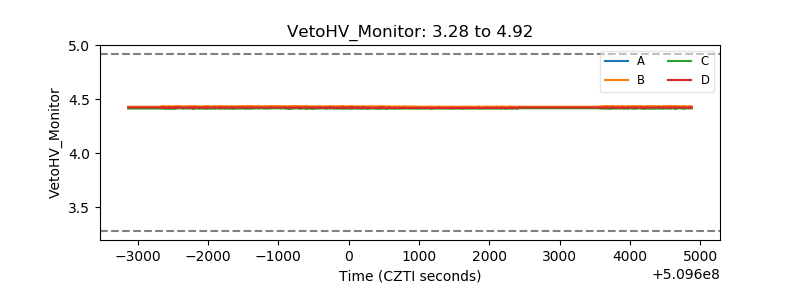 |
| Veto LLD | 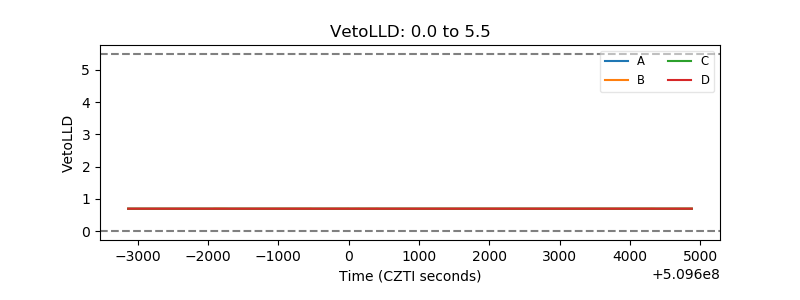 |
| Alpha Counter |  |
| _CPM_Rate |  |
| CZT Counter | 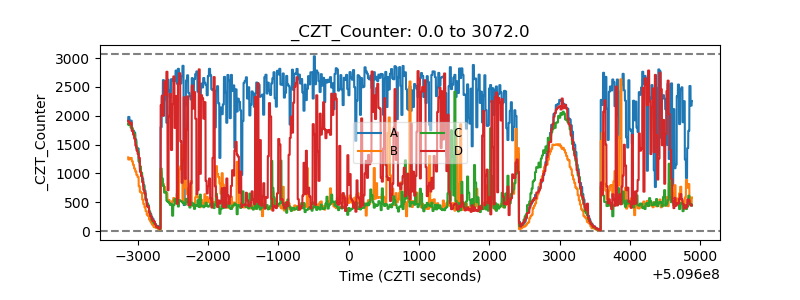 |
| +2.5 Volts monitor | 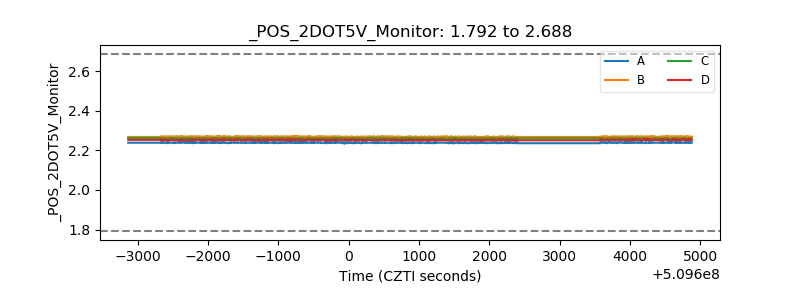 |
| +5 Volts monitor |  |
| _ROLL_ROT | 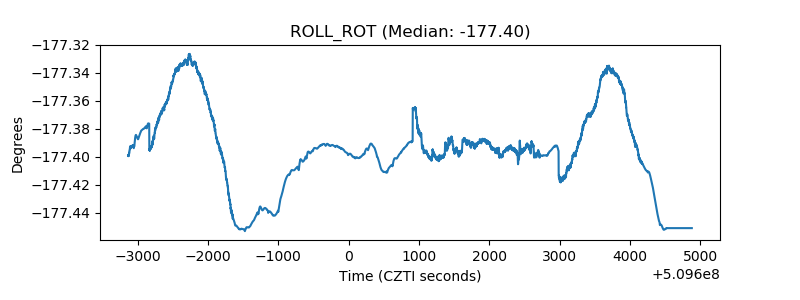 |
| _Roll_DEC | 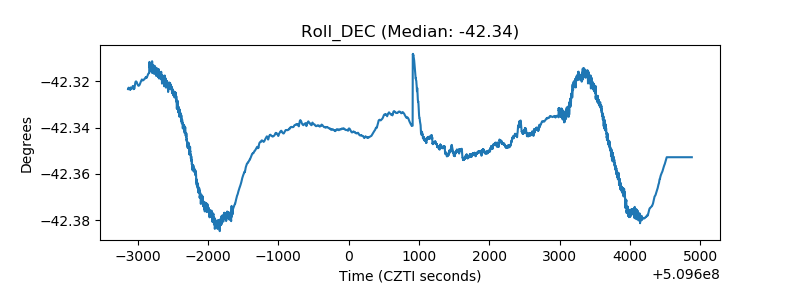 |
| _Roll_RA |  |
| Veto Counter | 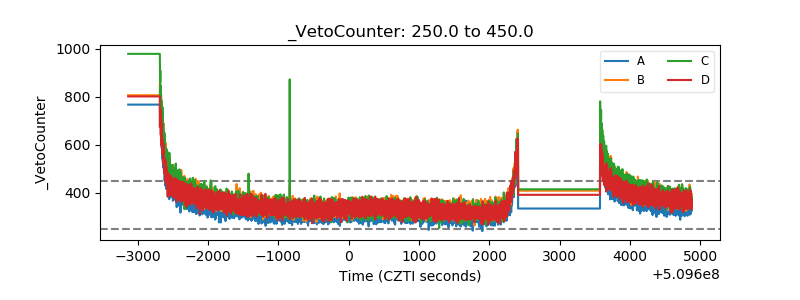 |