| Param | Original file | Final file |
|---|---|---|
| Filename | modeM0/AS1A14_049T01_9000006552_56318cztM0_level2.fits | modeM0/AS1A14_049T01_9000006552_56318cztM0_level2_quad_clean.evt |
| Size (bytes) | 600,638,400 | 90,722,880 |
| Size | 572.8 MB | 86.5 MB |
| Events in quadrant A | 9,443,479 | 454,084 |
| Events in quadrant B | 4,302,677 | 670,543 |
| Events in quadrant C | 3,254,208 | 620,351 |
| Events in quadrant D | 4,732,005 | 551,728 |
| Mode SS | |||
|---|---|---|---|
| Quadrant | BADHDUFLAG | Total packets | Discarded packets |
| A | 0 | 132 | 0 |
| B | 0 | 132 | 0 |
| C | 0 | 132 | 0 |
| D | 0 | 132 | 0 |
| Mode M9 | |||
|---|---|---|---|
| Quadrant | BADHDUFLAG | Total packets | Discarded packets |
| A | 0 | 24 | 0 |
| B | 0 | 24 | 0 |
| C | 0 | 24 | 0 |
| D | 0 | 24 | 0 |
| Mode M0 | |||
|---|---|---|---|
| Quadrant | BADHDUFLAG | Total packets | Discarded packets |
| A | 0 | 32564 | 2 |
| B | 0 | 17139 | 2 |
| C | 0 | 14184 | 2 |
| D | 0 | 18515 | 2 |
| Quadrant | Total seconds | Saturated seconds | Saturation percentage |
|---|---|---|---|
| A | 6376 | 2132 | 33.437892% |
| B | 6488 | 458 | 7.059186% |
| C | 6488 | 108 | 1.664612% |
| D | 6488 | 454 | 6.997534% |
Noise dominated data is calculated using 1-second bins in cleaned event files. If a bin has >2000 counts, and if more than 50% of those come from <1% of pixels, then it is considered to be noise-dominated and hence unusable.
| Quadrant | # 1 sec bins | Bins with >0 counts | Bins with >2000 counts | High rate bins dominated by noise | Noise dominated (total time) | Noise dominated (detector-on time) | Marked lightcurve |
|---|---|---|---|---|---|---|---|
| A | 8788 | 6379 | 1927 | 1927 | 21.93% | 30.21% |  |
| B | 8788 | 6490 | 199 | 199 | 2.26% | 3.07% |  |
| C | 8788 | 6490 | 11 | 11 | 0.13% | 0.17% |  |
| D | 8788 | 6490 | 363 | 363 | 4.13% | 5.59% | 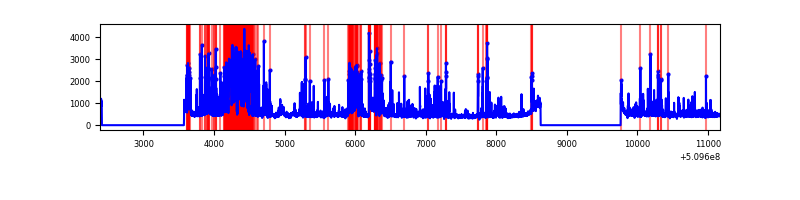 |
Top three noisy pixels from each quadrant. If the there are fewer than three noisy pixels in the level2.evt file, extra rows are filled as -1
| Pixel properties | Quadrant properties | ||||||
|---|---|---|---|---|---|---|---|
| Quadrant | DetID | PixID | Counts | Sigma | Mean | Median | Sigma |
| A | 11 | 31 | 2200693 | 13981.78 | 641 | 624 | 157.4 |
| A | 4 | 95 | 2101945 | 13354.22 | 641 | 624 | 157.4 |
| A | 15 | 32 | 1069556 | 6793.23 | 641 | 624 | 157.4 |
| B | 5 | 185 | 682641 | 4546.86 | 707 | 683 | 150.0 |
| B | 0 | 231 | 223284 | 1484.16 | 707 | 683 | 150.0 |
| B | 1 | 255 | 208954 | 1388.62 | 707 | 683 | 150.0 |
| C | 12 | 252 | 211180 | 1083.19 | 714 | 707 | 194.3 |
| C | 13 | 3 | 60597 | 308.22 | 714 | 707 | 194.3 |
| C | 15 | 198 | 52120 | 264.6 | 714 | 707 | 194.3 |
| D | 8 | 160 | 889815 | 4506.22 | 695 | 661 | 197.3 |
| D | 7 | 96 | 255061 | 1289.3 | 695 | 661 | 197.3 |
| D | 2 | 249 | 205523 | 1038.24 | 695 | 661 | 197.3 |
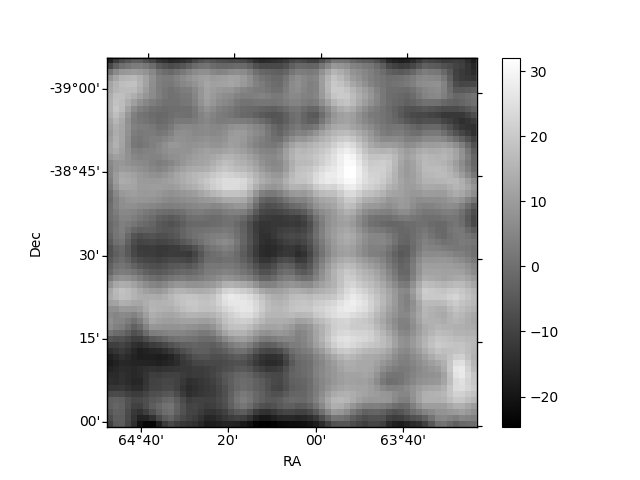
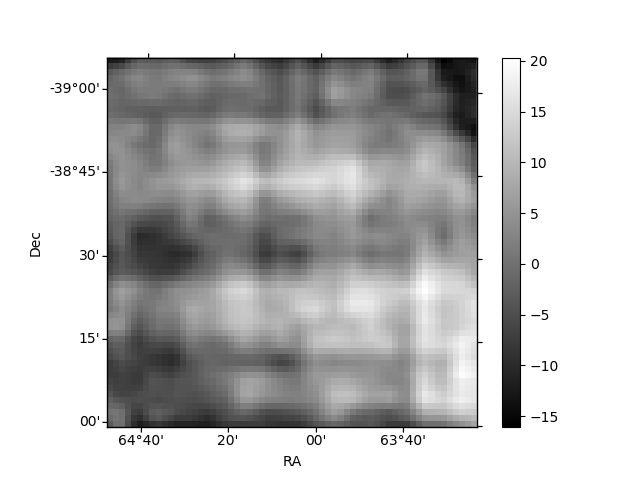
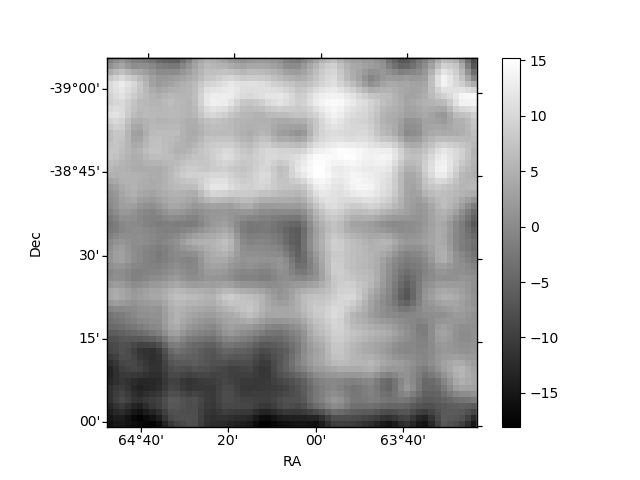
Histogram calculated using DETX and DETY for each event in the final _common_clean file
| Quadrant A |  |
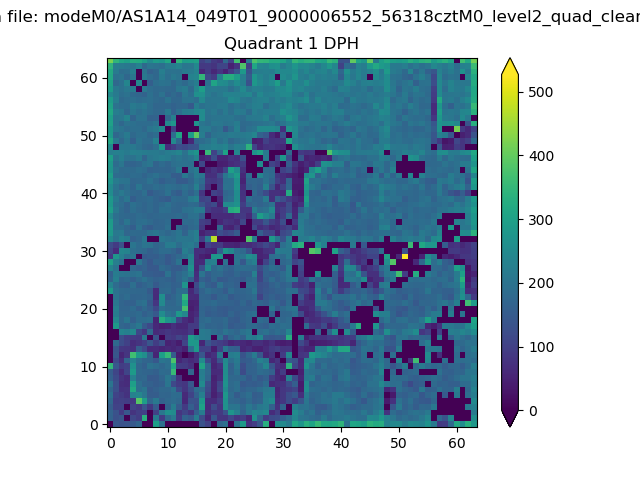 |
Quadrant B |
|---|---|---|---|
| Quadrant D |  |
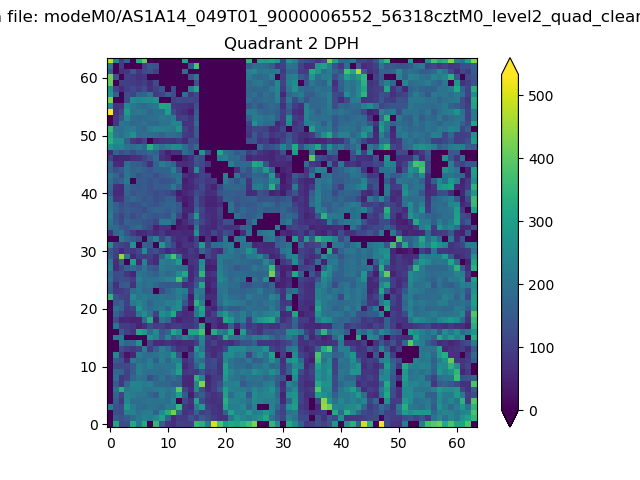 |
Quadrant C |
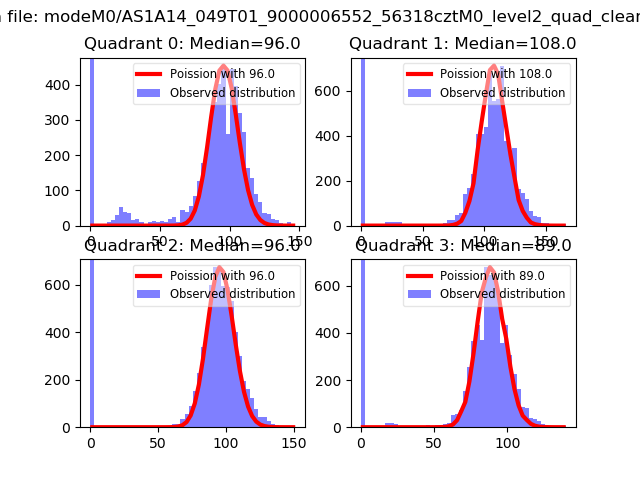
| Plot type | Count rate plots | Images |
|---|---|---|
| Comparison with Poisson distribution Blue bars denote a histogram of data divided into 1 sec bins. Red curve is a Poisson curve with rate = median count rate of data. |
 |
 |
| Quadrant-wise count rates Data is divided into 100 sec bins |
 |
|
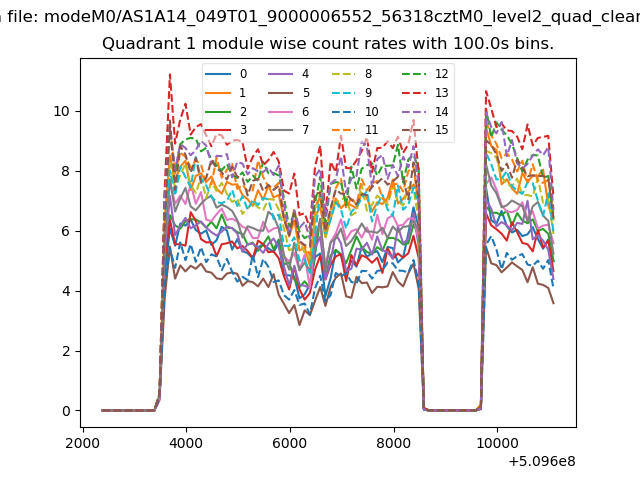
| Module-wise count rates for Quadrant A Data is divided into 100 sec bins |
 |
 |
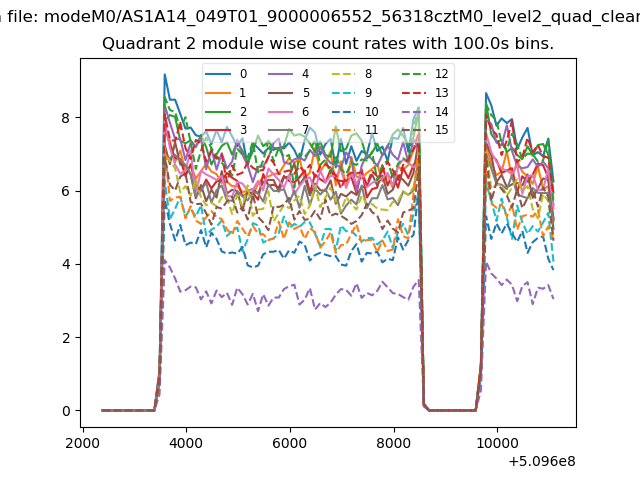
| Module-wise count rates for Quadrant B Data is divided into 100 sec bins |
 |
 |
| Module-wise count rates for Quadrant C Data is divided into 100 sec bins |
 |
 |
| Module-wise count rates for Quadrant D Data is divided into 100 sec bins |
 |
 |
| Parameter | Plot |
|---|---|
| CZT HV Monitor | 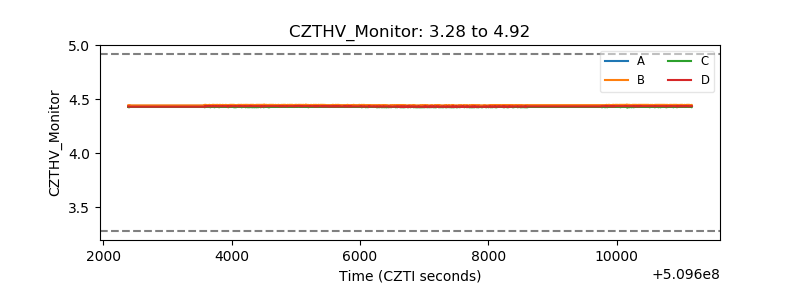 |
| D_VDD |  |
| Temperature 1 | 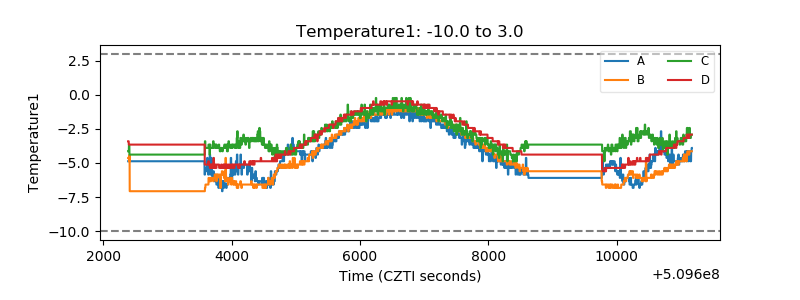 |
| Veto HV Monitor | 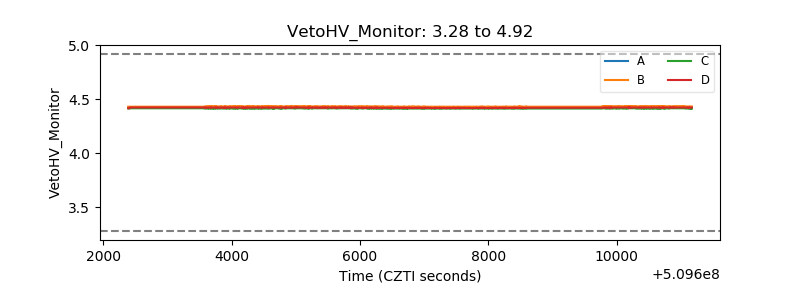 |
| Veto LLD |  |
| Alpha Counter |  |
| _CPM_Rate | 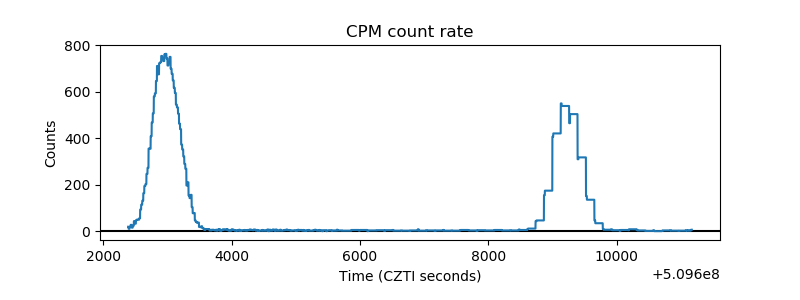 |
| CZT Counter | 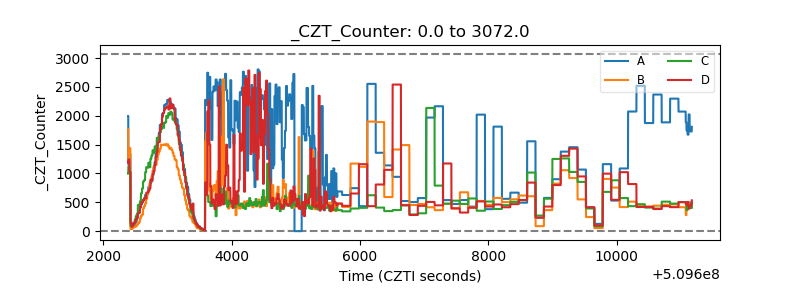 |
| +2.5 Volts monitor | 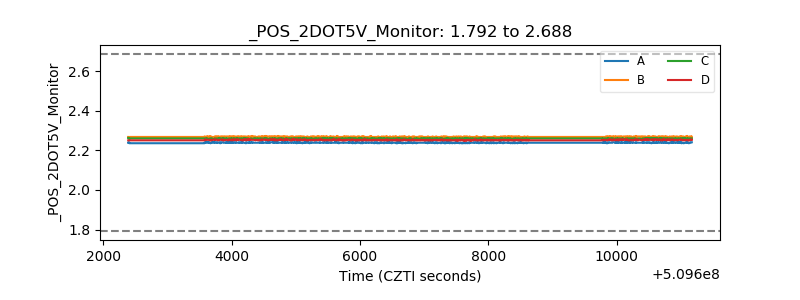 |
| +5 Volts monitor | 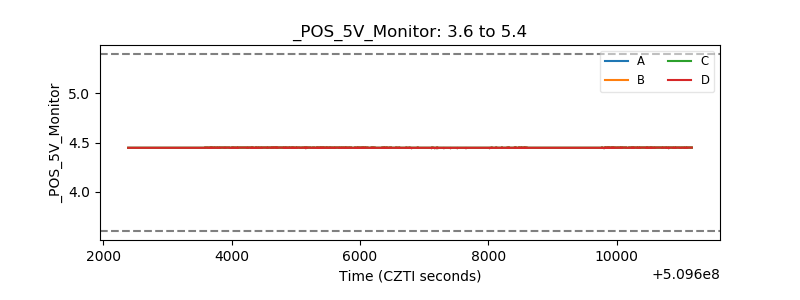 |
| _ROLL_ROT | 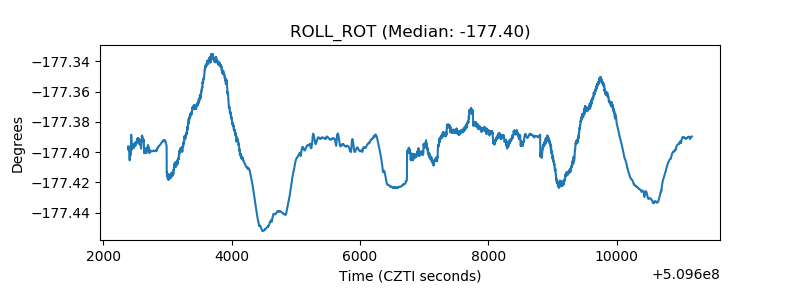 |
| _Roll_DEC | 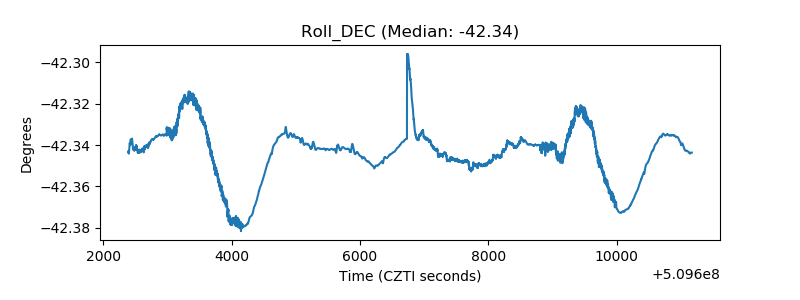 |
| _Roll_RA |  |
| Veto Counter | 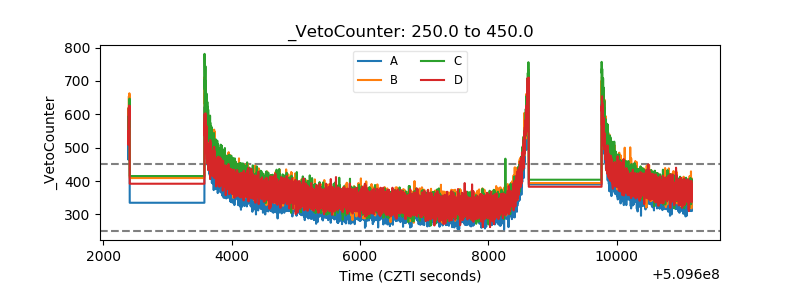 |