| Param | Original file | Final file |
|---|---|---|
| Filename | modeM0/AS1A14_049T01_9000006552_56320cztM0_level2.fits | modeM0/AS1A14_049T01_9000006552_56320cztM0_level2_quad_clean.evt |
| Size (bytes) | 746,602,560 | 87,240,960 |
| Size | 712.0 MB | 83.2 MB |
| Events in quadrant A | 11,142,333 | 396,394 |
| Events in quadrant B | 7,531,235 | 572,572 |
| Events in quadrant C | 3,431,826 | 634,838 |
| Events in quadrant D | 4,995,106 | 555,397 |
| Mode SS | |||
|---|---|---|---|
| Quadrant | BADHDUFLAG | Total packets | Discarded packets |
| A | 0 | 142 | 0 |
| B | 0 | 142 | 0 |
| C | 0 | 142 | 0 |
| D | 0 | 142 | 0 |
| Mode M9 | |||
|---|---|---|---|
| Quadrant | BADHDUFLAG | Total packets | Discarded packets |
| A | 0 | 8 | 0 |
| B | 0 | 9 | 0 |
| C | 0 | 9 | 0 |
| D | 0 | 9 | 0 |
| Mode M0 | |||
|---|---|---|---|
| Quadrant | BADHDUFLAG | Total packets | Discarded packets |
| A | 0 | 37786 | 2 |
| B | 0 | 27169 | 2 |
| C | 0 | 15247 | 2 |
| D | 0 | 19630 | 2 |
| Quadrant | Total seconds | Saturated seconds | Saturation percentage |
|---|---|---|---|
| A | 6915 | 3107 | 44.931309% |
| B | 6915 | 1647 | 23.817787% |
| C | 6915 | 163 | 2.357195% |
| D | 6915 | 620 | 8.966016% |
Noise dominated data is calculated using 1-second bins in cleaned event files. If a bin has >2000 counts, and if more than 50% of those come from <1% of pixels, then it is considered to be noise-dominated and hence unusable.
| Quadrant | # 1 sec bins | Bins with >0 counts | Bins with >2000 counts | High rate bins dominated by noise | Noise dominated (total time) | Noise dominated (detector-on time) | Marked lightcurve |
|---|---|---|---|---|---|---|---|
| A | 7755 | 6916 | 2778 | 2778 | 35.82% | 40.17% | 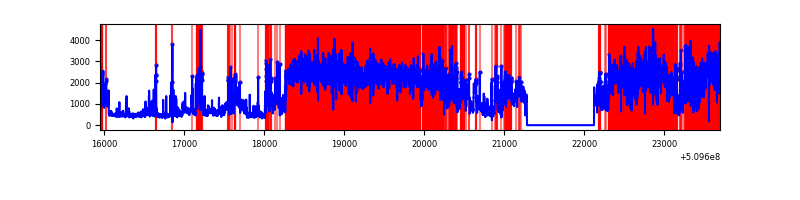 |
| B | 7755 | 6916 | 1111 | 1111 | 14.33% | 16.06% | 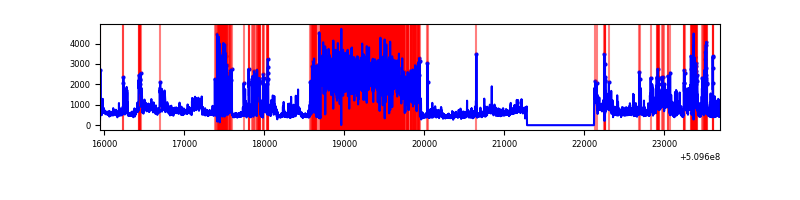 |
| C | 7755 | 6916 | 26 | 26 | 0.34% | 0.38% | 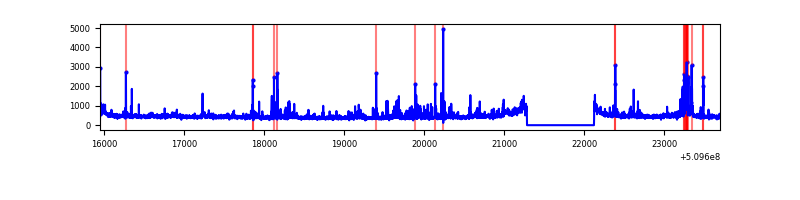 |
| D | 7755 | 6916 | 310 | 310 | 4.00% | 4.48% | 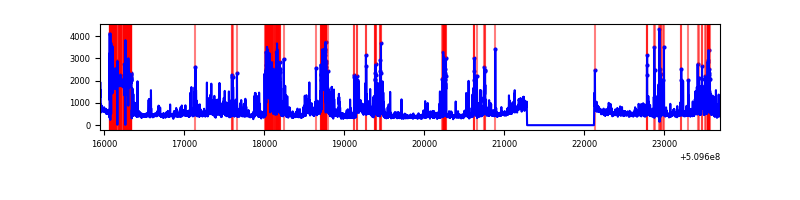 |
Top three noisy pixels from each quadrant. If the there are fewer than three noisy pixels in the level2.evt file, extra rows are filled as -1
| Pixel properties | Quadrant properties | ||||||
|---|---|---|---|---|---|---|---|
| Quadrant | DetID | PixID | Counts | Sigma | Mean | Median | Sigma |
| A | 11 | 31 | 5394209 | 33509.15 | 646 | 629 | 161.0 |
| A | 4 | 95 | 1592650 | 9890.88 | 646 | 629 | 161.0 |
| A | 4 | 249 | 713162 | 4426.81 | 646 | 629 | 161.0 |
| B | 5 | 172 | 2720689 | 18703.09 | 684 | 659 | 145.4 |
| B | 5 | 185 | 1058518 | 7273.9 | 684 | 659 | 145.4 |
| B | 1 | 255 | 606236 | 4163.98 | 684 | 659 | 145.4 |
| C | 12 | 252 | 356465 | 1749.4 | 744 | 736 | 203.3 |
| C | 6 | 223 | 38990 | 188.13 | 744 | 736 | 203.3 |
| C | 15 | 209 | 27116 | 129.73 | 744 | 736 | 203.3 |
| D | 2 | 62 | 562410 | 2799.62 | 708 | 677 | 200.6 |
| D | 2 | 249 | 445662 | 2217.76 | 708 | 677 | 200.6 |
| D | 6 | 239 | 393224 | 1956.41 | 708 | 677 | 200.6 |
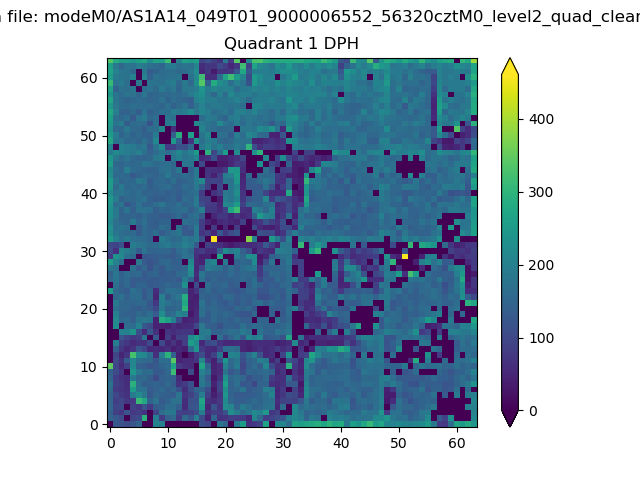
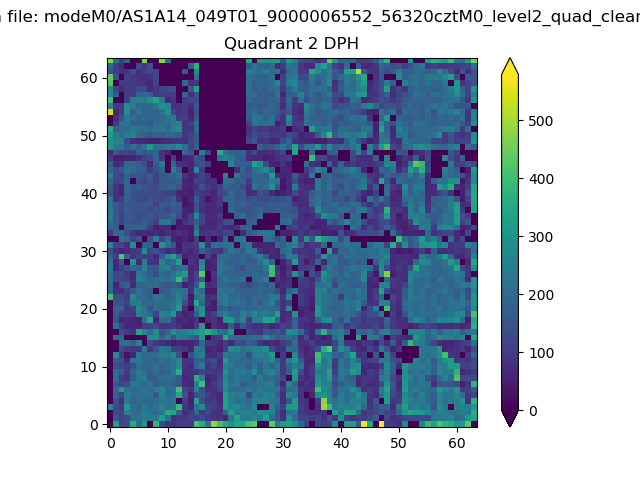
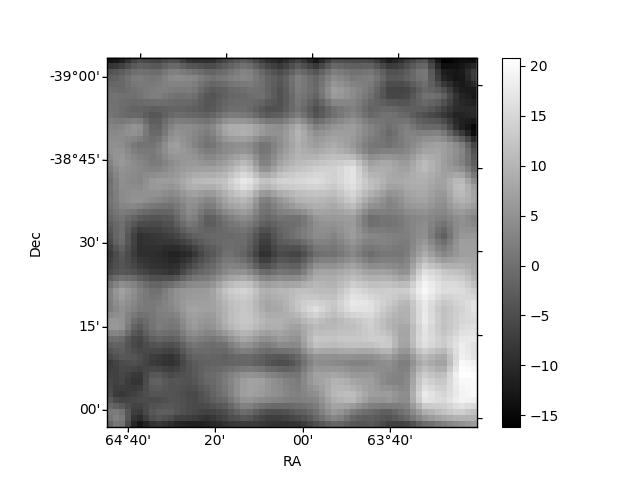
Histogram calculated using DETX and DETY for each event in the final _common_clean file
| Quadrant A |  |
 |
Quadrant B |
|---|---|---|---|
| Quadrant D |  |
 |
Quadrant C |
| Plot type | Count rate plots | Images |
|---|---|---|
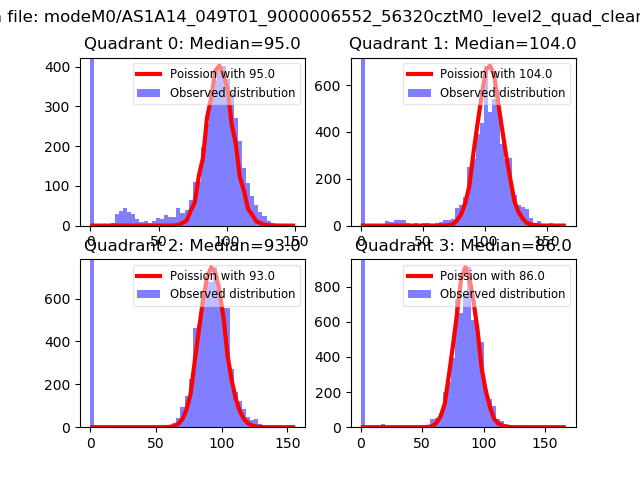
| Comparison with Poisson distribution Blue bars denote a histogram of data divided into 1 sec bins. Red curve is a Poisson curve with rate = median count rate of data. |
 |
 |
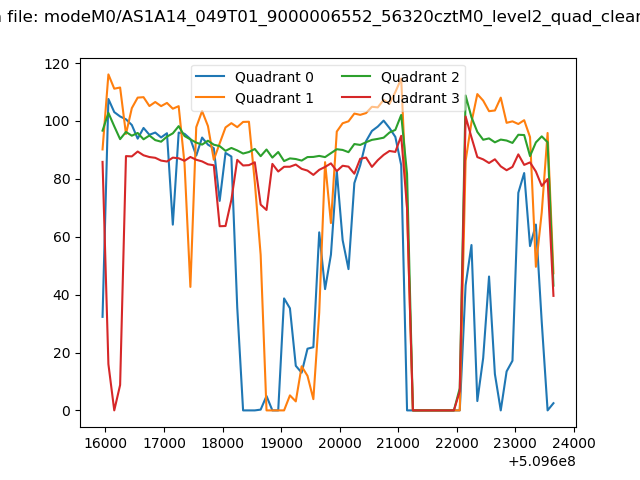
| Quadrant-wise count rates Data is divided into 100 sec bins |
 |
|
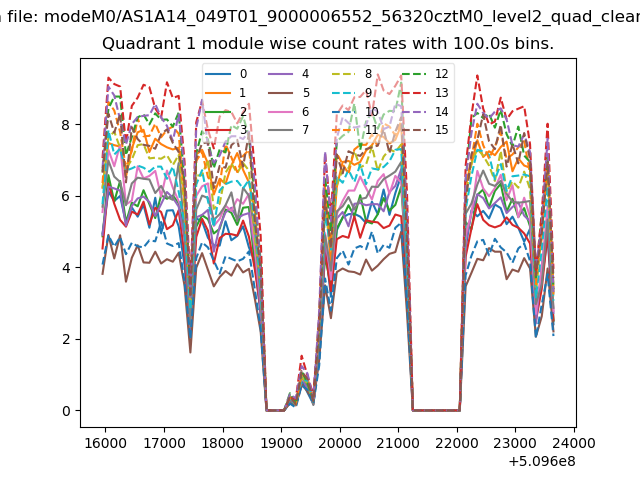
| Module-wise count rates for Quadrant A Data is divided into 100 sec bins |
 |
 |
| Module-wise count rates for Quadrant B Data is divided into 100 sec bins |
 |
 |
| Module-wise count rates for Quadrant C Data is divided into 100 sec bins |
 |
 |
| Module-wise count rates for Quadrant D Data is divided into 100 sec bins |
 |
 |
| Parameter | Plot |
|---|---|
| CZT HV Monitor | 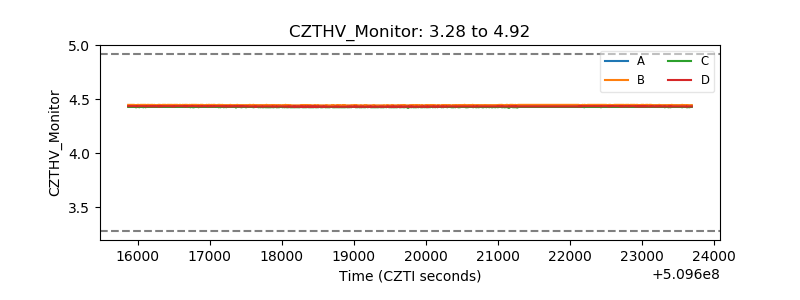 |
| D_VDD |  |
| Temperature 1 | 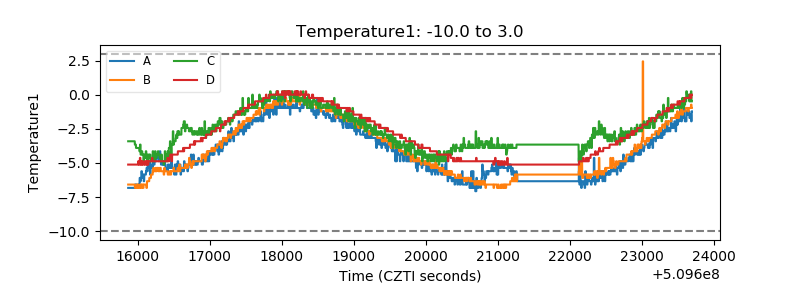 |
| Veto HV Monitor |  |
| Veto LLD | 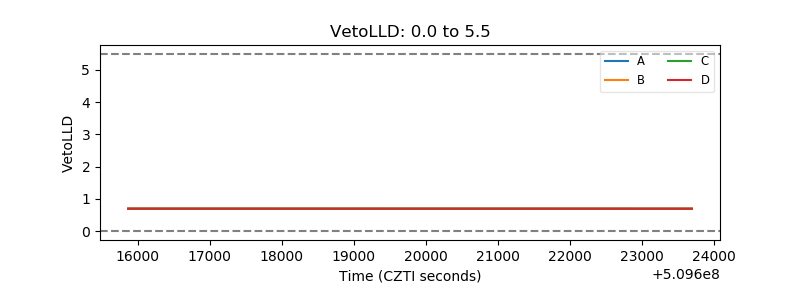 |
| Alpha Counter |  |
| _CPM_Rate | 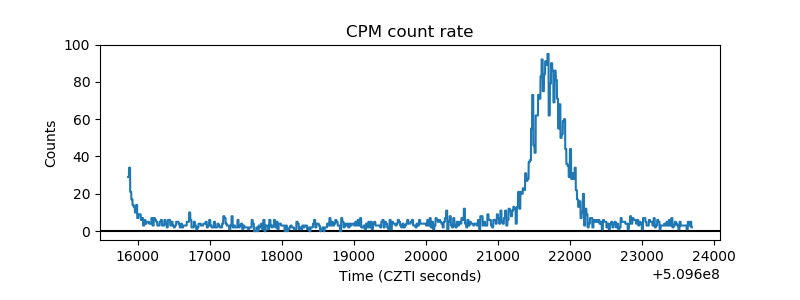 |
| CZT Counter | 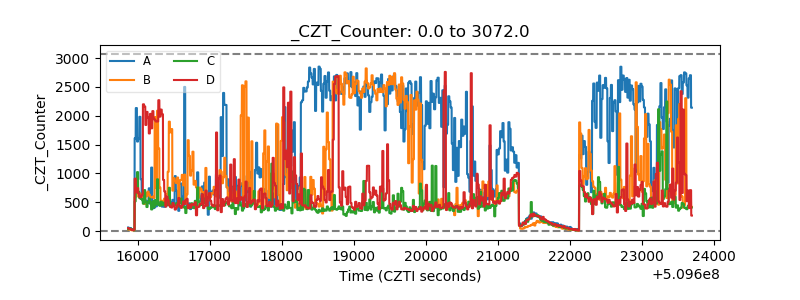 |
| +2.5 Volts monitor | 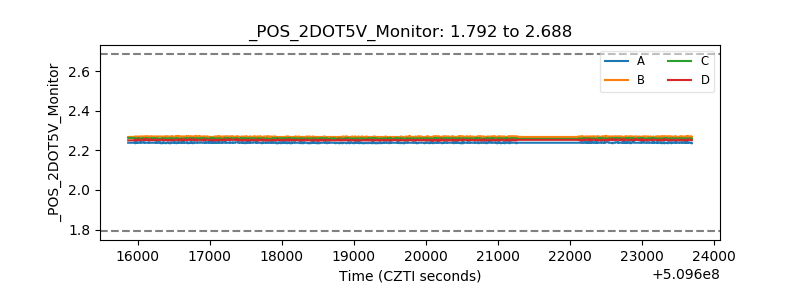 |
| +5 Volts monitor |  |
| _ROLL_ROT |  |
| _Roll_DEC |  |
| _Roll_RA | 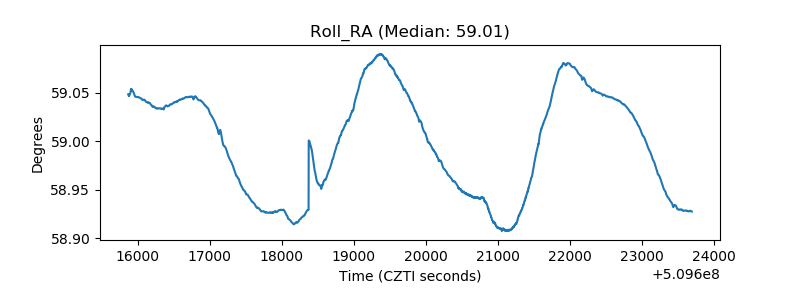 |
| Veto Counter |  |