| Param | Original file | Final file |
|---|---|---|
| Filename | modeM0/AS1A14_049T01_9000006552_56322cztM0_level2.fits | modeM0/AS1A14_049T01_9000006552_56322cztM0_level2_quad_clean.evt |
| Size (bytes) | 2,828,168,640 | 285,252,480 |
| Size | 2.6 GB | 272.0 MB |
| Events in quadrant A | 46,174,266 | 1,100,303 |
| Events in quadrant B | 17,447,669 | 2,340,766 |
| Events in quadrant C | 15,276,665 | 2,164,884 |
| Events in quadrant D | 23,911,581 | 1,355,375 |
| Mode SS | |||
|---|---|---|---|
| Quadrant | BADHDUFLAG | Total packets | Discarded packets |
| A | 0 | 494 | 0 |
| B | 0 | 494 | 0 |
| C | 0 | 494 | 0 |
| D | 0 | 494 | 0 |
| Mode M9 | |||
|---|---|---|---|
| Quadrant | BADHDUFLAG | Total packets | Discarded packets |
| A | 0 | 26 | 0 |
| B | 0 | 27 | 0 |
| C | 0 | 27 | 0 |
| D | 0 | 27 | 0 |
| Mode M0 | |||
|---|---|---|---|
| Quadrant | BADHDUFLAG | Total packets | Discarded packets |
| A | 0 | 153879 | 4 |
| B | 0 | 68970 | 4 |
| C | 0 | 62904 | 4 |
| D | 0 | 87953 | 4 |
| Quadrant | Total seconds | Saturated seconds | Saturation percentage |
|---|---|---|---|
| A | 24332 | 13753 | 56.522275% |
| B | 24332 | 2284 | 9.386816% |
| C | 24332 | 1319 | 5.420845% |
| D | 24332 | 8764 | 36.018412% |
Noise dominated data is calculated using 1-second bins in cleaned event files. If a bin has >2000 counts, and if more than 50% of those come from <1% of pixels, then it is considered to be noise-dominated and hence unusable.
| Quadrant | # 1 sec bins | Bins with >0 counts | Bins with >2000 counts | High rate bins dominated by noise | Noise dominated (total time) | Noise dominated (detector-on time) | Marked lightcurve |
|---|---|---|---|---|---|---|---|
| A | 26667 | 24336 | 12357 | 12357 | 46.34% | 50.78% |  |
| B | 26667 | 24336 | 1329 | 1329 | 4.98% | 5.46% |  |
| C | 26667 | 24336 | 730 | 730 | 2.74% | 3.00% | 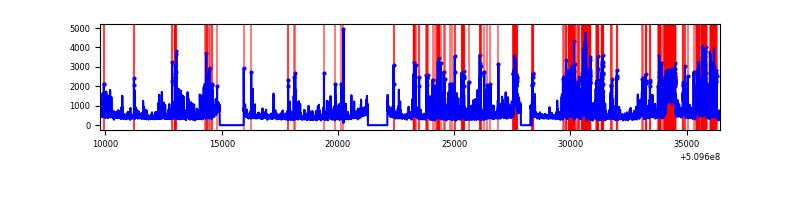 |
| D | 26666 | 24334 | 3397 | 3397 | 12.74% | 13.96% |  |
Top three noisy pixels from each quadrant. If the there are fewer than three noisy pixels in the level2.evt file, extra rows are filled as -1
| Pixel properties | Quadrant properties | ||||||
|---|---|---|---|---|---|---|---|
| Quadrant | DetID | PixID | Counts | Sigma | Mean | Median | Sigma |
| A | 11 | 31 | 26304281 | 49446.22 | 2143 | 2088 | 531.9 |
| A | 4 | 95 | 4821492 | 9060.13 | 2143 | 2088 | 531.9 |
| A | 4 | 249 | 1629820 | 3060.02 | 2143 | 2088 | 531.9 |
| B | 5 | 172 | 2808685 | 5238.21 | 2546 | 2451 | 535.7 |
| B | 5 | 185 | 1801944 | 3358.99 | 2546 | 2451 | 535.7 |
| B | 0 | 231 | 832879 | 1550.1 | 2546 | 2451 | 535.7 |
| C | 12 | 252 | 2256611 | 3275.93 | 2536 | 2509 | 688.1 |
| C | 15 | 198 | 1877773 | 2725.36 | 2536 | 2509 | 688.1 |
| C | 15 | 244 | 180830 | 259.16 | 2536 | 2509 | 688.1 |
| D | 8 | 129 | 12554867 | 23992.0 | 1816 | 1731 | 523.2 |
| D | 2 | 249 | 1072183 | 2045.88 | 1816 | 1731 | 523.2 |
| D | 6 | 239 | 873470 | 1666.1 | 1816 | 1731 | 523.2 |
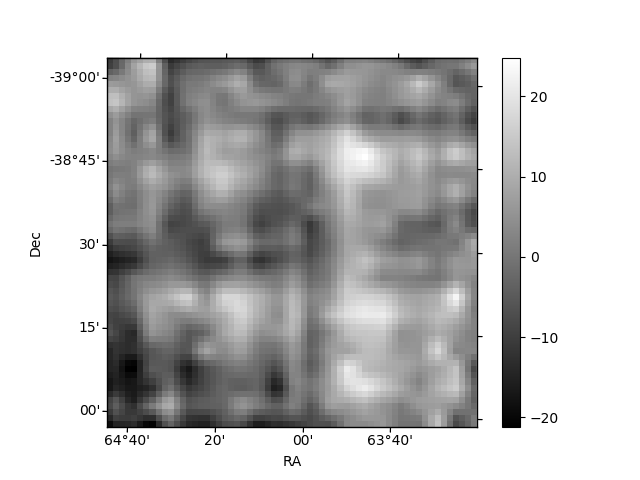
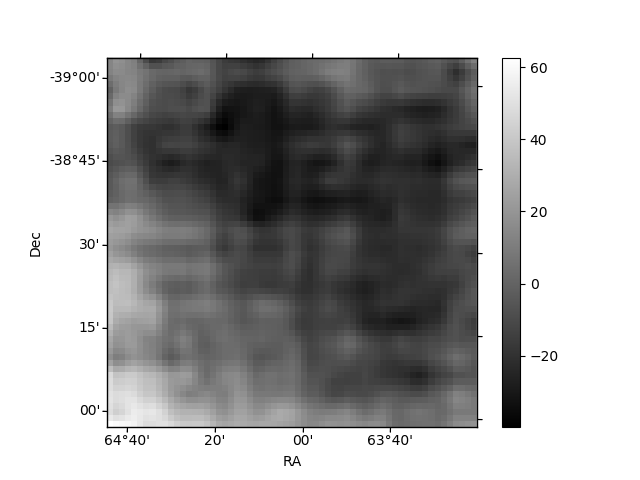
Histogram calculated using DETX and DETY for each event in the final _common_clean file
| Quadrant A | 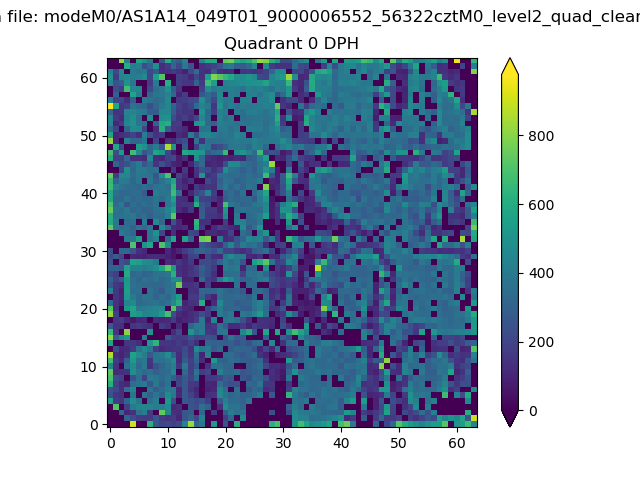 |
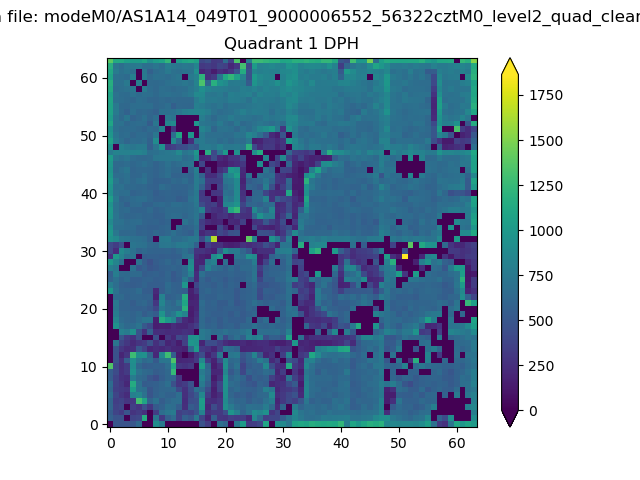 |
Quadrant B |
|---|---|---|---|
| Quadrant D |  |
 |
Quadrant C |
| Plot type | Count rate plots | Images |
|---|---|---|
| Comparison with Poisson distribution Blue bars denote a histogram of data divided into 1 sec bins. Red curve is a Poisson curve with rate = median count rate of data. |
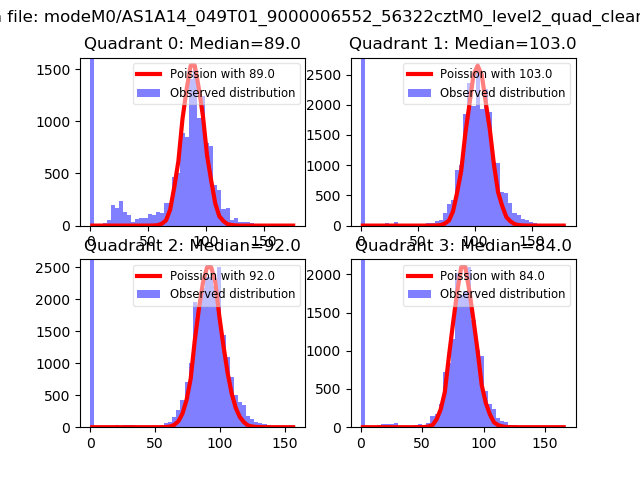 |
 |
| Quadrant-wise count rates Data is divided into 100 sec bins |
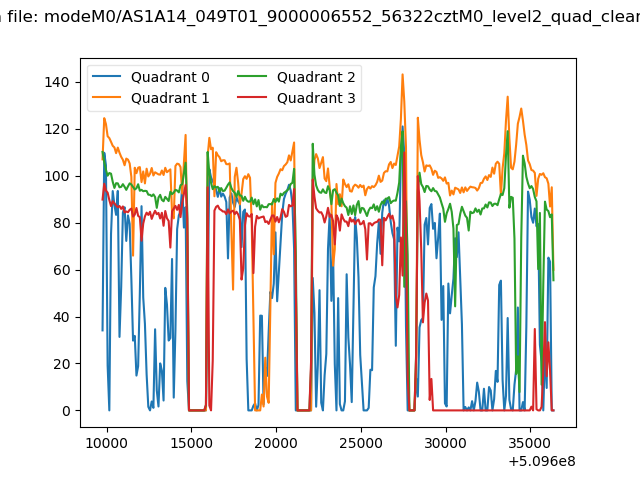 |
|
| Module-wise count rates for Quadrant A Data is divided into 100 sec bins |
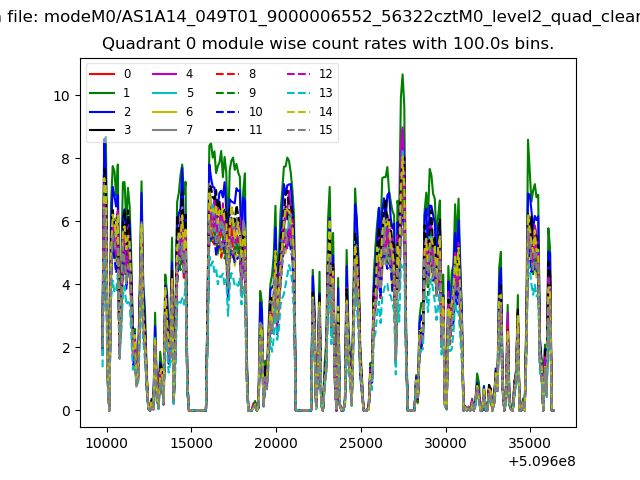 |
 |
| Module-wise count rates for Quadrant B Data is divided into 100 sec bins |
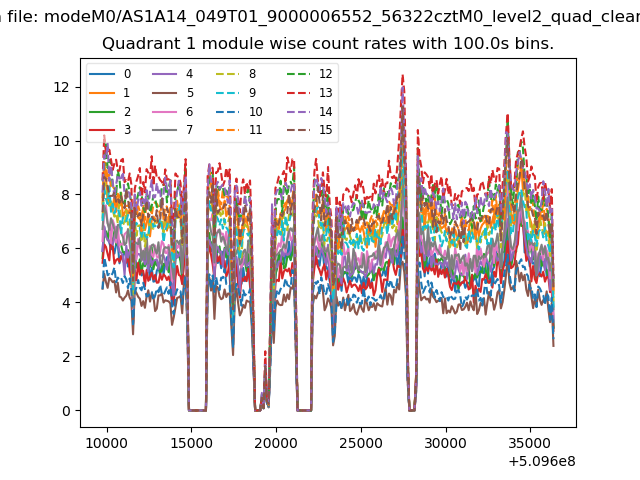 |
 |
| Module-wise count rates for Quadrant C Data is divided into 100 sec bins |
 |
 |
| Module-wise count rates for Quadrant D Data is divided into 100 sec bins |
 |
 |
| Parameter | Plot |
|---|---|
| CZT HV Monitor |  |
| D_VDD |  |
| Temperature 1 | 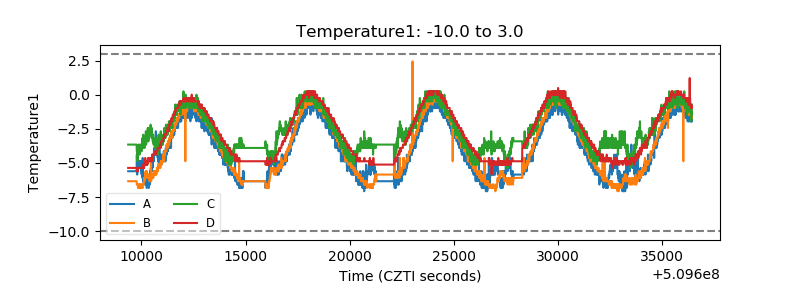 |
| Veto HV Monitor | 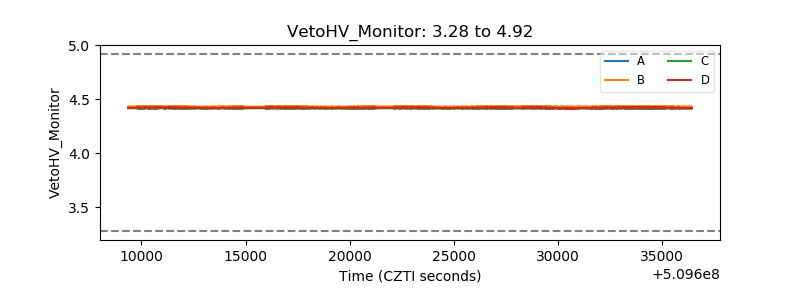 |
| Veto LLD | 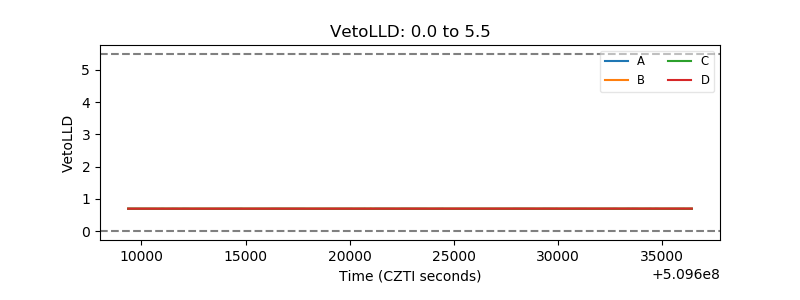 |
| Alpha Counter |  |
| _CPM_Rate | 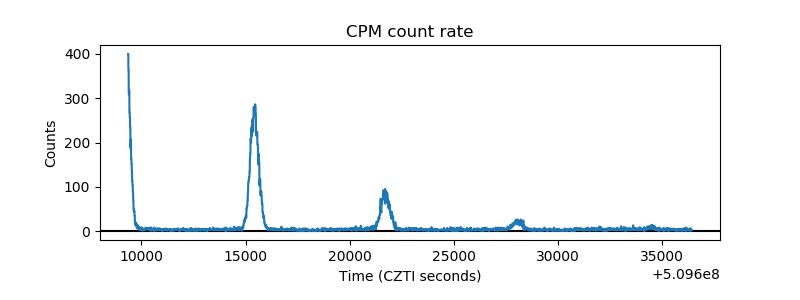 |
| CZT Counter |  |
| +2.5 Volts monitor |  |
| +5 Volts monitor |  |
| _ROLL_ROT | 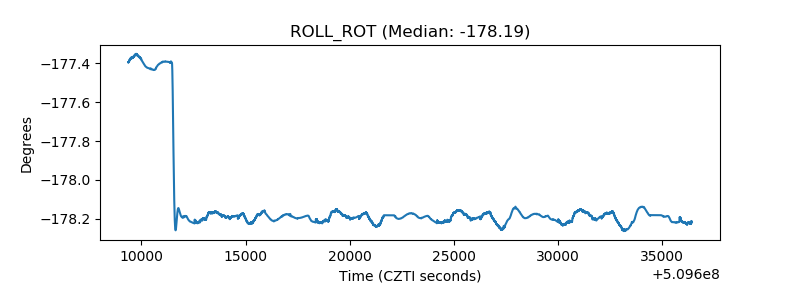 |
| _Roll_DEC | 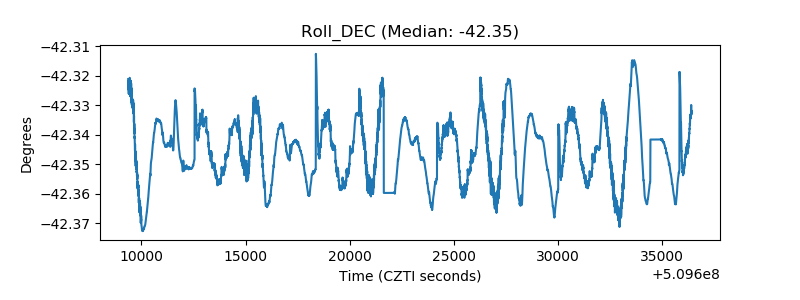 |
| _Roll_RA |  |
| Veto Counter | 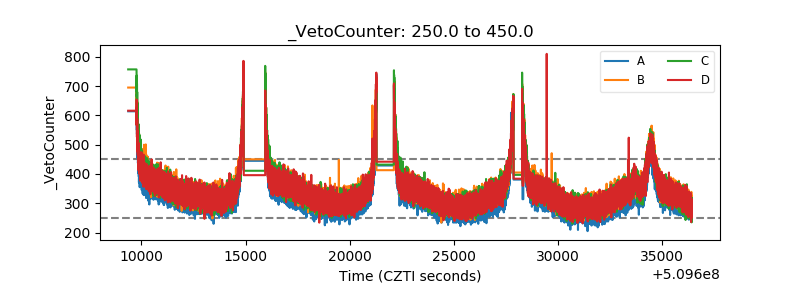 |