| Param | Original file | Final file |
|---|---|---|
| Filename | modeM0/AS1A14_049T01_9000006552_56323cztM0_level2.fits | modeM0/AS1A14_049T01_9000006552_56323cztM0_level2_quad_clean.evt |
| Size (bytes) | 983,995,200 | 76,158,720 |
| Size | 938.4 MB | 72.6 MB |
| Events in quadrant A | 9,032,150 | 536,145 |
| Events in quadrant B | 4,965,124 | 697,412 |
| Events in quadrant C | 7,592,252 | 536,638 |
| Events in quadrant D | 14,264,011 | 23,537 |
| Mode SS | |||
|---|---|---|---|
| Quadrant | BADHDUFLAG | Total packets | Discarded packets |
| A | 0 | 148 | 0 |
| B | 0 | 148 | 0 |
| C | 0 | 148 | 0 |
| D | 0 | 148 | 0 |
| Mode M0 | |||
|---|---|---|---|
| Quadrant | BADHDUFLAG | Total packets | Discarded packets |
| A | 0 | 31897 | 2 |
| B | 0 | 19932 | 0 |
| C | 0 | 27911 | 0 |
| D | 0 | 47493 | 0 |
| Quadrant | Total seconds | Saturated seconds | Saturation percentage |
|---|---|---|---|
| A | 7350 | 1855 | 25.238095% |
| B | 7350 | 542 | 7.374150% |
| C | 7351 | 1521 | 20.691062% |
| D | 7351 | 7135 | 97.061624% |
Noise dominated data is calculated using 1-second bins in cleaned event files. If a bin has >2000 counts, and if more than 50% of those come from <1% of pixels, then it is considered to be noise-dominated and hence unusable.
| Quadrant | # 1 sec bins | Bins with >0 counts | Bins with >2000 counts | High rate bins dominated by noise | Noise dominated (total time) | Noise dominated (detector-on time) | Marked lightcurve |
|---|---|---|---|---|---|---|---|
| A | 7350 | 7350 | 1635 | 1635 | 22.24% | 22.24% |  |
| B | 7350 | 7350 | 334 | 334 | 4.54% | 4.54% |  |
| C | 7351 | 7351 | 1205 | 1205 | 16.39% | 16.39% | 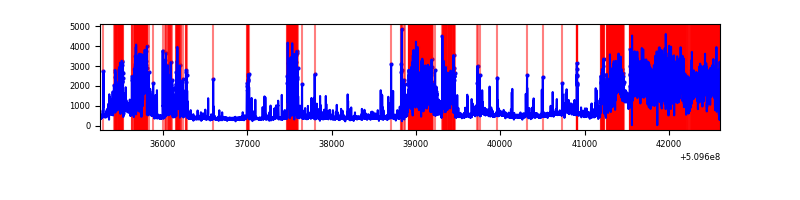 |
| D | 7350 | 7350 | 4175 | 4175 | 56.80% | 56.80% |  |
Top three noisy pixels from each quadrant. If the there are fewer than three noisy pixels in the level2.evt file, extra rows are filled as -1
| Pixel properties | Quadrant properties | ||||||
|---|---|---|---|---|---|---|---|
| Quadrant | DetID | PixID | Counts | Sigma | Mean | Median | Sigma |
| A | 11 | 31 | 3039329 | 17219.99 | 703 | 686 | 176.5 |
| A | 7 | 64 | 723697 | 4097.3 | 703 | 686 | 176.5 |
| A | 0 | 8 | 707481 | 4005.41 | 703 | 686 | 176.5 |
| B | 5 | 172 | 736873 | 4565.18 | 750 | 722 | 161.3 |
| B | 0 | 231 | 533514 | 3304.07 | 750 | 722 | 161.3 |
| B | 5 | 185 | 352673 | 2182.6 | 750 | 722 | 161.3 |
| C | 15 | 198 | 3105025 | 16366.63 | 688 | 683 | 189.7 |
| C | 15 | 148 | 636917 | 3354.34 | 688 | 683 | 189.7 |
| C | 12 | 252 | 441089 | 2321.9 | 688 | 683 | 189.7 |
| D | 8 | 129 | 13465404 | 389770.41 | 116 | 110 | 34.5 |
| D | 2 | 249 | 101650 | 2939.21 | 116 | 110 | 34.5 |
| D | 6 | 239 | 67133 | 1940.07 | 116 | 110 | 34.5 |
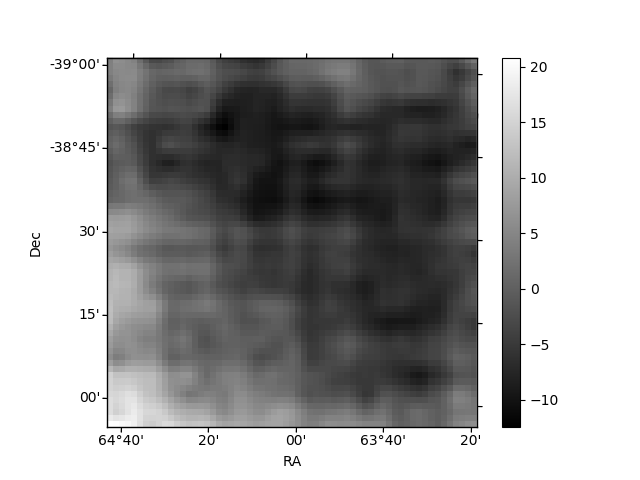
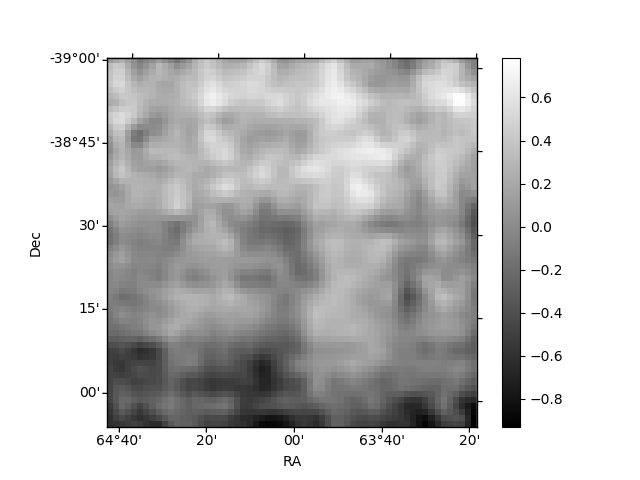
Histogram calculated using DETX and DETY for each event in the final _common_clean file
| Quadrant A | 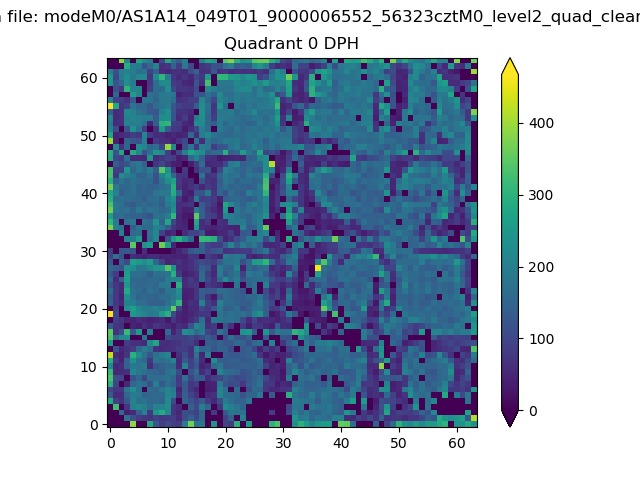 |
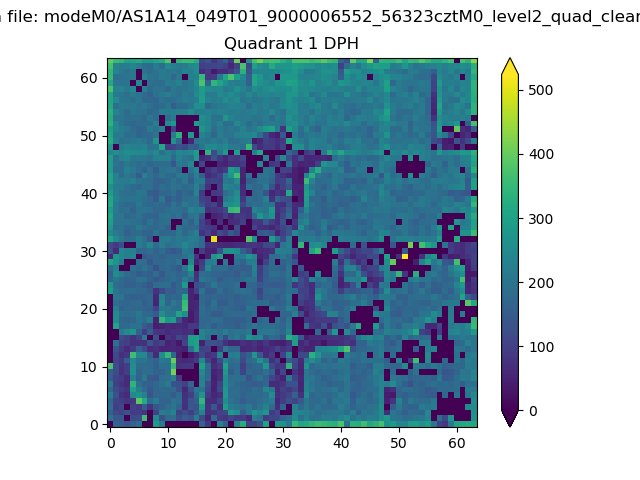 |
Quadrant B |
|---|---|---|---|
| Quadrant D |  |
 |
Quadrant C |
| Plot type | Count rate plots | Images |
|---|---|---|
| Comparison with Poisson distribution Blue bars denote a histogram of data divided into 1 sec bins. Red curve is a Poisson curve with rate = median count rate of data. |
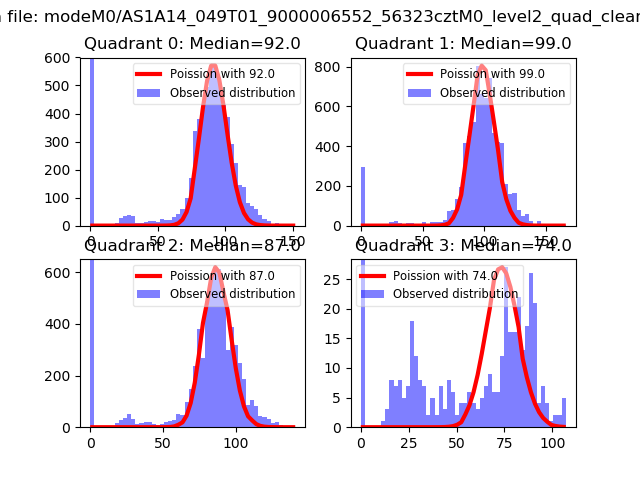 |
 |
| Quadrant-wise count rates Data is divided into 100 sec bins |
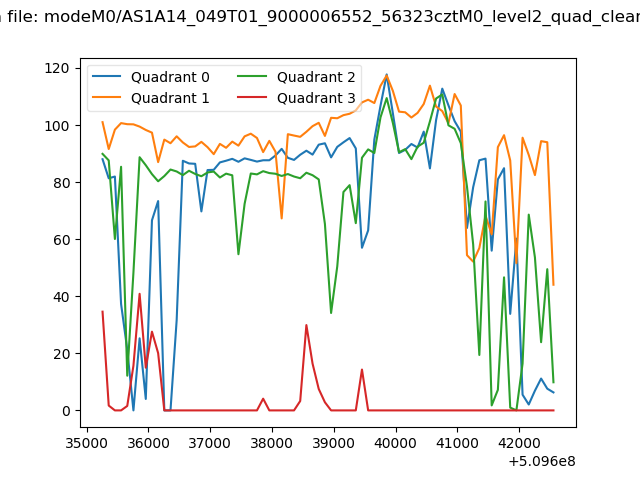 |
|
| Module-wise count rates for Quadrant A Data is divided into 100 sec bins |
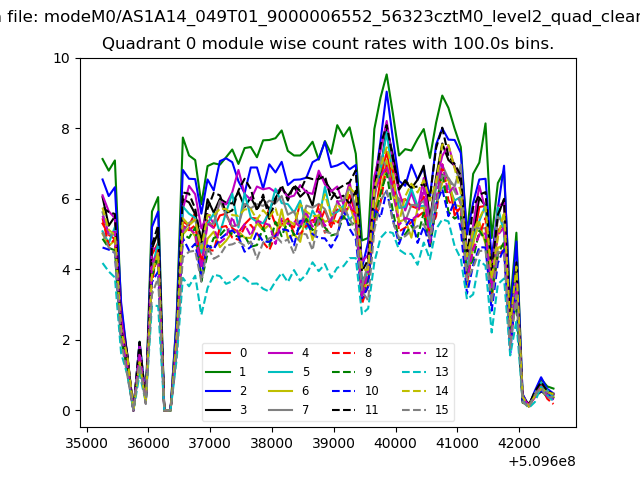 |
 |
| Module-wise count rates for Quadrant B Data is divided into 100 sec bins |
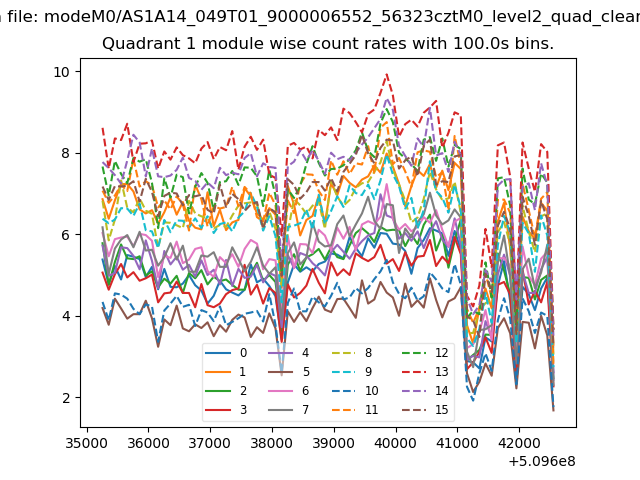 |
 |
| Module-wise count rates for Quadrant C Data is divided into 100 sec bins |
 |
 |
| Module-wise count rates for Quadrant D Data is divided into 100 sec bins |
 |
 |
| Parameter | Plot |
|---|---|
| CZT HV Monitor | 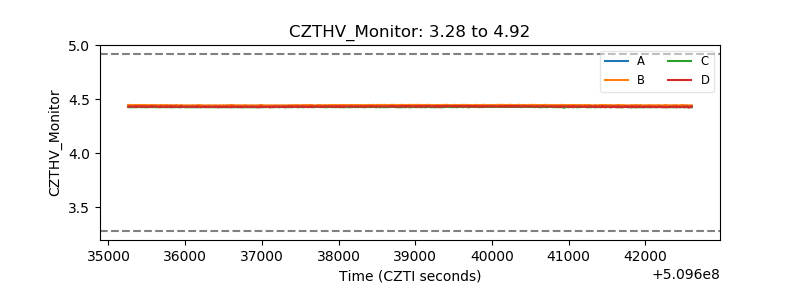 |
| D_VDD |  |
| Temperature 1 |  |
| Veto HV Monitor | 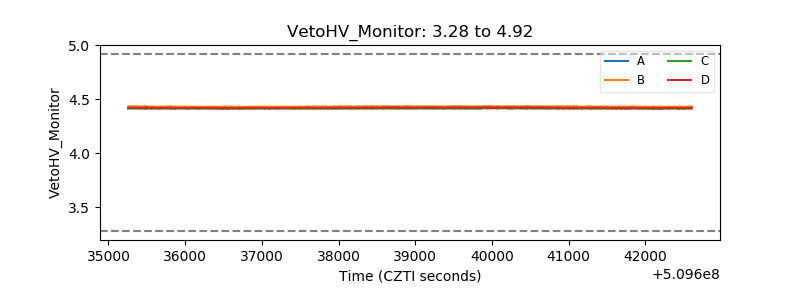 |
| Veto LLD | 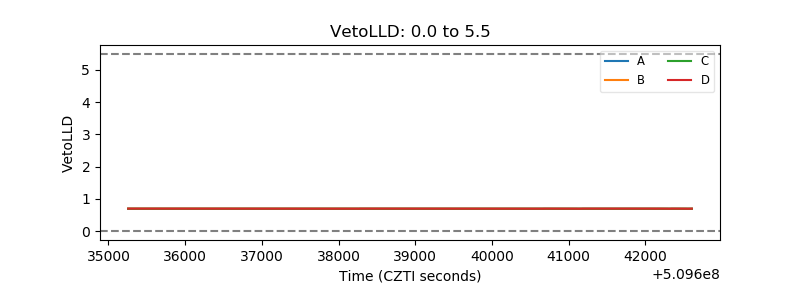 |
| Alpha Counter |  |
| _CPM_Rate | 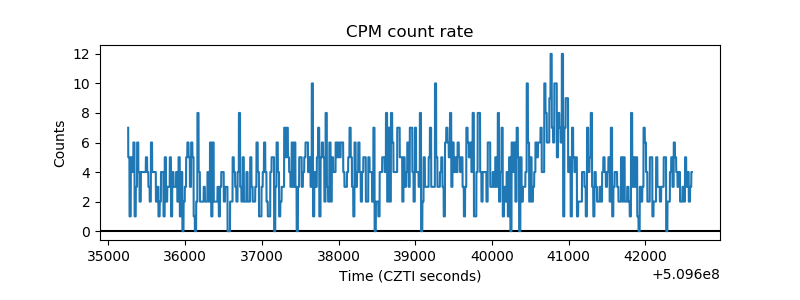 |
| CZT Counter | 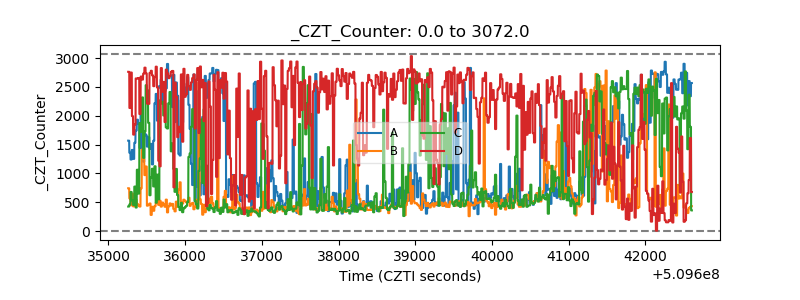 |
| +2.5 Volts monitor |  |
| +5 Volts monitor | 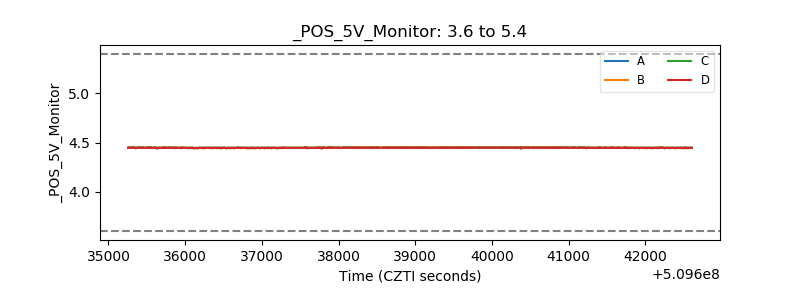 |
| _ROLL_ROT | 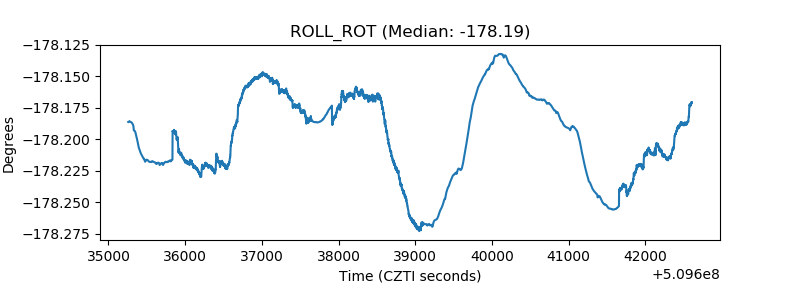 |
| _Roll_DEC | 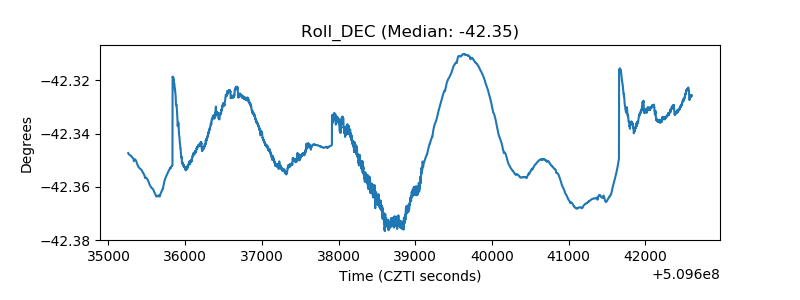 |
| _Roll_RA |  |
| Veto Counter | 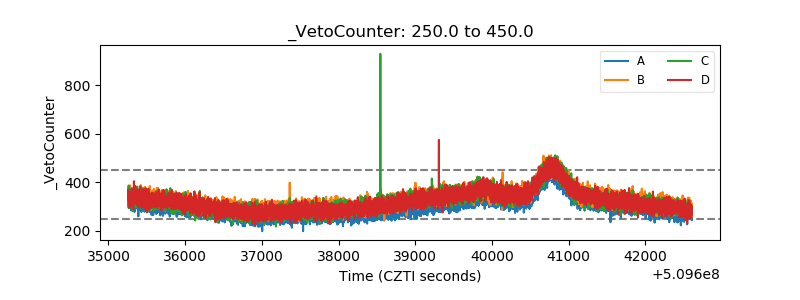 |