| Param | Original file | Final file |
|---|---|---|
| Filename | modeM0/AS1A14_049T01_9000006552_56327cztM0_level2.fits | modeM0/AS1A14_049T01_9000006552_56327cztM0_level2_quad_clean.evt |
| Size (bytes) | 3,292,778,880 | 241,099,200 |
| Size | 3.1 GB | 229.9 MB |
| Events in quadrant A | 33,192,771 | 1,562,053 |
| Events in quadrant B | 21,638,049 | 2,069,892 |
| Events in quadrant C | 20,188,769 | 1,934,650 |
| Events in quadrant D | 44,986,507 | 56,543 |
| Mode SS | |||
|---|---|---|---|
| Quadrant | BADHDUFLAG | Total packets | Discarded packets |
| A | 0 | 494 | 0 |
| B | 0 | 494 | 0 |
| C | 0 | 494 | 0 |
| D | 0 | 494 | 0 |
| Mode M9 | |||
|---|---|---|---|
| Quadrant | BADHDUFLAG | Total packets | Discarded packets |
| A | 0 | 18 | 0 |
| B | 0 | 18 | 0 |
| C | 0 | 18 | 0 |
| D | 0 | 18 | 0 |
| Mode M0 | |||
|---|---|---|---|
| Quadrant | BADHDUFLAG | Total packets | Discarded packets |
| A | 0 | 115504 | 6 |
| B | 0 | 81537 | 3 |
| C | 0 | 77418 | 17 |
| D | 0 | 150528 | 3 |
| Quadrant | Total seconds | Saturated seconds | Saturation percentage |
|---|---|---|---|
| A | 24344 | 7564 | 31.071311% |
| B | 24344 | 4125 | 16.944627% |
| C | 24343 | 2823 | 11.596763% |
| D | 24345 | 23768 | 97.629903% |
Noise dominated data is calculated using 1-second bins in cleaned event files. If a bin has >2000 counts, and if more than 50% of those come from <1% of pixels, then it is considered to be noise-dominated and hence unusable.
| Quadrant | # 1 sec bins | Bins with >0 counts | Bins with >2000 counts | High rate bins dominated by noise | Noise dominated (total time) | Noise dominated (detector-on time) | Marked lightcurve |
|---|---|---|---|---|---|---|---|
| A | 26124 | 24347 | 7152 | 7152 | 27.38% | 29.38% |  |
| B | 26124 | 24347 | 3089 | 3089 | 11.82% | 12.69% |  |
| C | 26125 | 24347 | 2166 | 2166 | 8.29% | 8.90% |  |
| D | 26124 | 24344 | 12669 | 12669 | 48.50% | 52.04% | 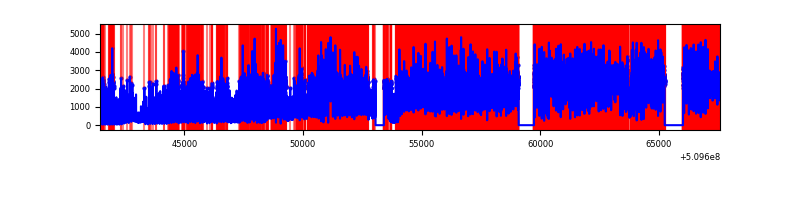 |
Top three noisy pixels from each quadrant. If the there are fewer than three noisy pixels in the level2.evt file, extra rows are filled as -1
| Pixel properties | Quadrant properties | ||||||
|---|---|---|---|---|---|---|---|
| Quadrant | DetID | PixID | Counts | Sigma | Mean | Median | Sigma |
| A | 11 | 31 | 15801837 | 28366.65 | 2229 | 2164 | 557.0 |
| A | 7 | 64 | 2142072 | 3841.98 | 2229 | 2164 | 557.0 |
| A | 0 | 8 | 1883003 | 3376.85 | 2229 | 2164 | 557.0 |
| B | 5 | 172 | 8729536 | 17908.26 | 2311 | 2224 | 487.3 |
| B | 5 | 185 | 1371138 | 2808.98 | 2311 | 2224 | 487.3 |
| B | 0 | 231 | 1182340 | 2421.57 | 2311 | 2224 | 487.3 |
| C | 15 | 198 | 4148063 | 6418.1 | 2351 | 2336 | 645.9 |
| C | 12 | 252 | 2179296 | 3370.2 | 2351 | 2336 | 645.9 |
| C | 15 | 148 | 1730958 | 2676.12 | 2351 | 2336 | 645.9 |
| D | 8 | 129 | 40941536 | 381138.74 | 357 | 341 | 107.4 |
| D | 12 | 3 | 1247368 | 11609.1 | 357 | 341 | 107.4 |
| D | 2 | 249 | 579576 | 5392.34 | 357 | 341 | 107.4 |
Histogram calculated using DETX and DETY for each event in the final _common_clean file
| Quadrant A |  |
 |
Quadrant B |
|---|---|---|---|
| Quadrant D | 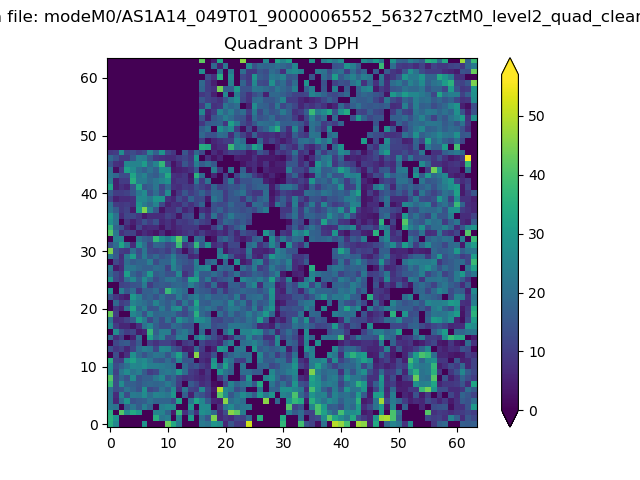 |
 |
Quadrant C |
| Plot type | Count rate plots | Images |
|---|---|---|
| Comparison with Poisson distribution Blue bars denote a histogram of data divided into 1 sec bins. Red curve is a Poisson curve with rate = median count rate of data. |
 |
 |
| Quadrant-wise count rates Data is divided into 100 sec bins |
 |
|
| Module-wise count rates for Quadrant A Data is divided into 100 sec bins |
 |
 |
| Module-wise count rates for Quadrant B Data is divided into 100 sec bins |
 |
 |
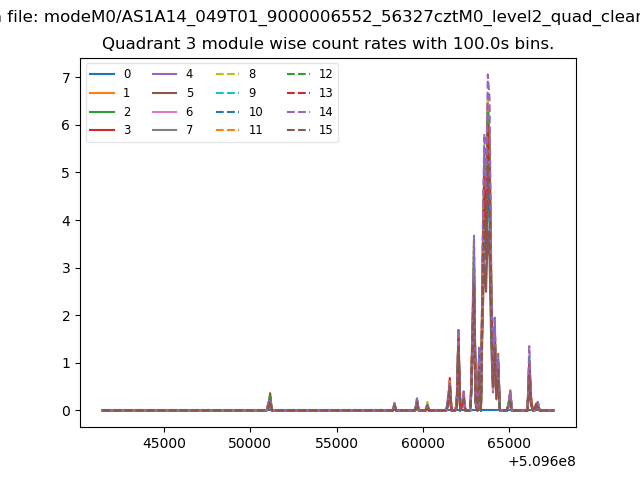
| Module-wise count rates for Quadrant C Data is divided into 100 sec bins |
 |
 |
| Module-wise count rates for Quadrant D Data is divided into 100 sec bins |
 |
 |
| Parameter | Plot |
|---|---|
| CZT HV Monitor | 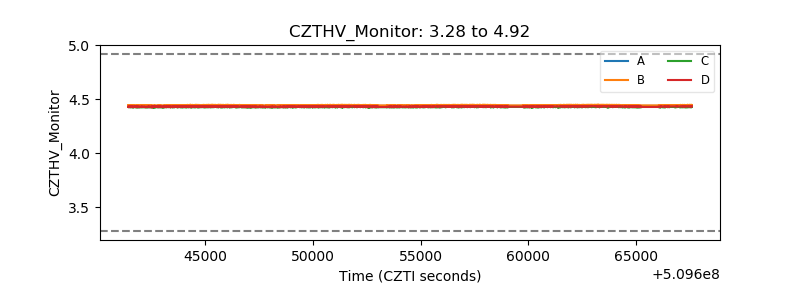 |
| D_VDD |  |
| Temperature 1 | 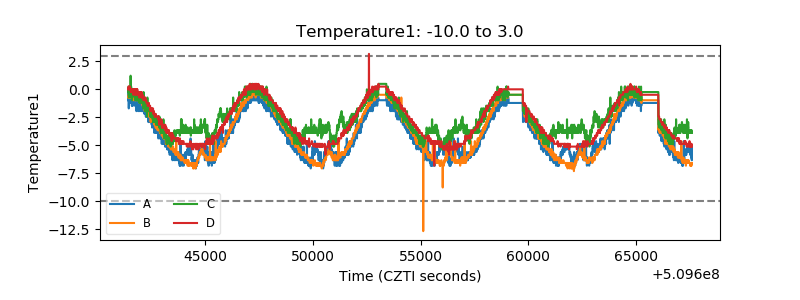 |
| Veto HV Monitor | 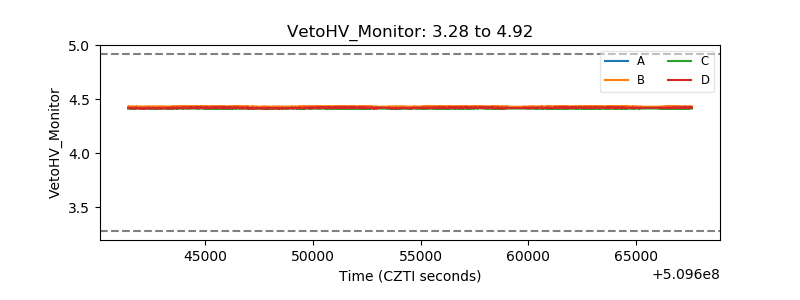 |
| Veto LLD |  |
| Alpha Counter | 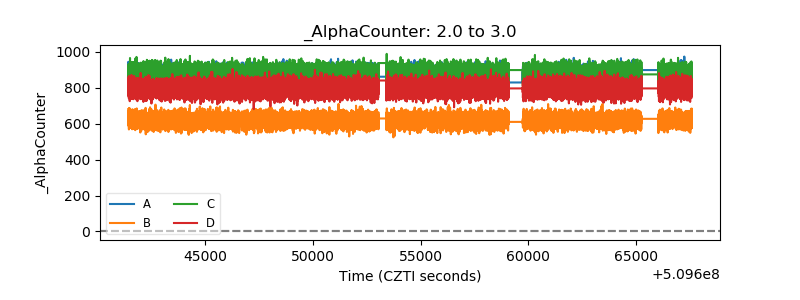 |
| _CPM_Rate |  |
| CZT Counter | 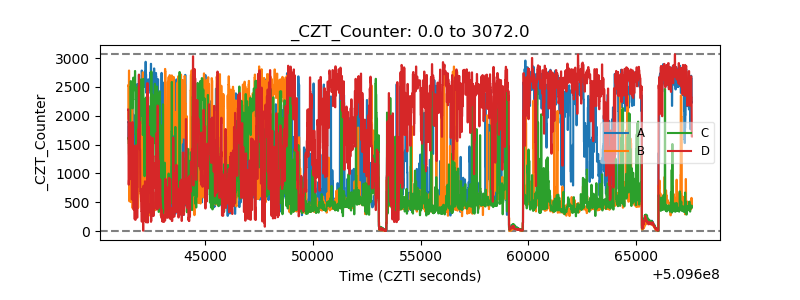 |
| +2.5 Volts monitor | 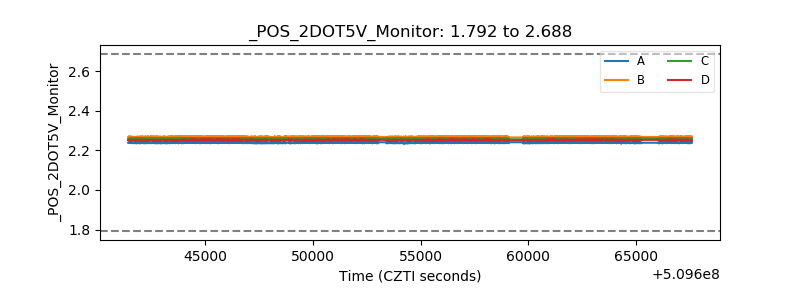 |
| +5 Volts monitor | 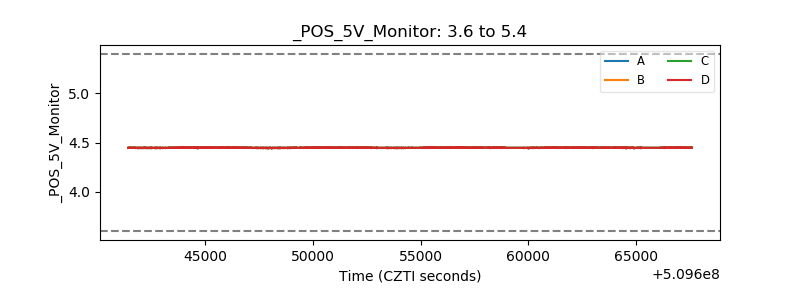 |
| _ROLL_ROT | 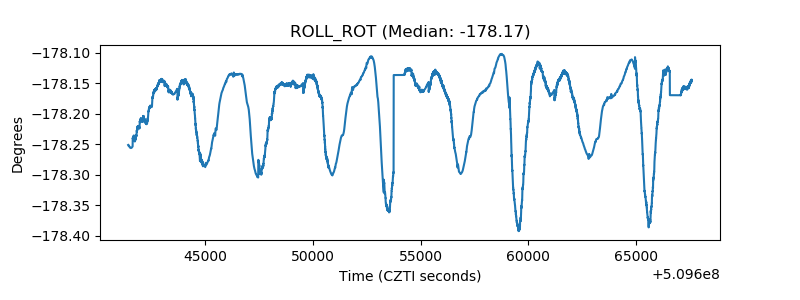 |
| _Roll_DEC | 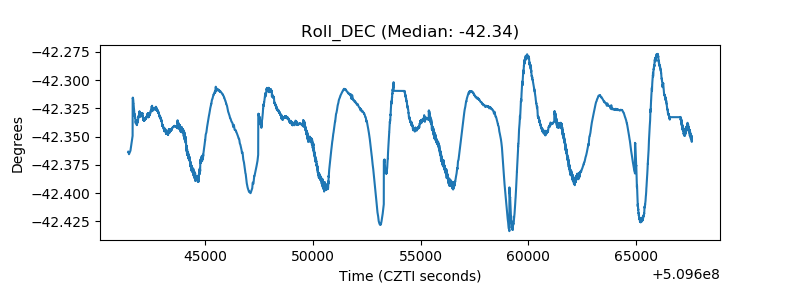 |
| _Roll_RA |  |
| Veto Counter | 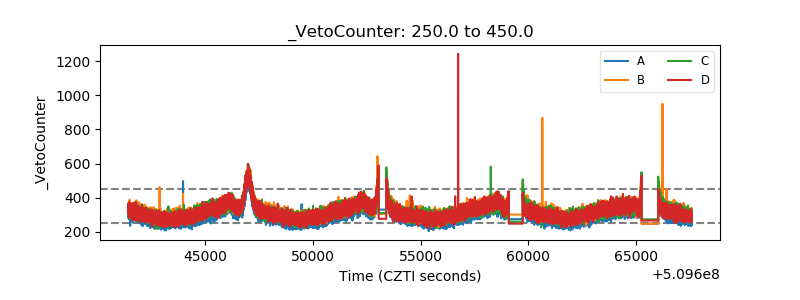 |