| Param | Original file | Final file |
|---|---|---|
| Filename | modeM0/AS1A14_049T01_9000006552_56328cztM0_level2.fits | modeM0/AS1A14_049T01_9000006552_56328cztM0_level2_quad_clean.evt |
| Size (bytes) | 1,093,824,000 | 59,866,560 |
| Size | 1.0 GB | 57.1 MB |
| Events in quadrant A | 16,555,327 | 65,974 |
| Events in quadrant B | 4,404,935 | 662,776 |
| Events in quadrant C | 3,760,242 | 608,177 |
| Events in quadrant D | 15,242,864 | 2,067 |
| Mode SS | |||
|---|---|---|---|
| Quadrant | BADHDUFLAG | Total packets | Discarded packets |
| A | 0 | 136 | 0 |
| B | 0 | 136 | 0 |
| C | 0 | 136 | 0 |
| D | 0 | 136 | 0 |
| Mode M9 | |||
|---|---|---|---|
| Quadrant | BADHDUFLAG | Total packets | Discarded packets |
| A | 0 | 10 | 0 |
| B | 0 | 10 | 0 |
| C | 0 | 10 | 0 |
| D | 0 | 10 | 0 |
| Mode M0 | |||
|---|---|---|---|
| Quadrant | BADHDUFLAG | Total packets | Discarded packets |
| A | 0 | 53856 | 1 |
| B | 0 | 17859 | 1 |
| C | 0 | 16191 | 1 |
| D | 0 | 50031 | 4 |
| Quadrant | Total seconds | Saturated seconds | Saturation percentage |
|---|---|---|---|
| A | 6799 | 6259 | 92.057656% |
| B | 6800 | 319 | 4.691176% |
| C | 6800 | 73 | 1.073529% |
| D | 6799 | 6782 | 99.749963% |
Noise dominated data is calculated using 1-second bins in cleaned event files. If a bin has >2000 counts, and if more than 50% of those come from <1% of pixels, then it is considered to be noise-dominated and hence unusable.
| Quadrant | # 1 sec bins | Bins with >0 counts | Bins with >2000 counts | High rate bins dominated by noise | Noise dominated (total time) | Noise dominated (detector-on time) | Marked lightcurve |
|---|---|---|---|---|---|---|---|
| A | 7729 | 6800 | 6095 | 6095 | 78.86% | 89.63% |  |
| B | 7730 | 6801 | 198 | 198 | 2.56% | 2.91% | 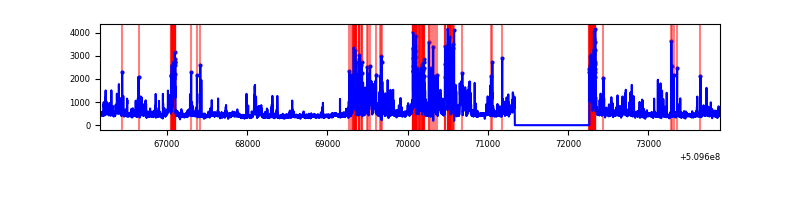 |
| C | 7730 | 6801 | 56 | 56 | 0.72% | 0.82% | 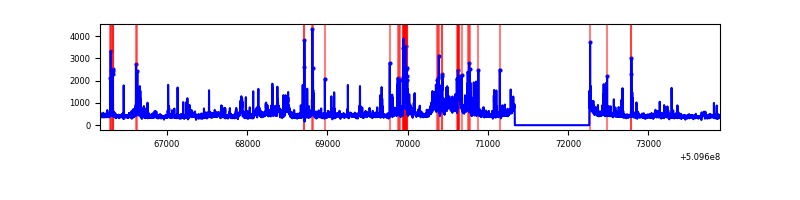 |
| D | 7728 | 6798 | 4750 | 4750 | 61.46% | 69.87% |  |
Top three noisy pixels from each quadrant. If the there are fewer than three noisy pixels in the level2.evt file, extra rows are filled as -1
| Pixel properties | Quadrant properties | ||||||
|---|---|---|---|---|---|---|---|
| Quadrant | DetID | PixID | Counts | Sigma | Mean | Median | Sigma |
| A | 11 | 31 | 11261248 | 100325.15 | 444 | 432 | 112.2 |
| A | 4 | 95 | 2662303 | 23715.21 | 444 | 432 | 112.2 |
| A | 9 | 239 | 180212 | 1601.7 | 444 | 432 | 112.2 |
| B | 0 | 231 | 693679 | 4708.76 | 691 | 667 | 147.2 |
| B | 5 | 185 | 623698 | 4233.27 | 691 | 667 | 147.2 |
| B | 8 | 128 | 75142 | 506.03 | 691 | 667 | 147.2 |
| C | 12 | 252 | 292900 | 1536.12 | 686 | 682 | 190.2 |
| C | 15 | 198 | 238878 | 1252.14 | 686 | 682 | 190.2 |
| C | 15 | 230 | 170102 | 890.6 | 686 | 682 | 190.2 |
| D | 8 | 129 | 13627789 | 413240.57 | 104 | 99 | 33.0 |
| D | 12 | 3 | 789735 | 23944.6 | 104 | 99 | 33.0 |
| D | 2 | 249 | 126642 | 3837.24 | 104 | 99 | 33.0 |
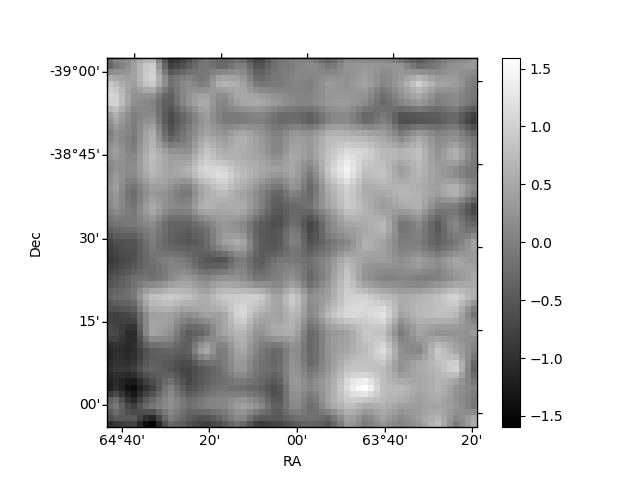
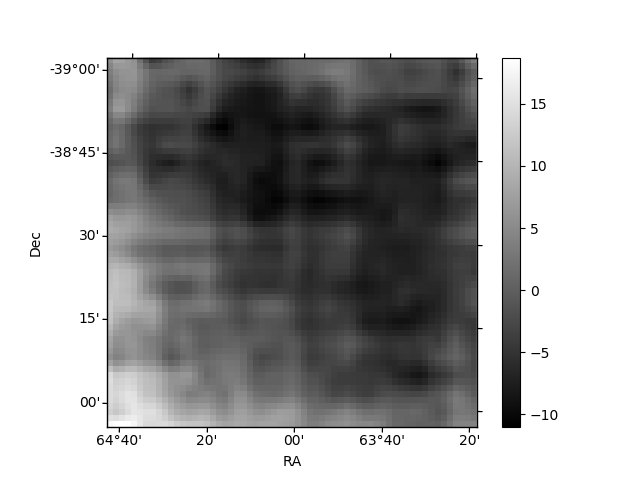
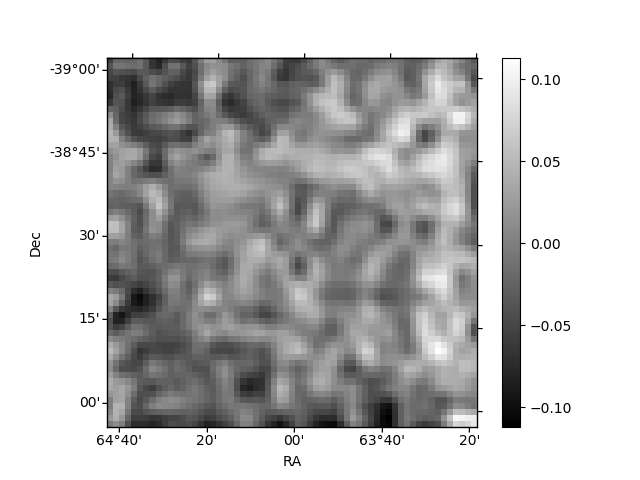
Histogram calculated using DETX and DETY for each event in the final _common_clean file
| Quadrant A | 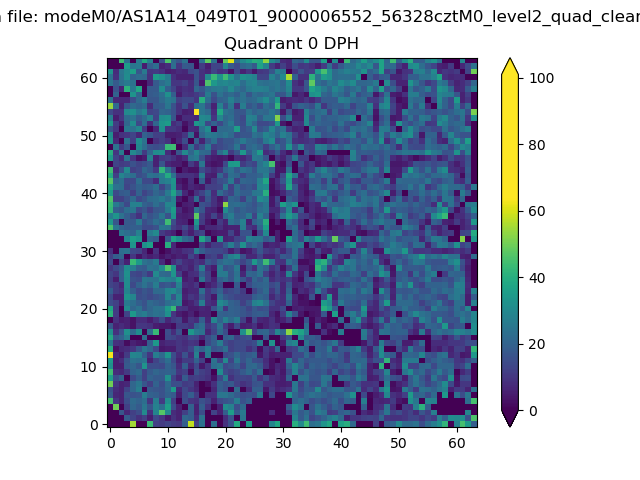 |
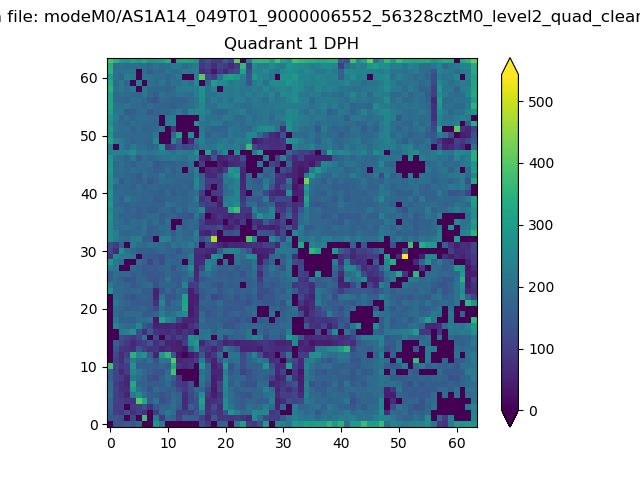 |
Quadrant B |
|---|---|---|---|
| Quadrant D | 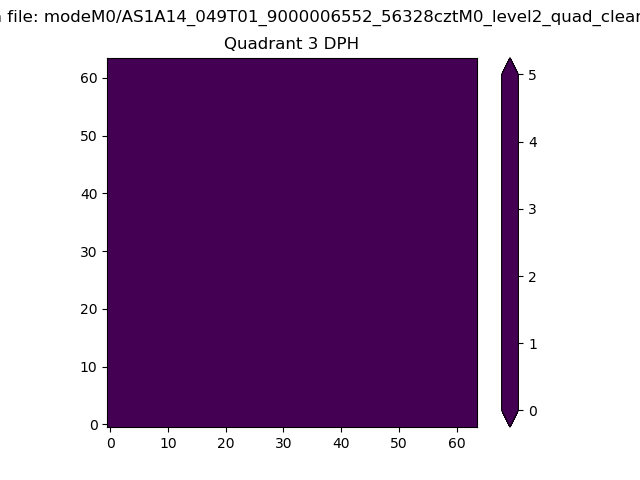 |
 |
Quadrant C |
| Plot type | Count rate plots | Images |
|---|---|---|
| Comparison with Poisson distribution Blue bars denote a histogram of data divided into 1 sec bins. Red curve is a Poisson curve with rate = median count rate of data. |
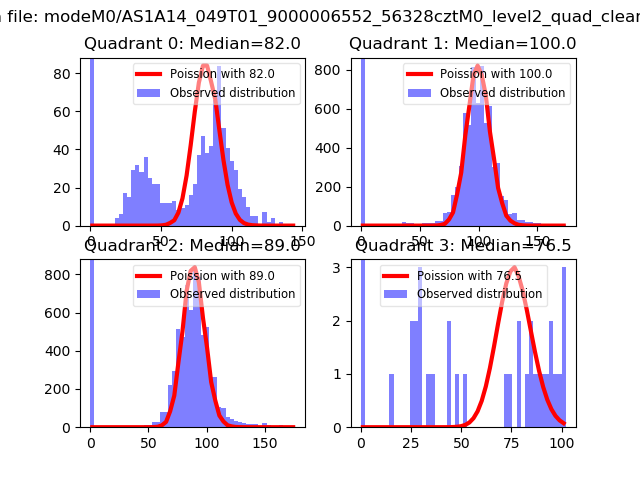 |
 |
| Quadrant-wise count rates Data is divided into 100 sec bins |
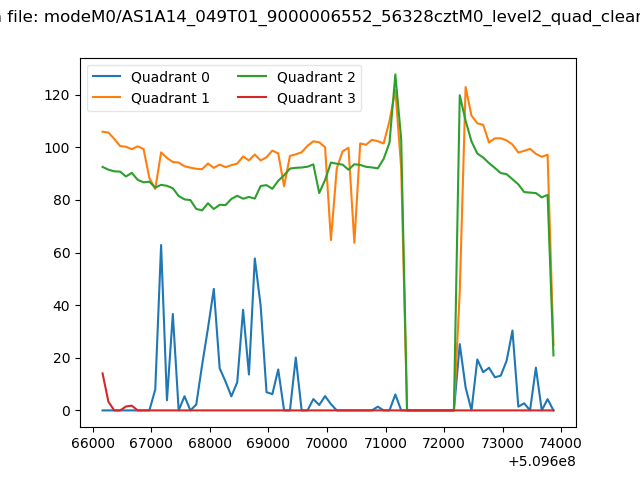 |
|
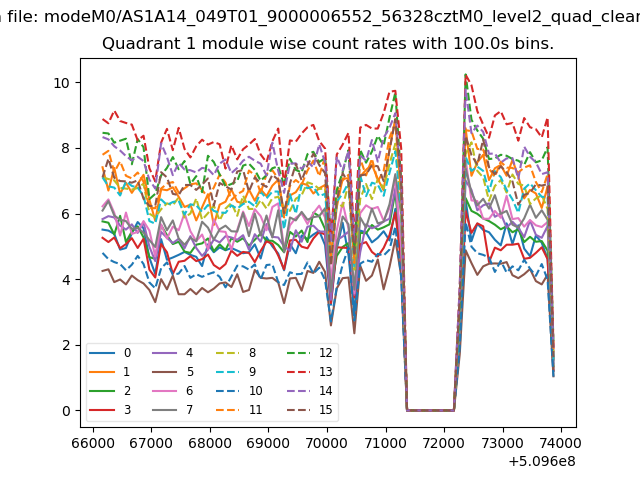
| Module-wise count rates for Quadrant A Data is divided into 100 sec bins |
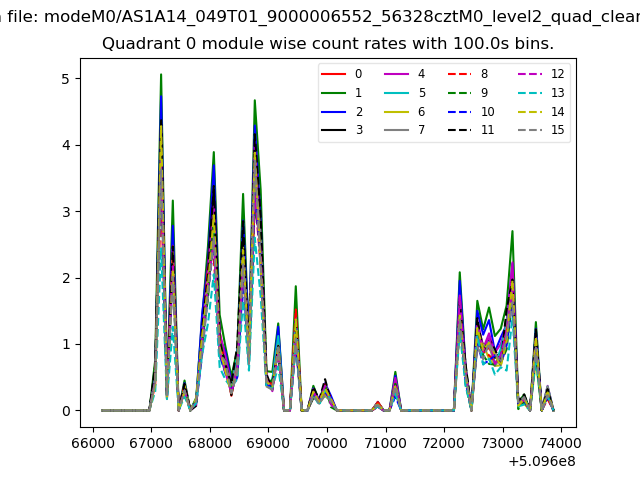 |
 |
| Module-wise count rates for Quadrant B Data is divided into 100 sec bins |
 |
 |
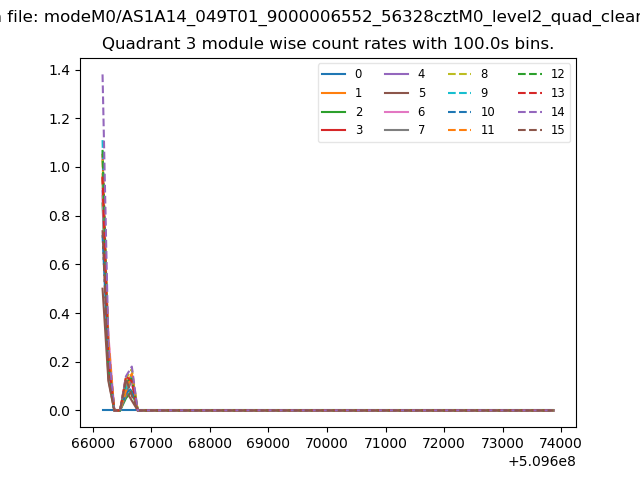
| Module-wise count rates for Quadrant C Data is divided into 100 sec bins |
 |
 |
| Module-wise count rates for Quadrant D Data is divided into 100 sec bins |
 |
 |
| Parameter | Plot |
|---|---|
| CZT HV Monitor |  |
| D_VDD | 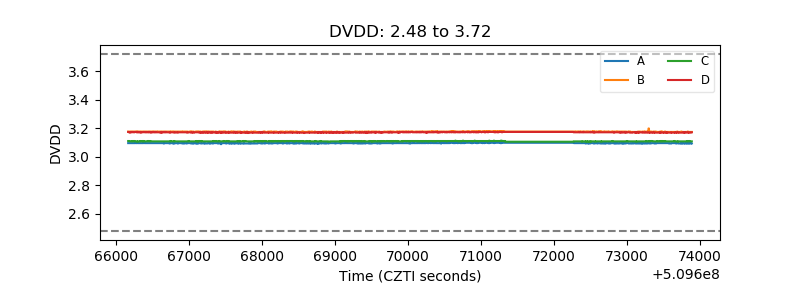 |
| Temperature 1 |  |
| Veto HV Monitor | 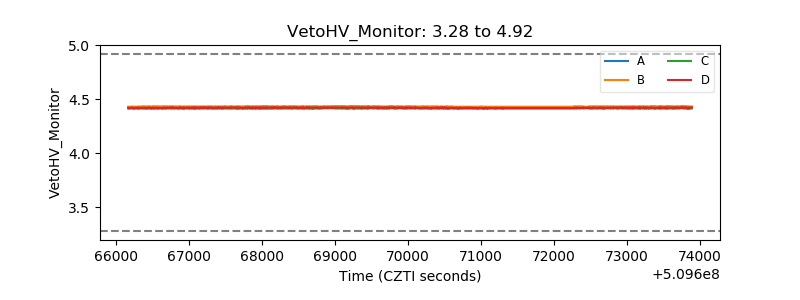 |
| Veto LLD | 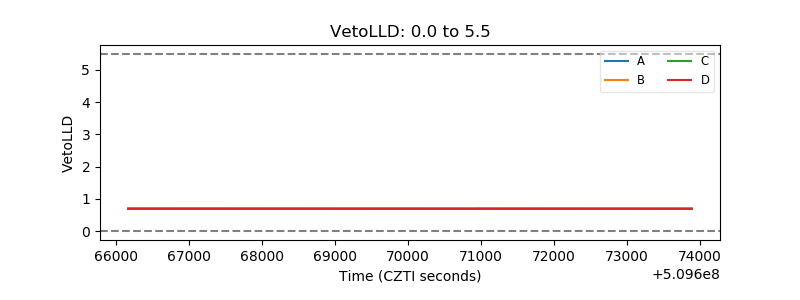 |
| Alpha Counter |  |
| _CPM_Rate | 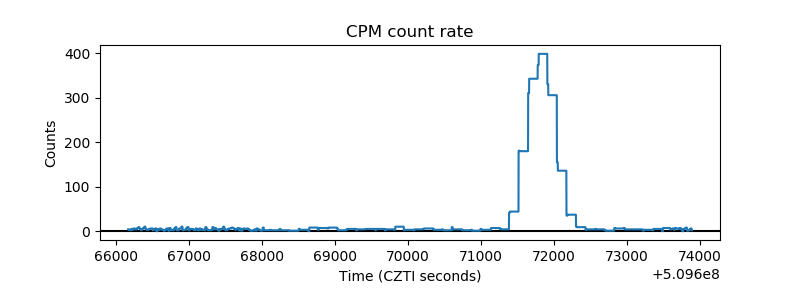 |
| CZT Counter | 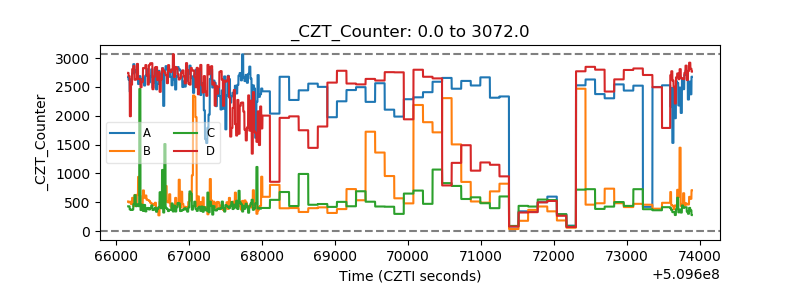 |
| +2.5 Volts monitor |  |
| +5 Volts monitor |  |
| _ROLL_ROT | 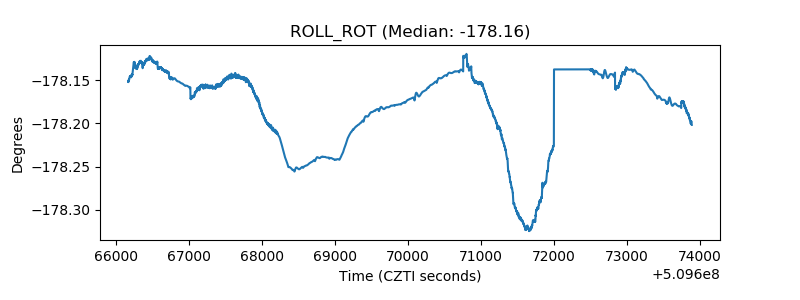 |
| _Roll_DEC | 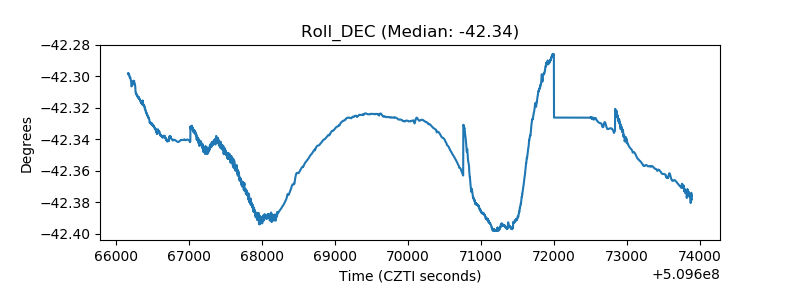 |
| _Roll_RA |  |
| Veto Counter | 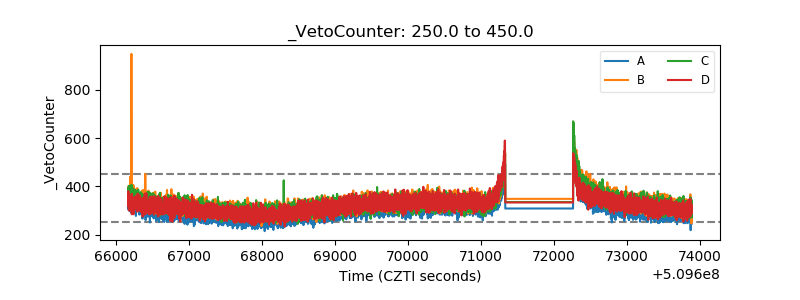 |