| Param | Original file | Final file |
|---|---|---|
| Filename | modeM0/AS1A14_049T01_9000006552_56330cztM0_level2.fits | modeM0/AS1A14_049T01_9000006552_56330cztM0_level2_quad_clean.evt |
| Size (bytes) | 890,844,480 | 71,026,560 |
| Size | 849.6 MB | 67.7 MB |
| Events in quadrant A | 7,942,668 | 456,613 |
| Events in quadrant B | 3,736,852 | 661,995 |
| Events in quadrant C | 3,997,894 | 572,193 |
| Events in quadrant D | 16,787,568 | 111 |
| Mode SS | |||
|---|---|---|---|
| Quadrant | BADHDUFLAG | Total packets | Discarded packets |
| A | 0 | 134 | 0 |
| B | 0 | 134 | 0 |
| C | 0 | 134 | 0 |
| D | 0 | 134 | 0 |
| Mode M9 | |||
|---|---|---|---|
| Quadrant | BADHDUFLAG | Total packets | Discarded packets |
| A | 0 | 10 | 0 |
| B | 0 | 10 | 0 |
| C | 0 | 10 | 0 |
| D | 0 | 10 | 0 |
| Mode M0 | |||
|---|---|---|---|
| Quadrant | BADHDUFLAG | Total packets | Discarded packets |
| A | 0 | 28193 | 1 |
| B | 0 | 15798 | 1 |
| C | 0 | 16706 | 1 |
| D | 0 | 54406 | 1 |
| Quadrant | Total seconds | Saturated seconds | Saturation percentage |
|---|---|---|---|
| A | 6586 | 1900 | 28.849074% |
| B | 6587 | 192 | 2.914832% |
| C | 6587 | 299 | 4.539244% |
| D | 6587 | 6586 | 99.984819% |
Noise dominated data is calculated using 1-second bins in cleaned event files. If a bin has >2000 counts, and if more than 50% of those come from <1% of pixels, then it is considered to be noise-dominated and hence unusable.
| Quadrant | # 1 sec bins | Bins with >0 counts | Bins with >2000 counts | High rate bins dominated by noise | Noise dominated (total time) | Noise dominated (detector-on time) | Marked lightcurve |
|---|---|---|---|---|---|---|---|
| A | 7631 | 6587 | 1789 | 1789 | 23.44% | 27.16% |  |
| B | 7632 | 6588 | 87 | 87 | 1.14% | 1.32% |  |
| C | 7632 | 6588 | 228 | 228 | 2.99% | 3.46% | 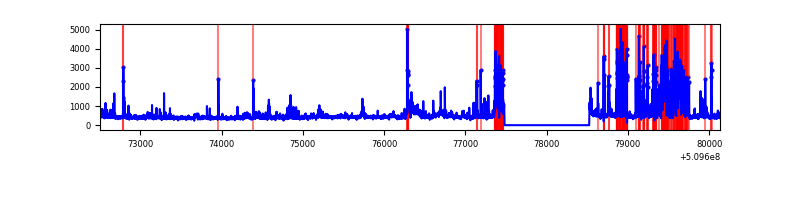 |
| D | 7631 | 6586 | 5928 | 5928 | 77.68% | 90.01% |  |
Top three noisy pixels from each quadrant. If the there are fewer than three noisy pixels in the level2.evt file, extra rows are filled as -1
| Pixel properties | Quadrant properties | ||||||
|---|---|---|---|---|---|---|---|
| Quadrant | DetID | PixID | Counts | Sigma | Mean | Median | Sigma |
| A | 11 | 31 | 3198576 | 20461.52 | 629 | 611 | 156.3 |
| A | 4 | 95 | 974925 | 6233.95 | 629 | 611 | 156.3 |
| A | 3 | 14 | 388019 | 2478.75 | 629 | 611 | 156.3 |
| B | 5 | 185 | 309372 | 2108.34 | 685 | 660 | 146.4 |
| B | 0 | 231 | 302498 | 2061.4 | 685 | 660 | 146.4 |
| B | 3 | 145 | 123565 | 839.38 | 685 | 660 | 146.4 |
| C | 13 | 3 | 872051 | 4795.99 | 663 | 656 | 181.7 |
| C | 12 | 252 | 309888 | 1701.95 | 663 | 656 | 181.7 |
| C | 15 | 198 | 88515 | 483.56 | 663 | 656 | 181.7 |
| D | 8 | 129 | 13600737 | 261916.58 | 175 | 167 | 51.9 |
| D | 12 | 3 | 2255418 | 43431.09 | 175 | 167 | 51.9 |
| D | 6 | 239 | 44473 | 853.23 | 175 | 167 | 51.9 |
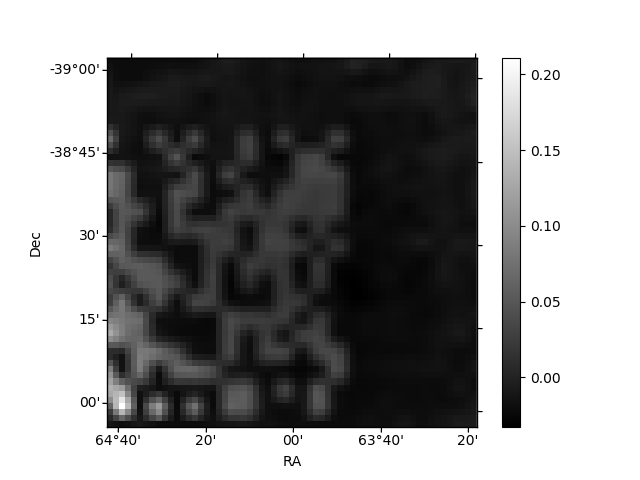
Histogram calculated using DETX and DETY for each event in the final _common_clean file
| Quadrant A |  |
 |
Quadrant B |
|---|---|---|---|
| Quadrant D | 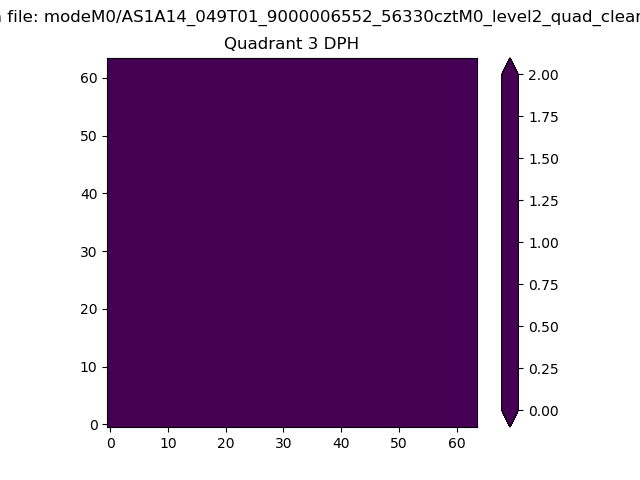 |
 |
Quadrant C |
| Plot type | Count rate plots | Images |
|---|---|---|
| Comparison with Poisson distribution Blue bars denote a histogram of data divided into 1 sec bins. Red curve is a Poisson curve with rate = median count rate of data. |
 |
 |
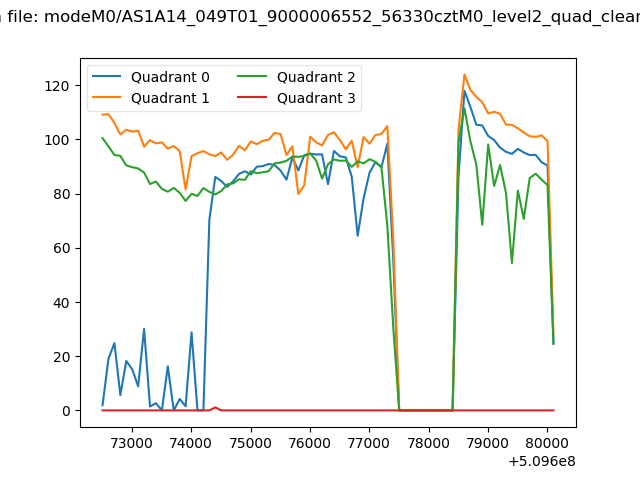
| Quadrant-wise count rates Data is divided into 100 sec bins |
 |
|
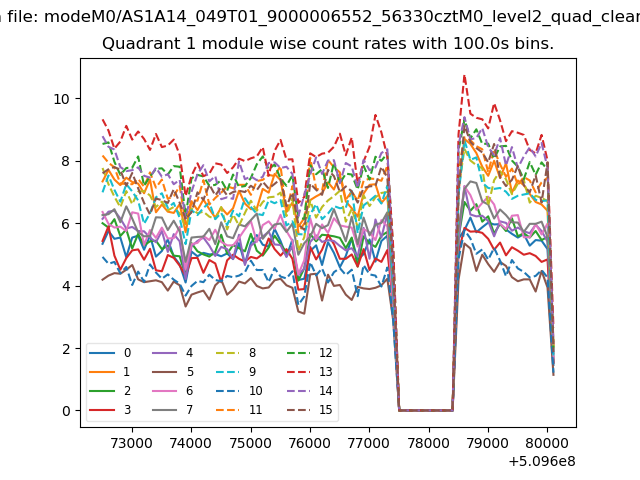
| Module-wise count rates for Quadrant A Data is divided into 100 sec bins |
 |
 |
| Module-wise count rates for Quadrant B Data is divided into 100 sec bins |
 |
 |
| Module-wise count rates for Quadrant C Data is divided into 100 sec bins |
 |
 |
| Module-wise count rates for Quadrant D Data is divided into 100 sec bins |
 |
 |
| Parameter | Plot |
|---|---|
| CZT HV Monitor | 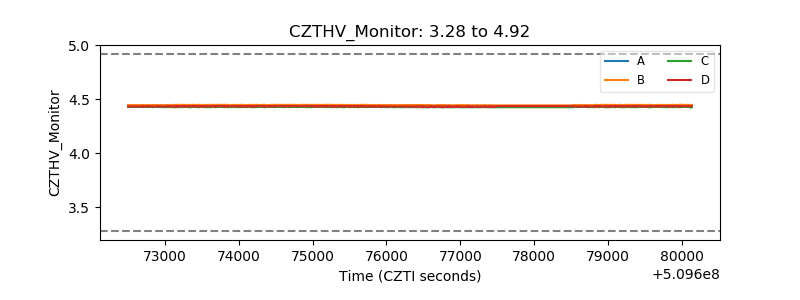 |
| D_VDD |  |
| Temperature 1 |  |
| Veto HV Monitor | 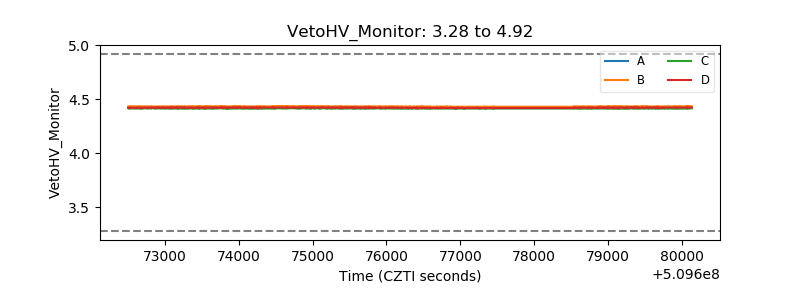 |
| Veto LLD | 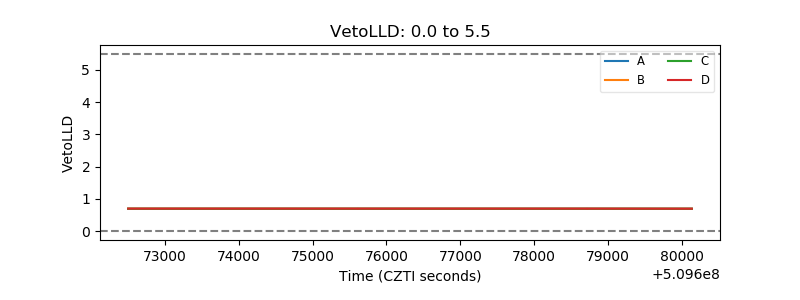 |
| Alpha Counter |  |
| _CPM_Rate | 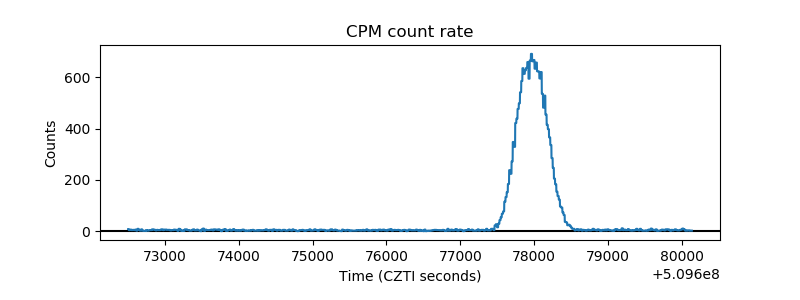 |
| CZT Counter |  |
| +2.5 Volts monitor |  |
| +5 Volts monitor | 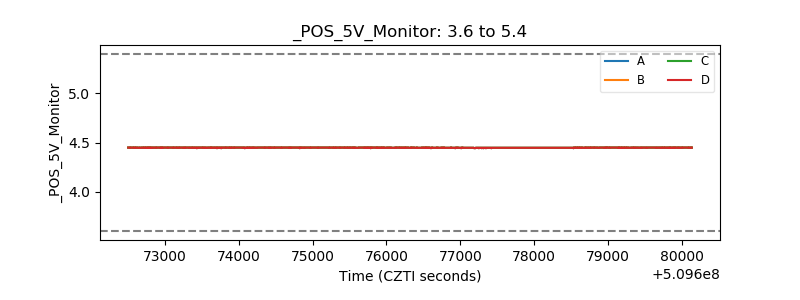 |
| _ROLL_ROT | 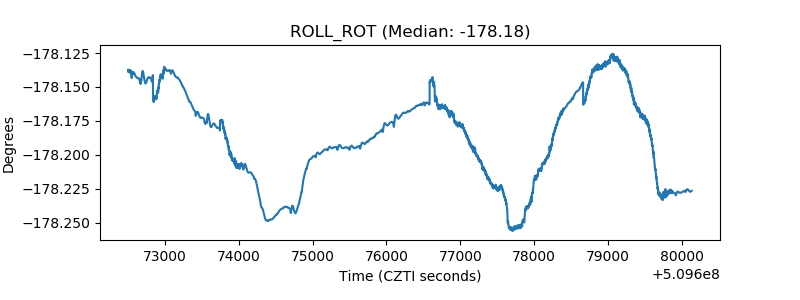 |
| _Roll_DEC | 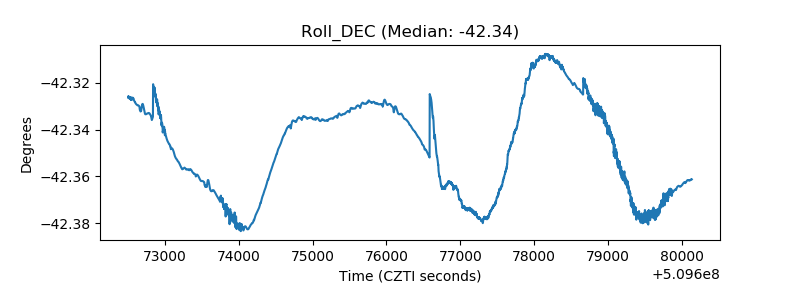 |
| _Roll_RA |  |
| Veto Counter | 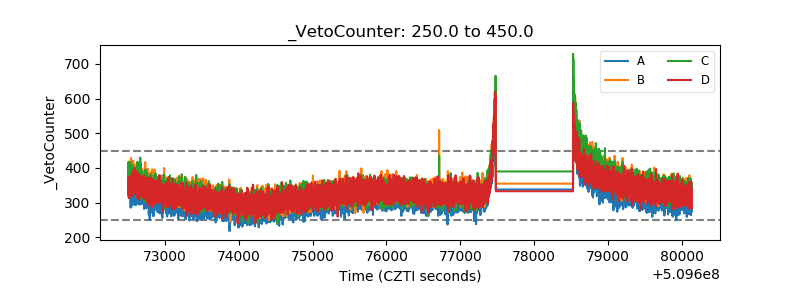 |