| Param | Original file | Final file |
|---|---|---|
| Filename | modeM0/AS1A14_049T01_9000006552_56331cztM0_level2.fits | modeM0/AS1A14_049T01_9000006552_56331cztM0_level2_quad_clean.evt |
| Size (bytes) | 787,282,560 | 77,921,280 |
| Size | 750.8 MB | 74.3 MB |
| Events in quadrant A | 4,383,114 | 615,678 |
| Events in quadrant B | 3,578,032 | 685,152 |
| Events in quadrant C | 4,971,088 | 582,530 |
| Events in quadrant D | 15,703,240 | 21,106 |
| Mode SS | |||
|---|---|---|---|
| Quadrant | BADHDUFLAG | Total packets | Discarded packets |
| A | 0 | 132 | 0 |
| B | 0 | 132 | 0 |
| C | 0 | 132 | 0 |
| D | 0 | 132 | 0 |
| Mode M9 | |||
|---|---|---|---|
| Quadrant | BADHDUFLAG | Total packets | Discarded packets |
| A | 0 | 19 | 0 |
| B | 0 | 20 | 0 |
| C | 0 | 20 | 0 |
| D | 0 | 20 | 0 |
| Mode M0 | |||
|---|---|---|---|
| Quadrant | BADHDUFLAG | Total packets | Discarded packets |
| A | 0 | 17647 | 2 |
| B | 0 | 15116 | 2 |
| C | 0 | 19300 | 2 |
| D | 0 | 51140 | 5 |
| Quadrant | Total seconds | Saturated seconds | Saturation percentage |
|---|---|---|---|
| A | 6523 | 326 | 4.997700% |
| B | 6523 | 181 | 2.774797% |
| C | 6523 | 475 | 7.281925% |
| D | 6522 | 6352 | 97.393438% |
Noise dominated data is calculated using 1-second bins in cleaned event files. If a bin has >2000 counts, and if more than 50% of those come from <1% of pixels, then it is considered to be noise-dominated and hence unusable.
| Quadrant | # 1 sec bins | Bins with >0 counts | Bins with >2000 counts | High rate bins dominated by noise | Noise dominated (total time) | Noise dominated (detector-on time) | Marked lightcurve |
|---|---|---|---|---|---|---|---|
| A | 7633 | 6524 | 253 | 253 | 3.31% | 3.88% | 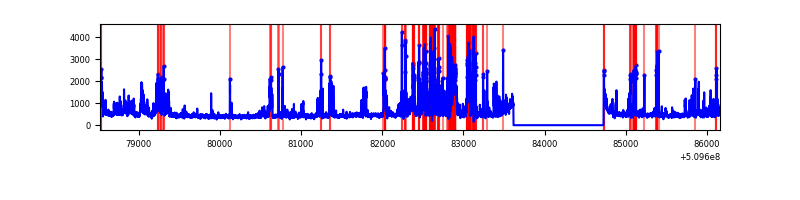 |
| B | 7633 | 6524 | 77 | 77 | 1.01% | 1.18% | 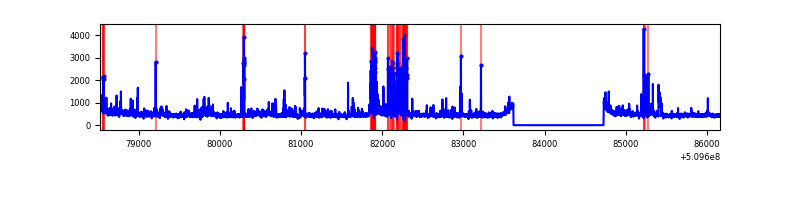 |
| C | 7633 | 6524 | 386 | 386 | 5.06% | 5.92% | 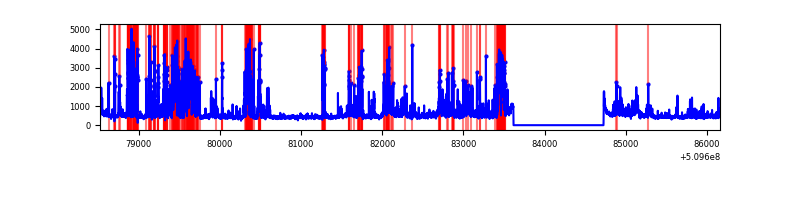 |
| D | 7631 | 6521 | 5343 | 5343 | 70.02% | 81.94% |  |
Top three noisy pixels from each quadrant. If the there are fewer than three noisy pixels in the level2.evt file, extra rows are filled as -1
| Pixel properties | Quadrant properties | ||||||
|---|---|---|---|---|---|---|---|
| Quadrant | DetID | PixID | Counts | Sigma | Mean | Median | Sigma |
| A | 4 | 95 | 375263 | 2141.2 | 698 | 679 | 174.9 |
| A | 2 | 79 | 256879 | 1464.49 | 698 | 679 | 174.9 |
| A | 0 | 8 | 240922 | 1373.28 | 698 | 679 | 174.9 |
| B | 5 | 185 | 313310 | 2097.31 | 703 | 677 | 149.1 |
| B | 3 | 145 | 141709 | 946.12 | 703 | 677 | 149.1 |
| B | 9 | 251 | 55106 | 365.14 | 703 | 677 | 149.1 |
| C | 13 | 3 | 1795922 | 9708.7 | 677 | 672 | 184.9 |
| C | 12 | 252 | 261862 | 1412.51 | 677 | 672 | 184.9 |
| C | 12 | 249 | 78769 | 422.35 | 677 | 672 | 184.9 |
| D | 8 | 129 | 13017909 | 267302.24 | 164 | 154 | 48.7 |
| D | 12 | 3 | 1617050 | 33200.8 | 164 | 154 | 48.7 |
| D | 11 | 129 | 165199 | 3388.98 | 164 | 154 | 48.7 |
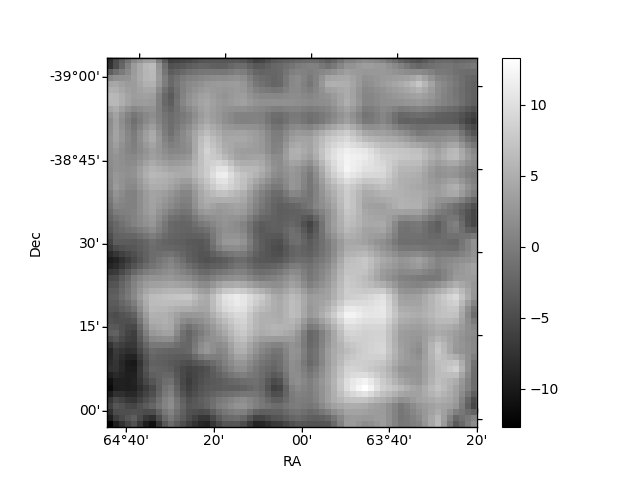
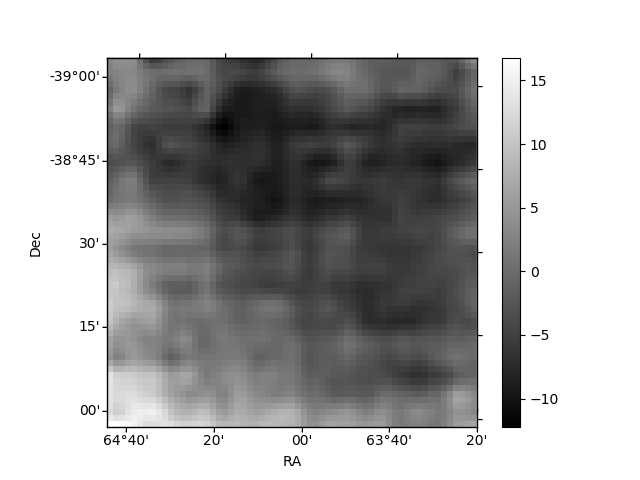
Histogram calculated using DETX and DETY for each event in the final _common_clean file
| Quadrant A | 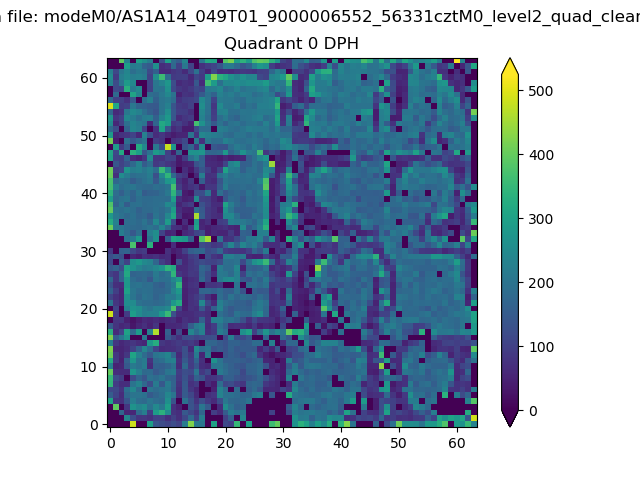 |
 |
Quadrant B |
|---|---|---|---|
| Quadrant D | 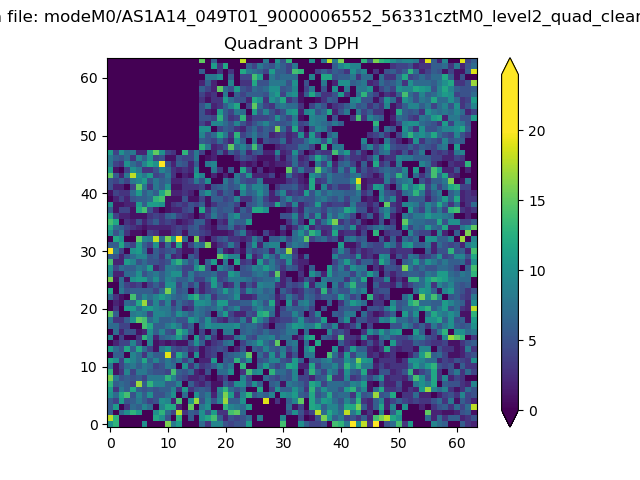 |
 |
Quadrant C |
| Plot type | Count rate plots | Images |
|---|---|---|
| Comparison with Poisson distribution Blue bars denote a histogram of data divided into 1 sec bins. Red curve is a Poisson curve with rate = median count rate of data. |
 |
 |
| Quadrant-wise count rates Data is divided into 100 sec bins |
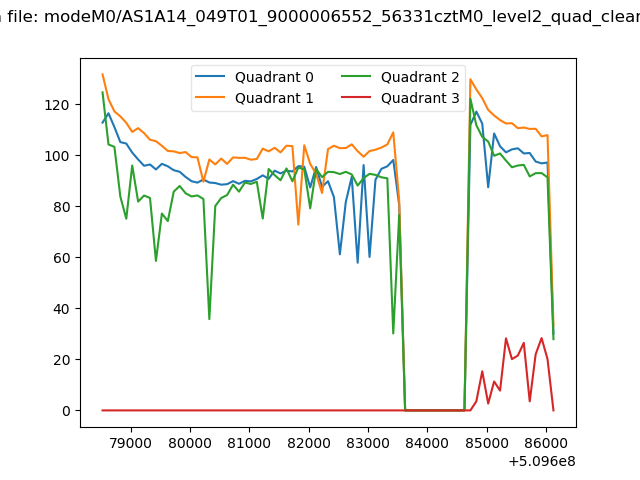 |
|
| Module-wise count rates for Quadrant A Data is divided into 100 sec bins |
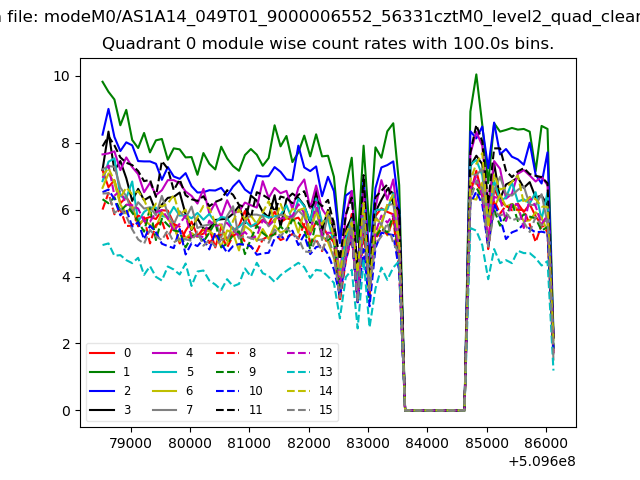 |
 |
| Module-wise count rates for Quadrant B Data is divided into 100 sec bins |
 |
 |
| Module-wise count rates for Quadrant C Data is divided into 100 sec bins |
 |
 |
| Module-wise count rates for Quadrant D Data is divided into 100 sec bins |
 |
 |
| Parameter | Plot |
|---|---|
| CZT HV Monitor |  |
| D_VDD | 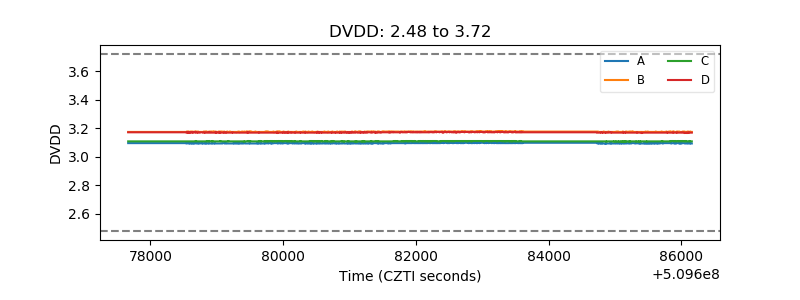 |
| Temperature 1 |  |
| Veto HV Monitor | 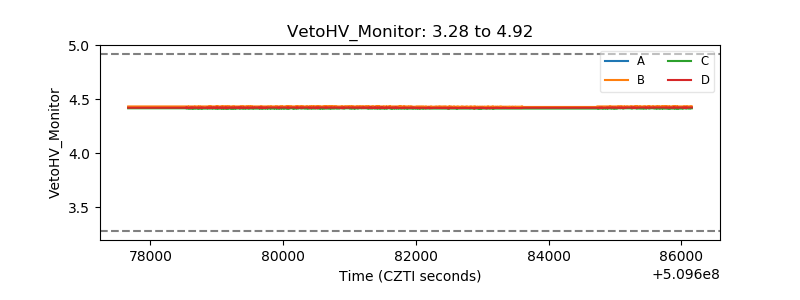 |
| Veto LLD | 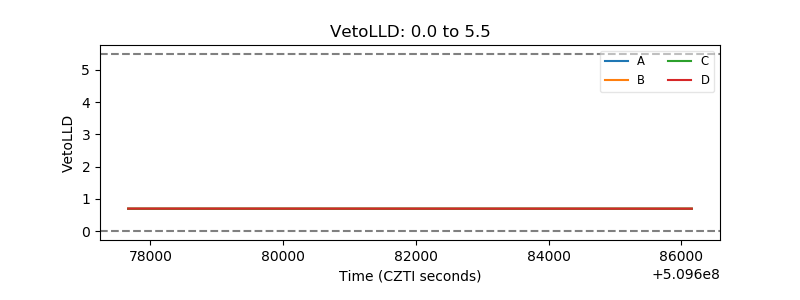 |
| Alpha Counter |  |
| _CPM_Rate | 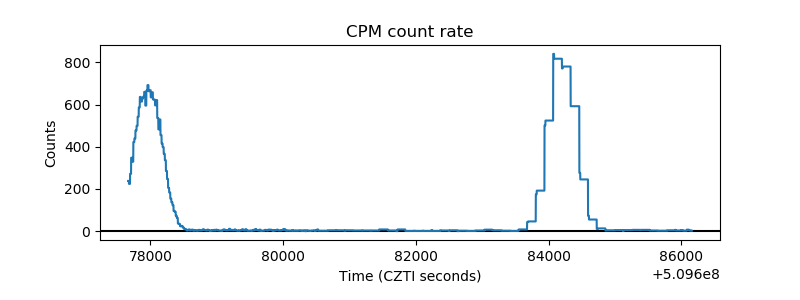 |
| CZT Counter | 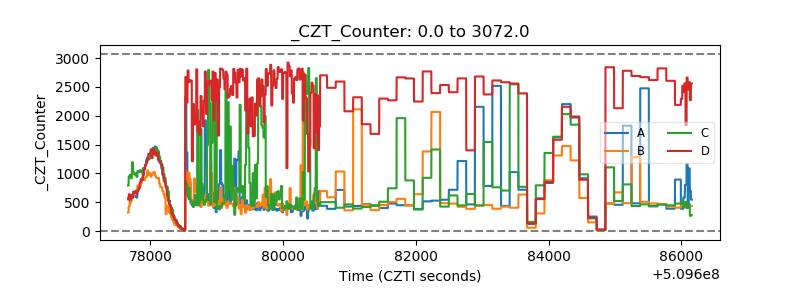 |
| +2.5 Volts monitor | 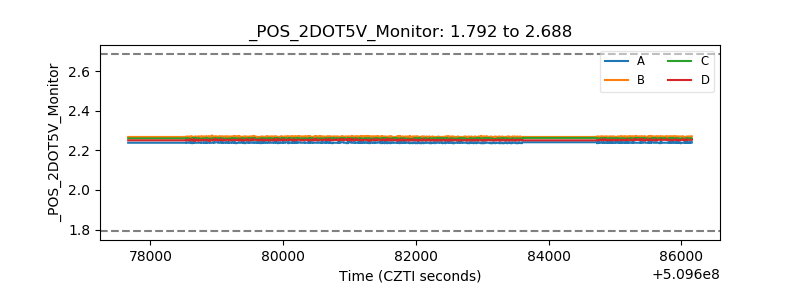 |
| +5 Volts monitor |  |
| _ROLL_ROT |  |
| _Roll_DEC |  |
| _Roll_RA | 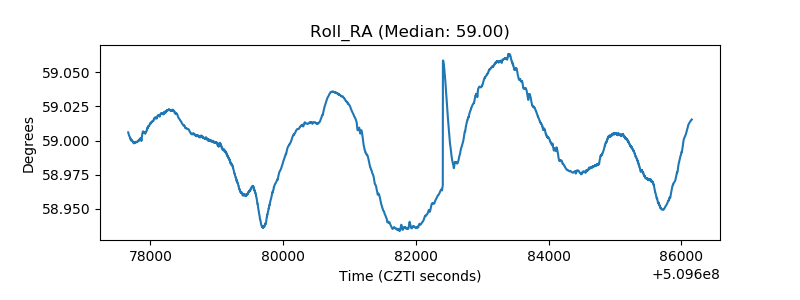 |
| Veto Counter |  |