| Param | Original file | Final file |
|---|---|---|
| Filename | modeM0/AS1A14_049T01_9000006552_56332cztM0_level2.fits | modeM0/AS1A14_049T01_9000006552_56332cztM0_level2_quad_clean.evt |
| Size (bytes) | 819,754,560 | 79,945,920 |
| Size | 781.8 MB | 76.2 MB |
| Events in quadrant A | 6,771,733 | 572,464 |
| Events in quadrant B | 3,527,067 | 710,266 |
| Events in quadrant C | 3,965,849 | 630,605 |
| Events in quadrant D | 15,564,201 | 44,015 |
| Mode SS | |||
|---|---|---|---|
| Quadrant | BADHDUFLAG | Total packets | Discarded packets |
| A | 0 | 138 | 0 |
| B | 0 | 138 | 0 |
| C | 0 | 138 | 0 |
| D | 0 | 138 | 0 |
| Mode M9 | |||
|---|---|---|---|
| Quadrant | BADHDUFLAG | Total packets | Discarded packets |
| A | 0 | 22 | 0 |
| B | 0 | 22 | 0 |
| C | 0 | 22 | 0 |
| D | 0 | 22 | 0 |
| Mode M0 | |||
|---|---|---|---|
| Quadrant | BADHDUFLAG | Total packets | Discarded packets |
| A | 0 | 24678 | 2 |
| B | 0 | 15007 | 2 |
| C | 0 | 16377 | 2 |
| D | 0 | 50790 | 2 |
| Quadrant | Total seconds | Saturated seconds | Saturation percentage |
|---|---|---|---|
| A | 6640 | 1104 | 16.626506% |
| B | 6640 | 212 | 3.192771% |
| C | 6639 | 171 | 2.575689% |
| D | 6640 | 6247 | 94.081325% |
Noise dominated data is calculated using 1-second bins in cleaned event files. If a bin has >2000 counts, and if more than 50% of those come from <1% of pixels, then it is considered to be noise-dominated and hence unusable.
| Quadrant | # 1 sec bins | Bins with >0 counts | Bins with >2000 counts | High rate bins dominated by noise | Noise dominated (total time) | Noise dominated (detector-on time) | Marked lightcurve |
|---|---|---|---|---|---|---|---|
| A | 8905 | 6642 | 955 | 955 | 10.72% | 14.38% | 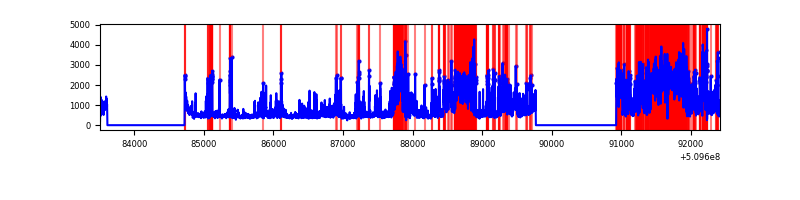 |
| B | 8905 | 6642 | 56 | 56 | 0.63% | 0.84% |  |
| C | 8904 | 6641 | 84 | 84 | 0.94% | 1.26% | 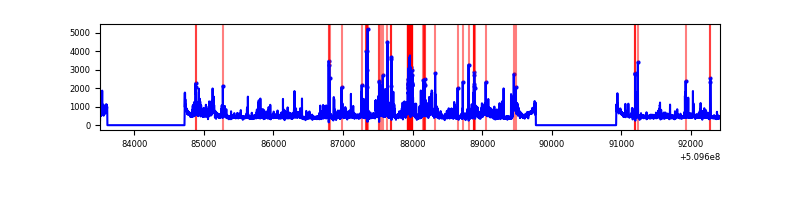 |
| D | 8905 | 6640 | 5141 | 5141 | 57.73% | 77.42% | 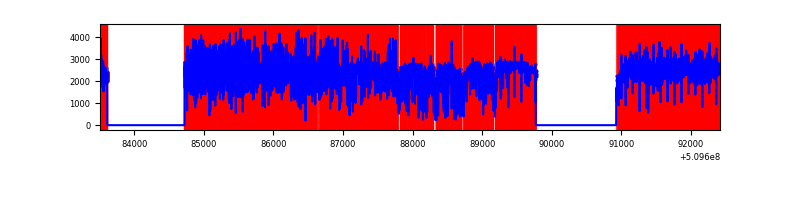 |
Top three noisy pixels from each quadrant. If the there are fewer than three noisy pixels in the level2.evt file, extra rows are filled as -1
| Pixel properties | Quadrant properties | ||||||
|---|---|---|---|---|---|---|---|
| Quadrant | DetID | PixID | Counts | Sigma | Mean | Median | Sigma |
| A | 4 | 95 | 2041754 | 11706.91 | 712 | 695 | 174.3 |
| A | 8 | 25 | 446939 | 2559.52 | 712 | 695 | 174.3 |
| A | 4 | 249 | 426829 | 2444.18 | 712 | 695 | 174.3 |
| B | 5 | 185 | 276612 | 1757.5 | 740 | 713 | 157.0 |
| B | 0 | 231 | 59610 | 375.18 | 740 | 713 | 157.0 |
| B | 1 | 255 | 59431 | 374.04 | 740 | 713 | 157.0 |
| C | 12 | 252 | 576479 | 2899.12 | 731 | 727 | 198.6 |
| C | 15 | 198 | 117659 | 588.8 | 731 | 727 | 198.6 |
| C | 13 | 3 | 103337 | 516.68 | 731 | 727 | 198.6 |
| D | 8 | 129 | 12539270 | 160548.19 | 267 | 252 | 78.1 |
| D | 12 | 3 | 1352511 | 17314.17 | 267 | 252 | 78.1 |
| D | 11 | 129 | 229888 | 2940.23 | 267 | 252 | 78.1 |
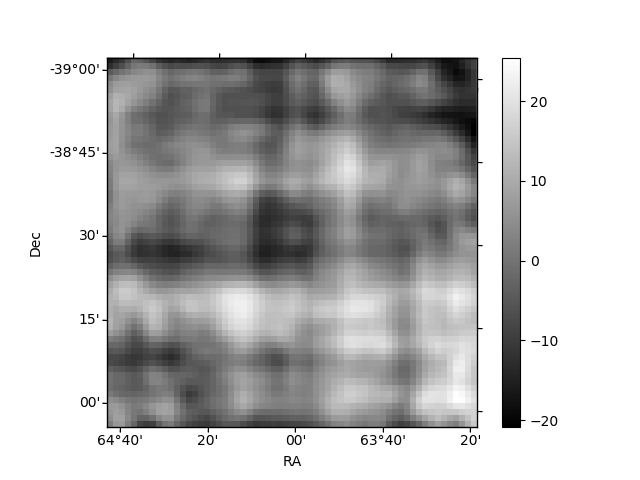
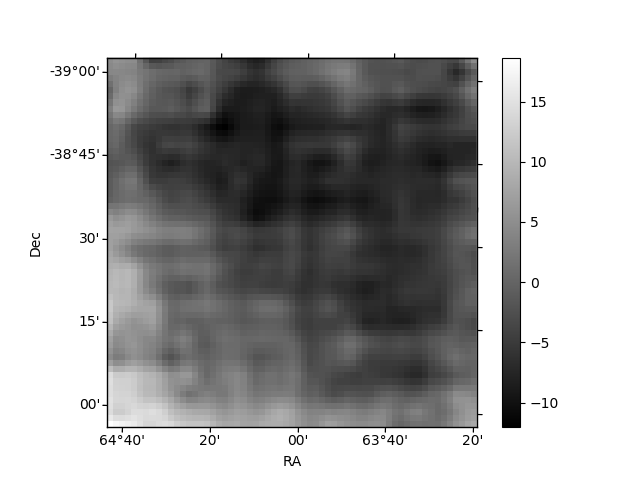
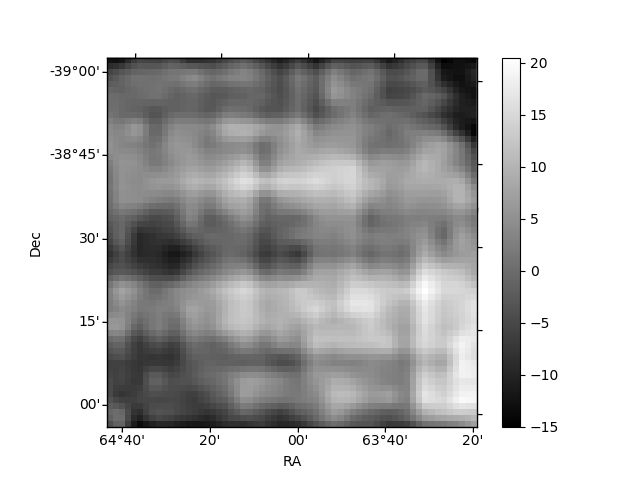
Histogram calculated using DETX and DETY for each event in the final _common_clean file
| Quadrant A | 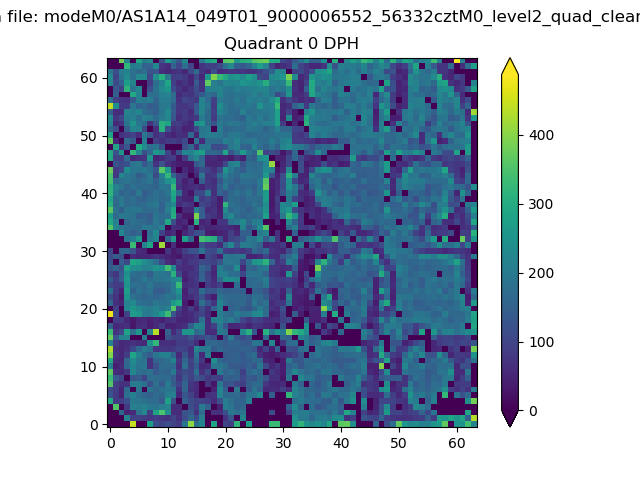 |
 |
Quadrant B |
|---|---|---|---|
| Quadrant D |  |
 |
Quadrant C |
| Plot type | Count rate plots | Images |
|---|---|---|
| Comparison with Poisson distribution Blue bars denote a histogram of data divided into 1 sec bins. Red curve is a Poisson curve with rate = median count rate of data. |
 |
 |
| Quadrant-wise count rates Data is divided into 100 sec bins |
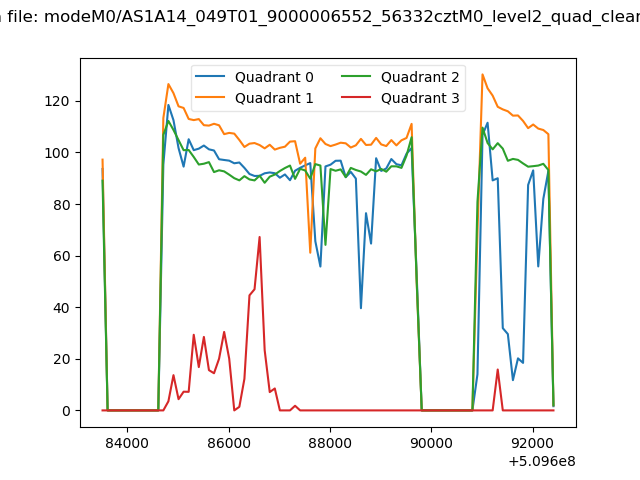 |
|
| Module-wise count rates for Quadrant A Data is divided into 100 sec bins |
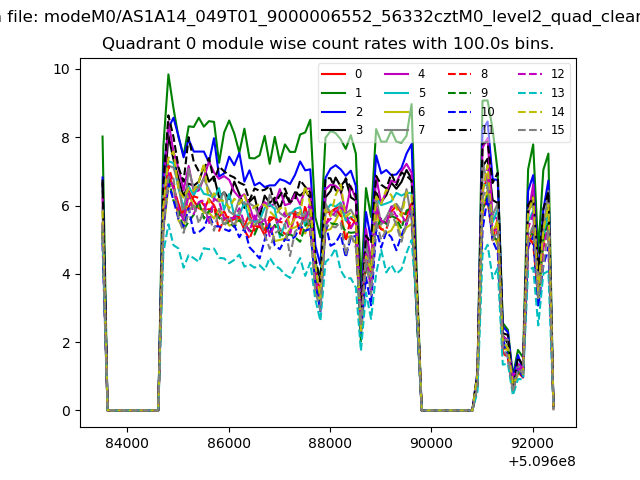 |
 |
| Module-wise count rates for Quadrant B Data is divided into 100 sec bins |
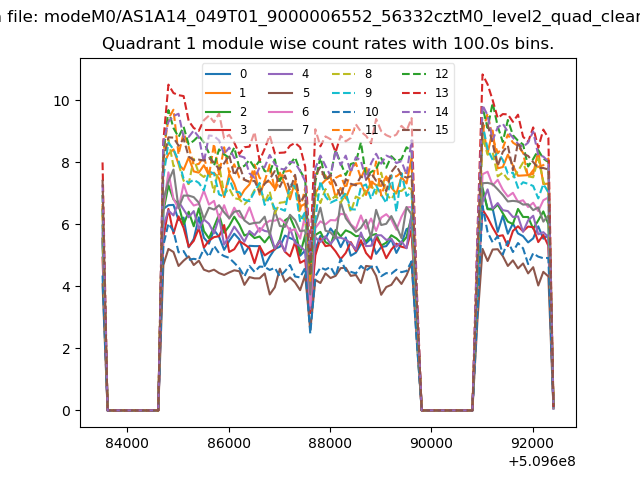 |
 |
| Module-wise count rates for Quadrant C Data is divided into 100 sec bins |
 |
 |
| Module-wise count rates for Quadrant D Data is divided into 100 sec bins |
 |
 |
| Parameter | Plot |
|---|---|
| CZT HV Monitor |  |
| D_VDD |  |
| Temperature 1 | 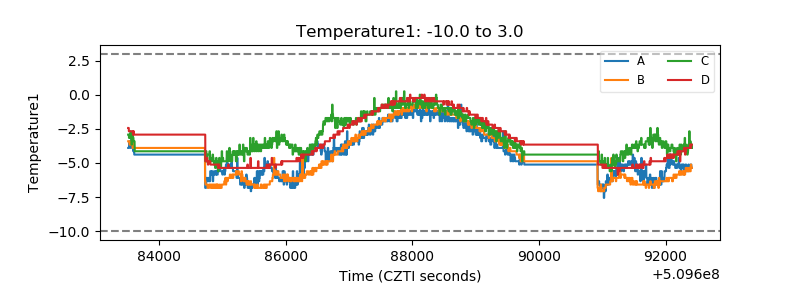 |
| Veto HV Monitor | 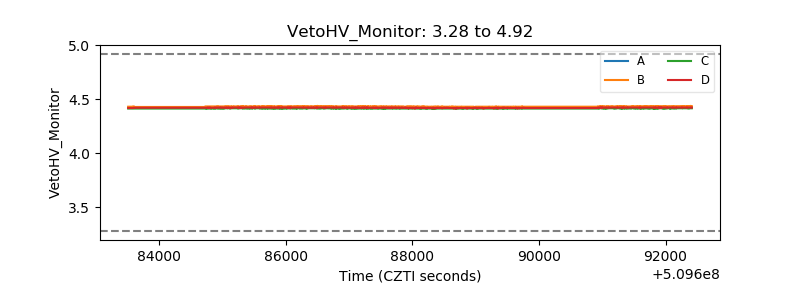 |
| Veto LLD | 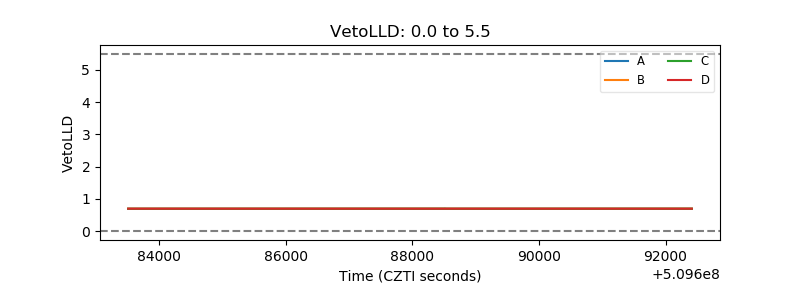 |
| Alpha Counter | 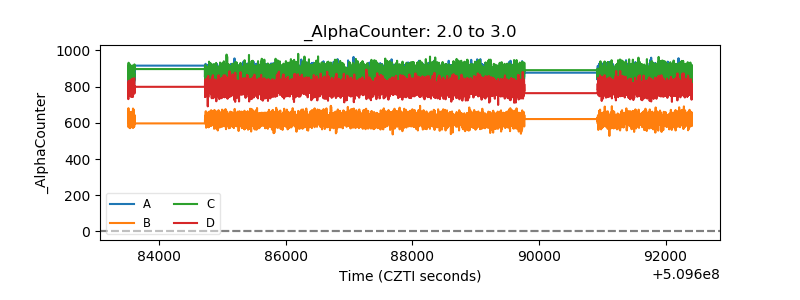 |
| _CPM_Rate |  |
| CZT Counter | 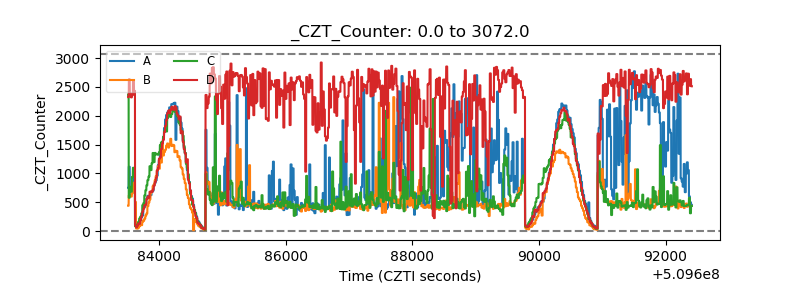 |
| +2.5 Volts monitor | 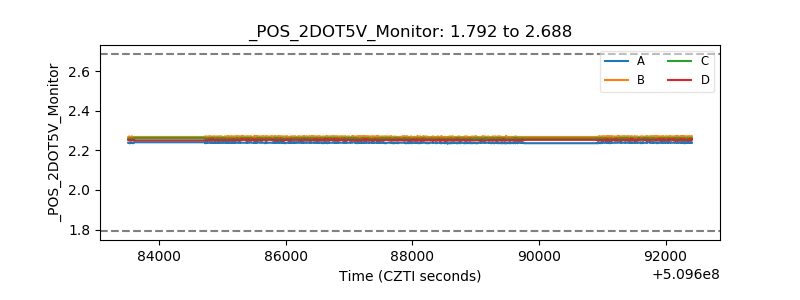 |
| +5 Volts monitor | 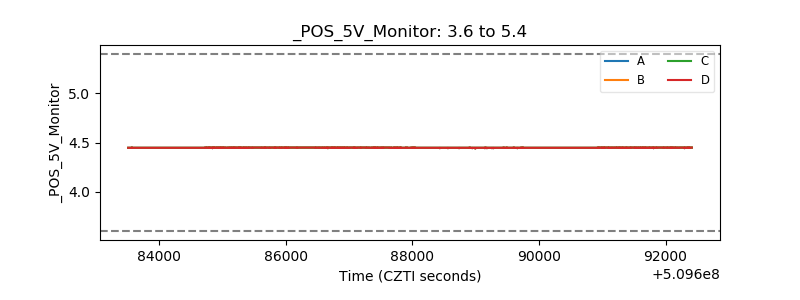 |
| _ROLL_ROT | 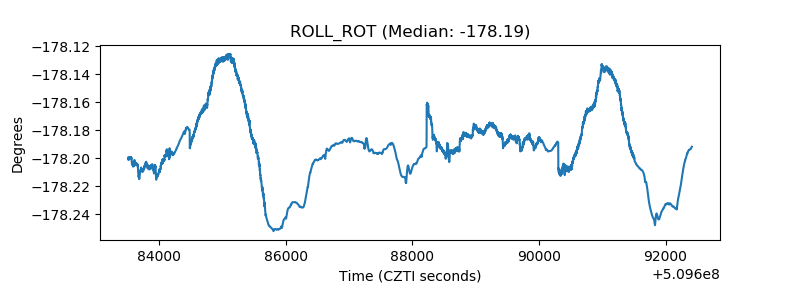 |
| _Roll_DEC |  |
| _Roll_RA | 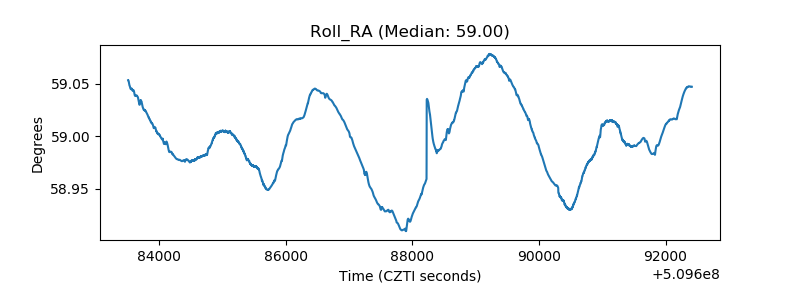 |
| Veto Counter |  |