| Param | Original file | Final file |
|---|---|---|
| Filename | modeM0/AS1A14_049T01_9000006552_56335cztM0_level2.fits | modeM0/AS1A14_049T01_9000006552_56335cztM0_level2_quad_clean.evt |
| Size (bytes) | 802,745,280 | 78,071,040 |
| Size | 765.6 MB | 74.5 MB |
| Events in quadrant A | 5,937,404 | 575,082 |
| Events in quadrant B | 3,917,086 | 671,076 |
| Events in quadrant C | 3,878,791 | 609,287 |
| Events in quadrant D | 15,454,963 | 37,021 |
| Mode SS | |||
|---|---|---|---|
| Quadrant | BADHDUFLAG | Total packets | Discarded packets |
| A | 0 | 136 | 0 |
| B | 0 | 136 | 0 |
| C | 0 | 136 | 0 |
| D | 0 | 136 | 0 |
| Mode M9 | |||
|---|---|---|---|
| Quadrant | BADHDUFLAG | Total packets | Discarded packets |
| A | 0 | 8 | 0 |
| B | 0 | 8 | 0 |
| C | 0 | 8 | 0 |
| D | 0 | 8 | 0 |
| Mode M0 | |||
|---|---|---|---|
| Quadrant | BADHDUFLAG | Total packets | Discarded packets |
| A | 0 | 22257 | 1 |
| B | 0 | 16428 | 1 |
| C | 0 | 16457 | 1 |
| D | 0 | 50664 | 1 |
| Quadrant | Total seconds | Saturated seconds | Saturation percentage |
|---|---|---|---|
| A | 6771 | 844 | 12.464924% |
| B | 6771 | 314 | 4.637424% |
| C | 6772 | 248 | 3.662138% |
| D | 6772 | 6431 | 94.964560% |
Noise dominated data is calculated using 1-second bins in cleaned event files. If a bin has >2000 counts, and if more than 50% of those come from <1% of pixels, then it is considered to be noise-dominated and hence unusable.
| Quadrant | # 1 sec bins | Bins with >0 counts | Bins with >2000 counts | High rate bins dominated by noise | Noise dominated (total time) | Noise dominated (detector-on time) | Marked lightcurve |
|---|---|---|---|---|---|---|---|
| A | 7466 | 6773 | 602 | 602 | 8.06% | 8.89% |  |
| B | 7466 | 6772 | 95 | 95 | 1.27% | 1.40% |  |
| C | 7467 | 6774 | 108 | 108 | 1.45% | 1.59% | 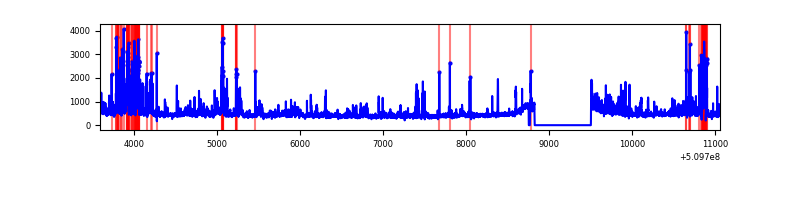 |
| D | 7467 | 6773 | 5044 | 5044 | 67.55% | 74.47% |  |
Top three noisy pixels from each quadrant. If the there are fewer than three noisy pixels in the level2.evt file, extra rows are filled as -1
| Pixel properties | Quadrant properties | ||||||
|---|---|---|---|---|---|---|---|
| Quadrant | DetID | PixID | Counts | Sigma | Mean | Median | Sigma |
| A | 4 | 95 | 1579472 | 9059.44 | 709 | 692 | 174.3 |
| A | 0 | 8 | 743560 | 4262.76 | 709 | 692 | 174.3 |
| A | 15 | 33 | 306431 | 1754.41 | 709 | 692 | 174.3 |
| B | 5 | 185 | 411970 | 2666.05 | 718 | 689 | 154.3 |
| B | 1 | 255 | 136588 | 880.94 | 718 | 689 | 154.3 |
| B | 5 | 172 | 125642 | 809.99 | 718 | 689 | 154.3 |
| C | 5 | 250 | 479494 | 2468.2 | 708 | 701 | 194.0 |
| C | 12 | 252 | 221625 | 1138.88 | 708 | 701 | 194.0 |
| C | 12 | 254 | 115868 | 593.69 | 708 | 701 | 194.0 |
| D | 8 | 129 | 13518356 | 215745.74 | 215 | 204 | 62.7 |
| D | 2 | 249 | 380764 | 6073.63 | 215 | 204 | 62.7 |
| D | 2 | 62 | 303771 | 4844.84 | 215 | 204 | 62.7 |
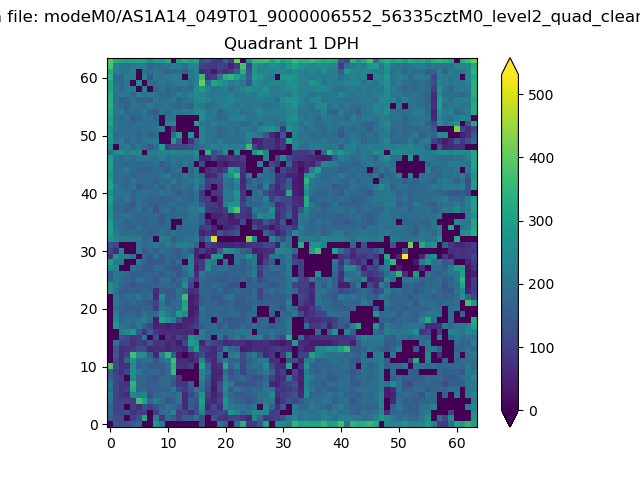
Histogram calculated using DETX and DETY for each event in the final _common_clean file
| Quadrant A |  |
 |
Quadrant B |
|---|---|---|---|
| Quadrant D | 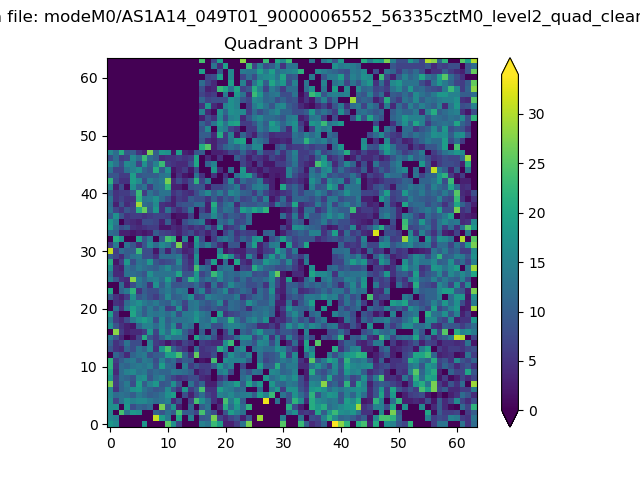 |
 |
Quadrant C |
| Plot type | Count rate plots | Images |
|---|---|---|
| Comparison with Poisson distribution Blue bars denote a histogram of data divided into 1 sec bins. Red curve is a Poisson curve with rate = median count rate of data. |
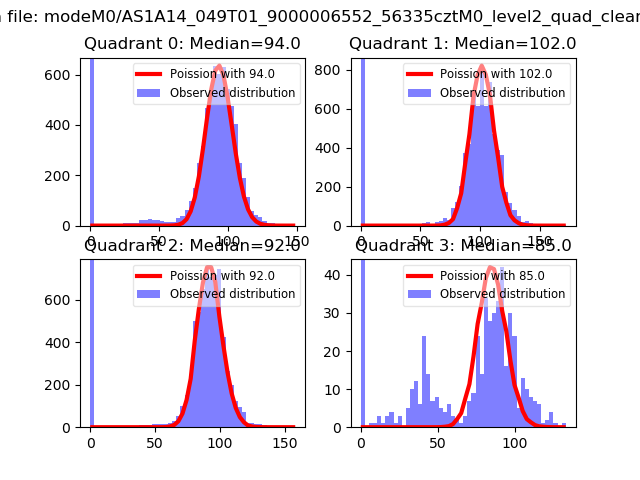 |
 |
| Quadrant-wise count rates Data is divided into 100 sec bins |
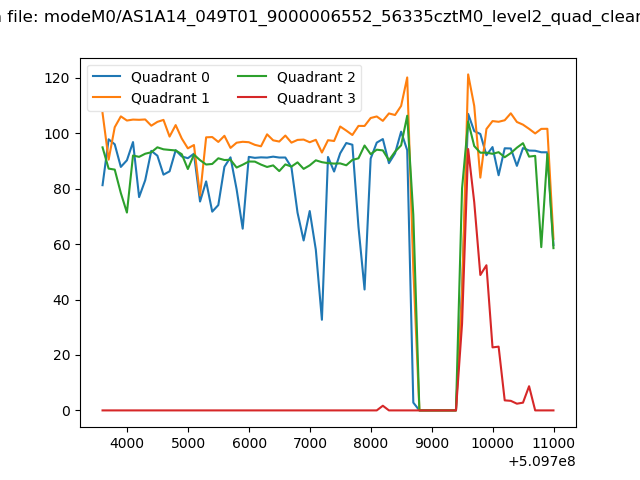 |
|
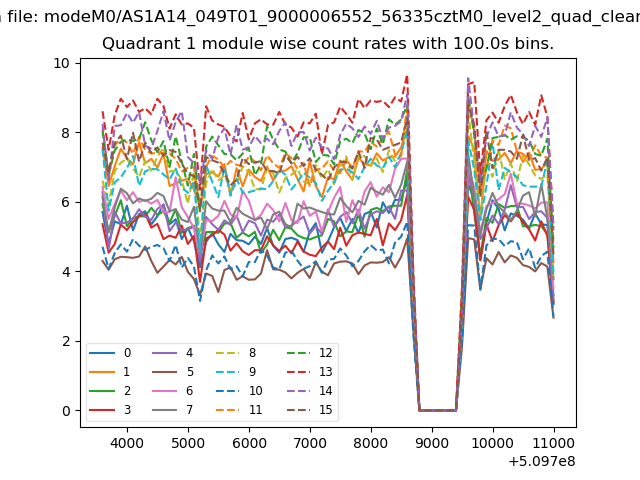
| Module-wise count rates for Quadrant A Data is divided into 100 sec bins |
 |
 |
| Module-wise count rates for Quadrant B Data is divided into 100 sec bins |
 |
 |
| Module-wise count rates for Quadrant C Data is divided into 100 sec bins |
 |
 |
| Module-wise count rates for Quadrant D Data is divided into 100 sec bins |
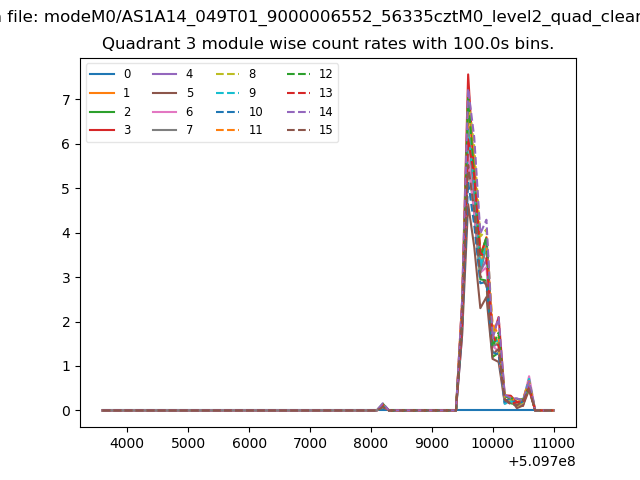 |
 |
| Parameter | Plot |
|---|---|
| CZT HV Monitor | 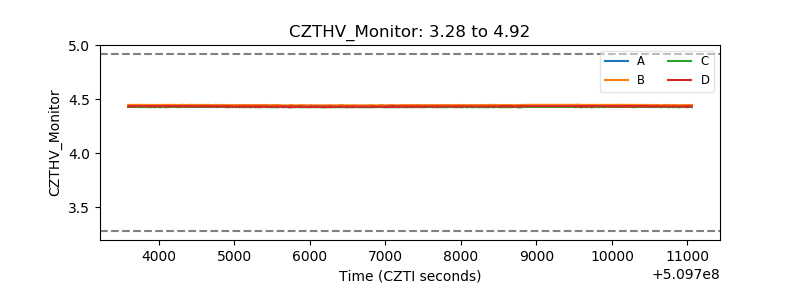 |
| D_VDD |  |
| Temperature 1 |  |
| Veto HV Monitor |  |
| Veto LLD | 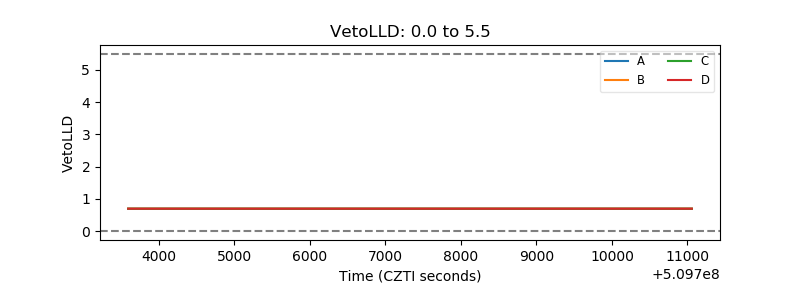 |
| Alpha Counter |  |
| _CPM_Rate | 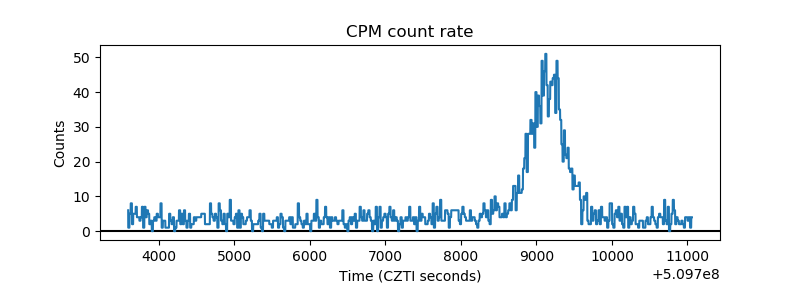 |
| CZT Counter |  |
| +2.5 Volts monitor |  |
| +5 Volts monitor | 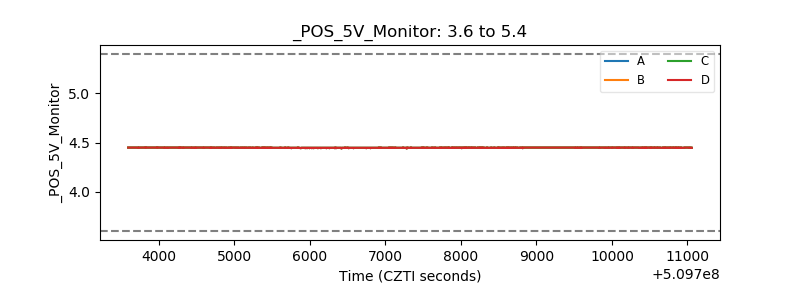 |
| _ROLL_ROT | 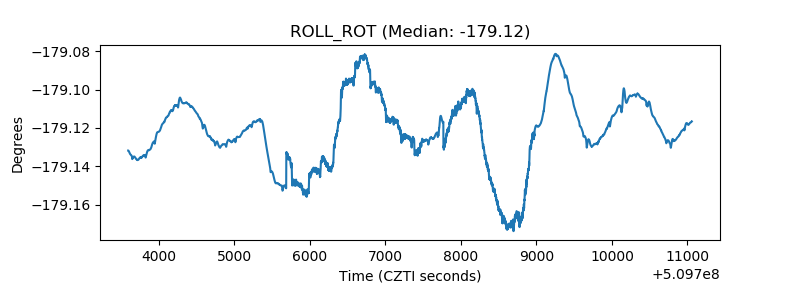 |
| _Roll_DEC | 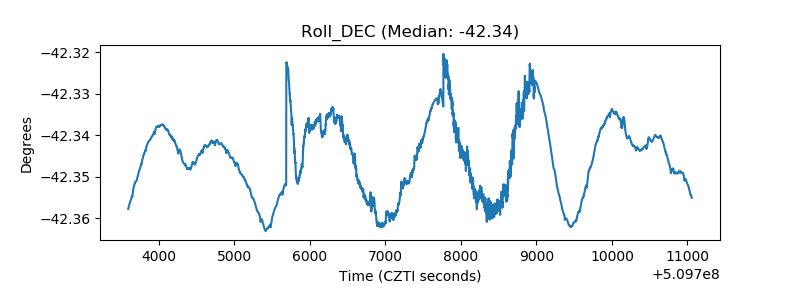 |
| _Roll_RA |  |
| Veto Counter | 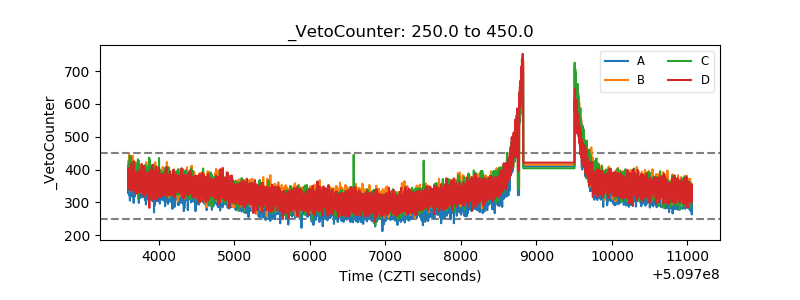 |