| Param | Original file | Final file |
|---|---|---|
| Filename | modeM0/AS1A14_049T01_9000006552_56336cztM0_level2.fits | modeM0/AS1A14_049T01_9000006552_56336cztM0_level2_quad_clean.evt |
| Size (bytes) | 949,564,800 | 89,928,000 |
| Size | 905.6 MB | 85.8 MB |
| Events in quadrant A | 5,797,729 | 691,052 |
| Events in quadrant B | 4,588,634 | 757,353 |
| Events in quadrant C | 5,040,149 | 685,823 |
| Events in quadrant D | 19,124,449 | 51,712 |
| Mode SS | |||
|---|---|---|---|
| Quadrant | BADHDUFLAG | Total packets | Discarded packets |
| A | 0 | 154 | 0 |
| B | 0 | 154 | 0 |
| C | 0 | 154 | 0 |
| D | 0 | 154 | 0 |
| Mode M0 | |||
|---|---|---|---|
| Quadrant | BADHDUFLAG | Total packets | Discarded packets |
| A | 0 | 22528 | 0 |
| B | 0 | 19046 | 0 |
| C | 0 | 20534 | 0 |
| D | 0 | 62164 | 0 |
| Quadrant | Total seconds | Saturated seconds | Saturation percentage |
|---|---|---|---|
| A | 7715 | 670 | 8.684381% |
| B | 7715 | 482 | 6.247570% |
| C | 7715 | 440 | 5.703176% |
| D | 7716 | 7235 | 93.766200% |
Noise dominated data is calculated using 1-second bins in cleaned event files. If a bin has >2000 counts, and if more than 50% of those come from <1% of pixels, then it is considered to be noise-dominated and hence unusable.
| Quadrant | # 1 sec bins | Bins with >0 counts | Bins with >2000 counts | High rate bins dominated by noise | Noise dominated (total time) | Noise dominated (detector-on time) | Marked lightcurve |
|---|---|---|---|---|---|---|---|
| A | 7715 | 7715 | 464 | 464 | 6.01% | 6.01% |  |
| B | 7715 | 7715 | 124 | 124 | 1.61% | 1.61% |  |
| C | 7715 | 7715 | 285 | 285 | 3.69% | 3.69% | 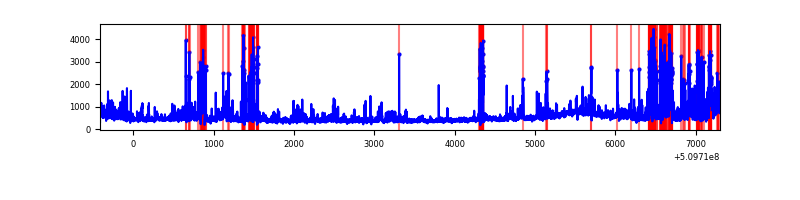 |
| D | 7715 | 7715 | 6650 | 6650 | 86.20% | 86.20% |  |
Top three noisy pixels from each quadrant. If the there are fewer than three noisy pixels in the level2.evt file, extra rows are filled as -1
| Pixel properties | Quadrant properties | ||||||
|---|---|---|---|---|---|---|---|
| Quadrant | DetID | PixID | Counts | Sigma | Mean | Median | Sigma |
| A | 4 | 95 | 1210855 | 5745.09 | 855 | 834 | 210.6 |
| A | 0 | 8 | 371157 | 1758.27 | 855 | 834 | 210.6 |
| A | 0 | 143 | 283372 | 1341.47 | 855 | 834 | 210.6 |
| B | 5 | 185 | 604317 | 3327.77 | 847 | 814 | 181.4 |
| B | 5 | 172 | 126775 | 694.56 | 847 | 814 | 181.4 |
| B | 0 | 231 | 103920 | 568.54 | 847 | 814 | 181.4 |
| C | 12 | 254 | 561449 | 2501.53 | 821 | 816 | 224.1 |
| C | 5 | 250 | 479158 | 2134.35 | 821 | 816 | 224.1 |
| C | 12 | 252 | 282145 | 1255.28 | 821 | 816 | 224.1 |
| D | 8 | 129 | 17150528 | 197699.09 | 300 | 287 | 86.7 |
| D | 2 | 62 | 243947 | 2808.79 | 300 | 287 | 86.7 |
| D | 12 | 3 | 109268 | 1256.28 | 300 | 287 | 86.7 |
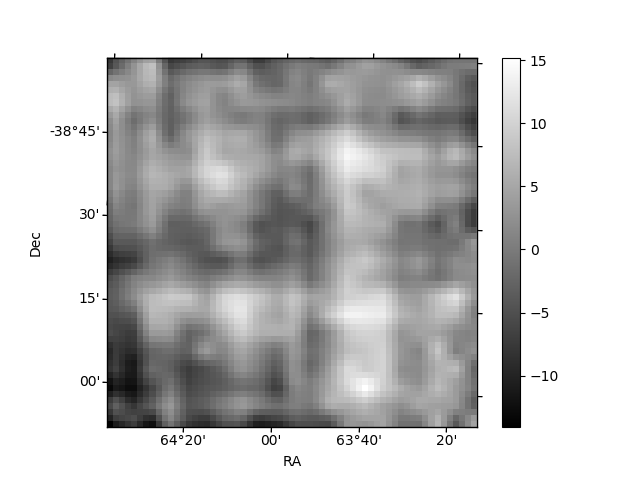
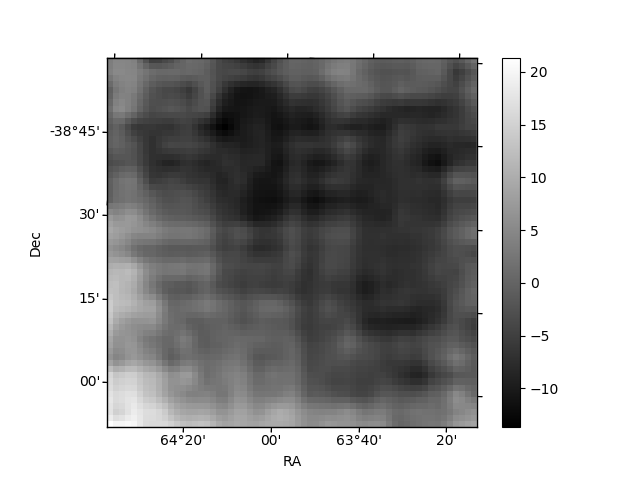
Histogram calculated using DETX and DETY for each event in the final _common_clean file
| Quadrant A | 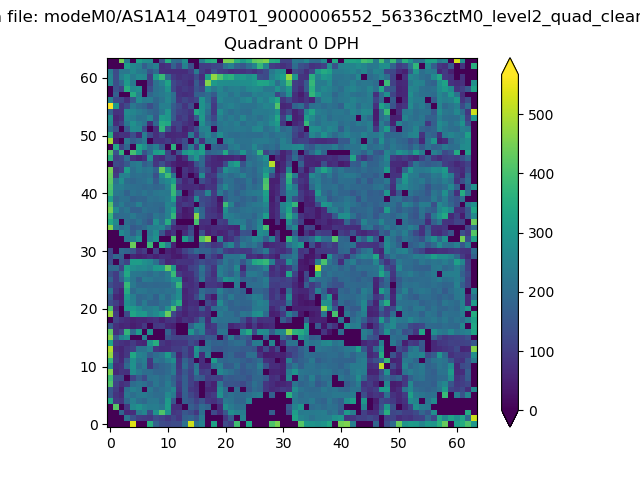 |
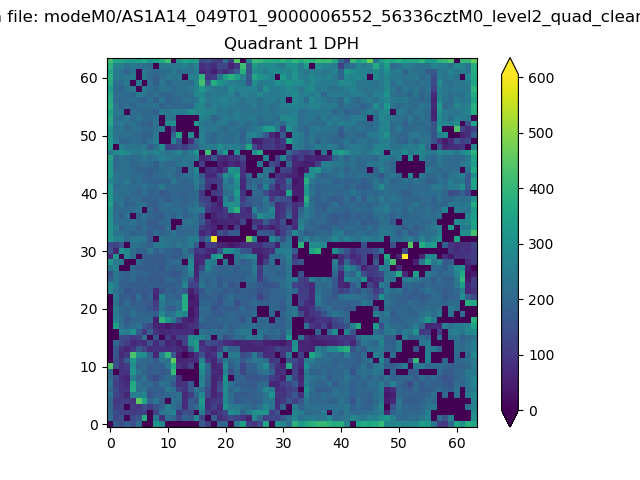 |
Quadrant B |
|---|---|---|---|
| Quadrant D | 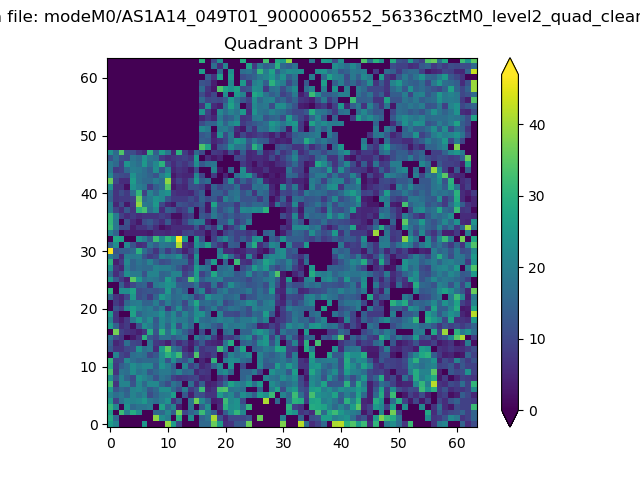 |
 |
Quadrant C |
| Plot type | Count rate plots | Images |
|---|---|---|
| Comparison with Poisson distribution Blue bars denote a histogram of data divided into 1 sec bins. Red curve is a Poisson curve with rate = median count rate of data. |
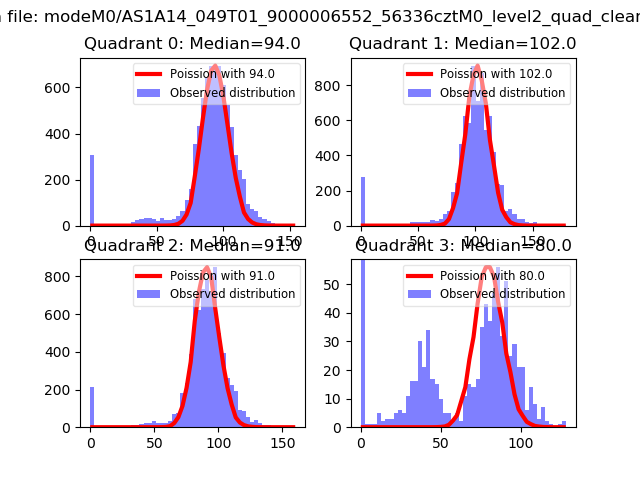 |
 |
| Quadrant-wise count rates Data is divided into 100 sec bins |
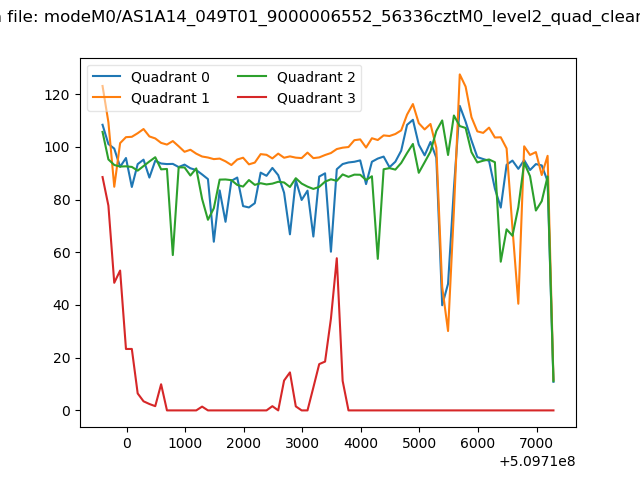 |
|
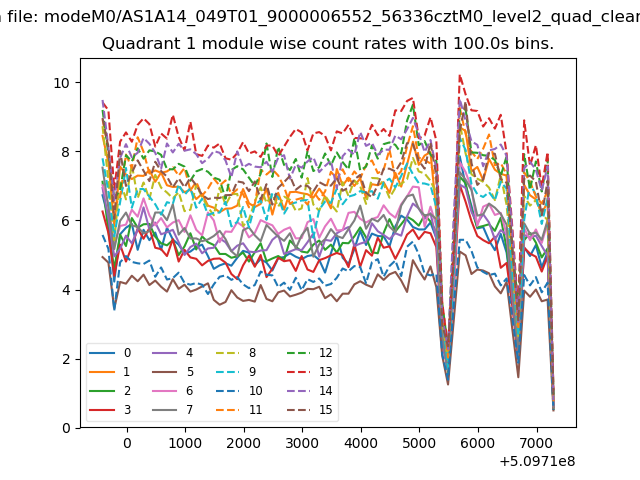
| Module-wise count rates for Quadrant A Data is divided into 100 sec bins |
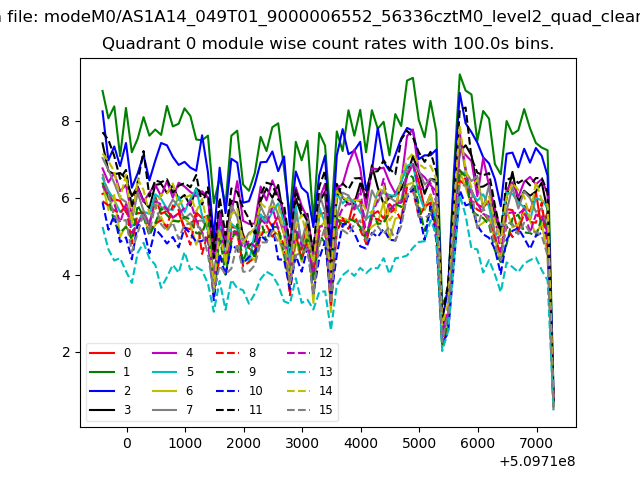 |
 |
| Module-wise count rates for Quadrant B Data is divided into 100 sec bins |
 |
 |
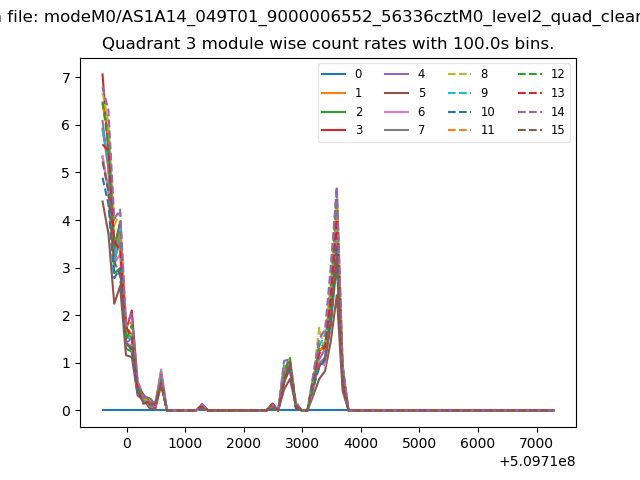
| Module-wise count rates for Quadrant C Data is divided into 100 sec bins |
 |
 |
| Module-wise count rates for Quadrant D Data is divided into 100 sec bins |
 |
 |
| Parameter | Plot |
|---|---|
| CZT HV Monitor |  |
| D_VDD | 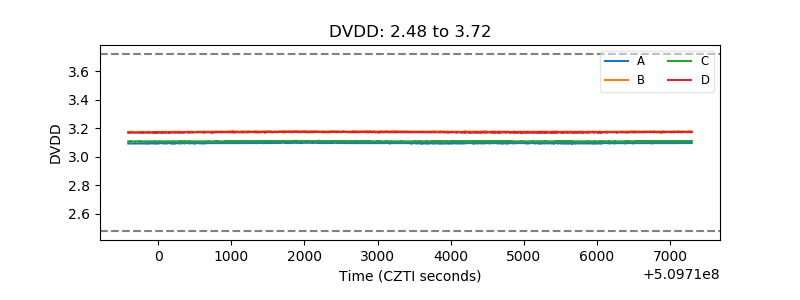 |
| Temperature 1 |  |
| Veto HV Monitor | 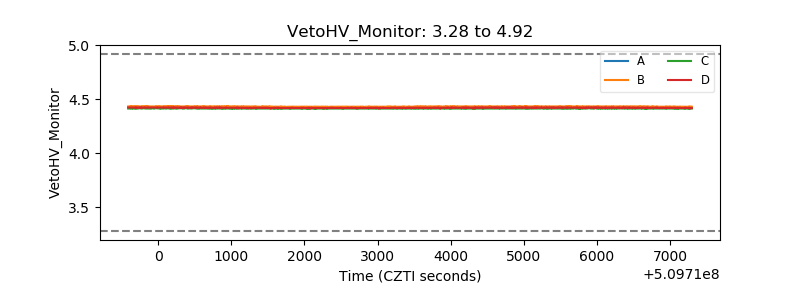 |
| Veto LLD | 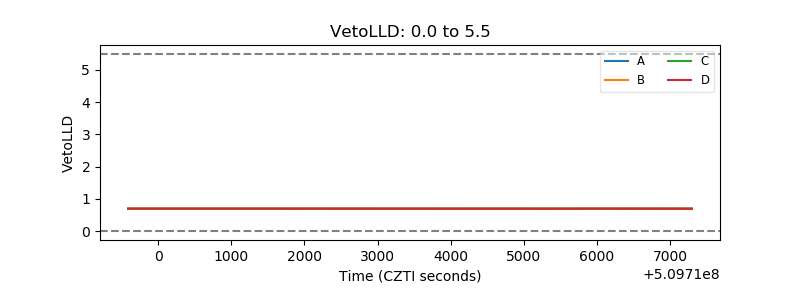 |
| Alpha Counter |  |
| _CPM_Rate | 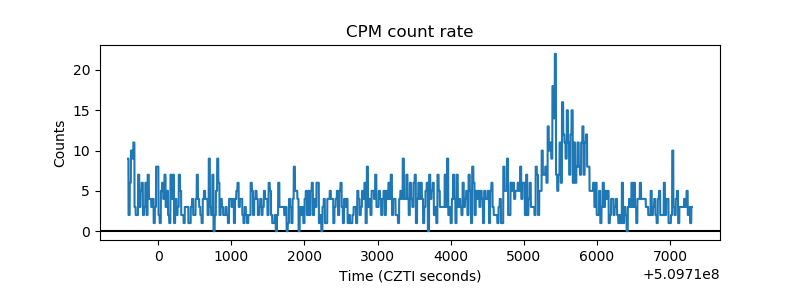 |
| CZT Counter | 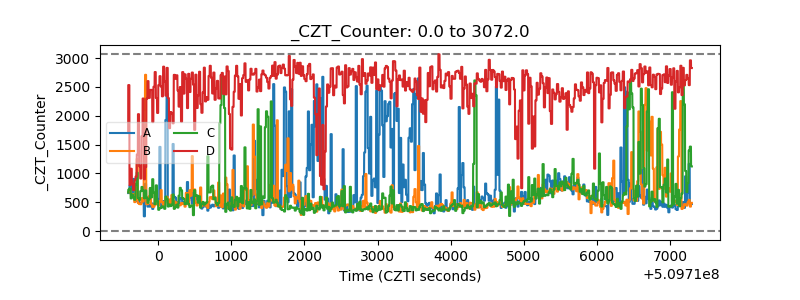 |
| +2.5 Volts monitor |  |
| +5 Volts monitor |  |
| _ROLL_ROT | 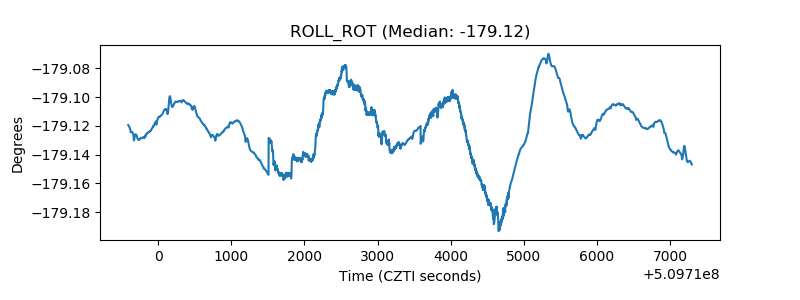 |
| _Roll_DEC | 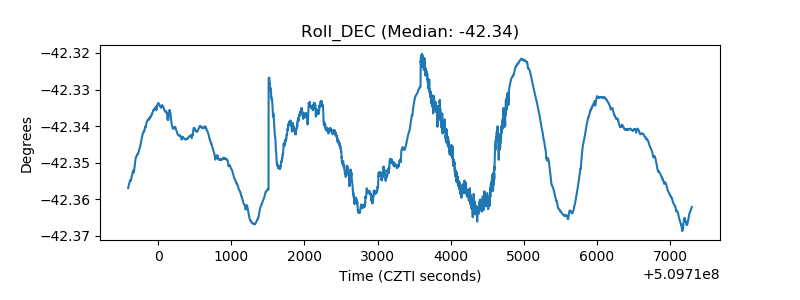 |
| _Roll_RA |  |
| Veto Counter | 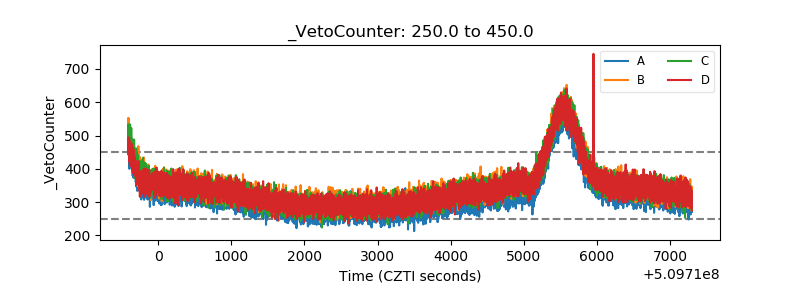 |