| Param | Original file | Final file |
|---|---|---|
| Filename | modeM0/AS1A14_049T01_9000006552_56337cztM0_level2.fits | modeM0/AS1A14_049T01_9000006552_56337cztM0_level2_quad_clean.evt |
| Size (bytes) | 846,930,240 | 91,005,120 |
| Size | 807.7 MB | 86.8 MB |
| Events in quadrant A | 5,183,112 | 707,797 |
| Events in quadrant B | 4,835,268 | 765,487 |
| Events in quadrant C | 5,108,164 | 681,199 |
| Events in quadrant D | 15,629,654 | 65,843 |
| Mode SS | |||
|---|---|---|---|
| Quadrant | BADHDUFLAG | Total packets | Discarded packets |
| A | 0 | 154 | 0 |
| B | 0 | 154 | 0 |
| C | 0 | 154 | 0 |
| D | 0 | 154 | 0 |
| Mode M0 | |||
|---|---|---|---|
| Quadrant | BADHDUFLAG | Total packets | Discarded packets |
| A | 0 | 20721 | 0 |
| B | 0 | 19737 | 0 |
| C | 0 | 20531 | 0 |
| D | 0 | 51774 | 0 |
| Quadrant | Total seconds | Saturated seconds | Saturation percentage |
|---|---|---|---|
| A | 7629 | 291 | 3.814392% |
| B | 7630 | 306 | 4.010485% |
| C | 7630 | 308 | 4.036697% |
| D | 7630 | 7630 | 100.000000% |
Noise dominated data is calculated using 1-second bins in cleaned event files. If a bin has >2000 counts, and if more than 50% of those come from <1% of pixels, then it is considered to be noise-dominated and hence unusable.
| Quadrant | # 1 sec bins | Bins with >0 counts | Bins with >2000 counts | High rate bins dominated by noise | Noise dominated (total time) | Noise dominated (detector-on time) | Marked lightcurve |
|---|---|---|---|---|---|---|---|
| A | 7629 | 7629 | 260 | 260 | 3.41% | 3.41% |  |
| B | 7630 | 7630 | 186 | 186 | 2.44% | 2.44% |  |
| C | 7630 | 7630 | 266 | 266 | 3.49% | 3.49% | 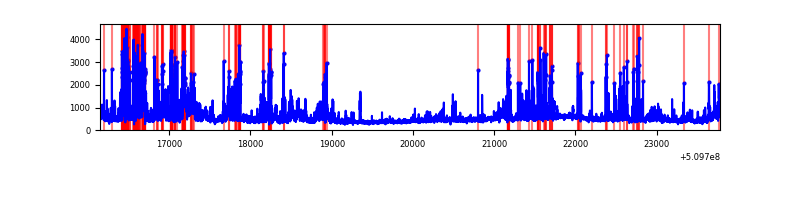 |
| D | 7629 | 7629 | 4790 | 4790 | 62.79% | 62.79% | 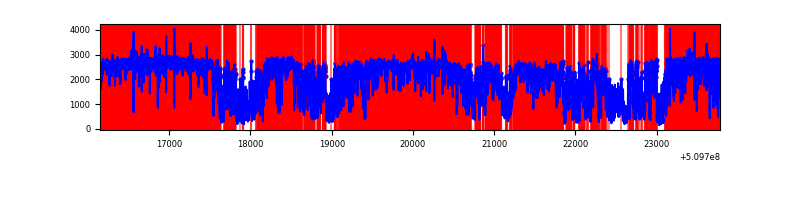 |
Top three noisy pixels from each quadrant. If the there are fewer than three noisy pixels in the level2.evt file, extra rows are filled as -1
| Pixel properties | Quadrant properties | ||||||
|---|---|---|---|---|---|---|---|
| Quadrant | DetID | PixID | Counts | Sigma | Mean | Median | Sigma |
| A | 0 | 143 | 548566 | 2729.95 | 810 | 789 | 200.7 |
| A | 0 | 8 | 399425 | 1986.68 | 810 | 789 | 200.7 |
| A | 3 | 14 | 363281 | 1806.54 | 810 | 789 | 200.7 |
| B | 5 | 185 | 1002361 | 5810.92 | 802 | 772 | 172.4 |
| B | 0 | 231 | 261294 | 1511.47 | 802 | 772 | 172.4 |
| B | 0 | 183 | 122480 | 706.11 | 802 | 772 | 172.4 |
| C | 12 | 254 | 881867 | 4123.4 | 779 | 774 | 213.7 |
| C | 5 | 250 | 309066 | 1442.77 | 779 | 774 | 213.7 |
| C | 15 | 198 | 302846 | 1413.66 | 779 | 774 | 213.7 |
| D | 8 | 129 | 14775302 | 521731.89 | 92 | 87 | 28.3 |
| D | 6 | 239 | 138322 | 4881.26 | 92 | 87 | 28.3 |
| D | 2 | 62 | 109535 | 3864.75 | 92 | 87 | 28.3 |
Histogram calculated using DETX and DETY for each event in the final _common_clean file
| Quadrant A |  |
 |
Quadrant B |
|---|---|---|---|
| Quadrant D | 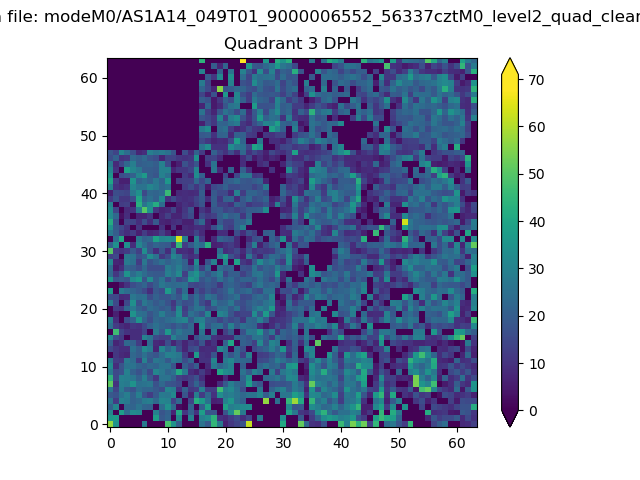 |
 |
Quadrant C |
| Plot type | Count rate plots | Images |
|---|---|---|
| Comparison with Poisson distribution Blue bars denote a histogram of data divided into 1 sec bins. Red curve is a Poisson curve with rate = median count rate of data. |
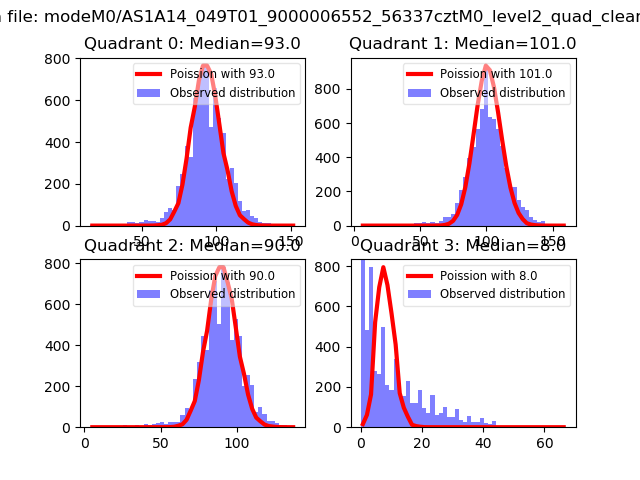 |
 |
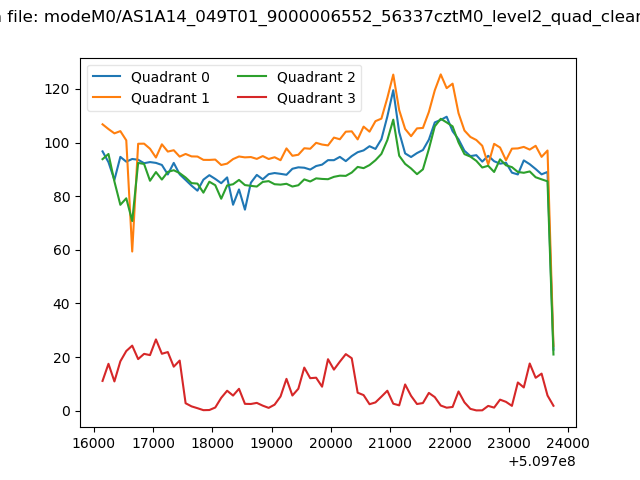
| Quadrant-wise count rates Data is divided into 100 sec bins |
 |
|
| Module-wise count rates for Quadrant A Data is divided into 100 sec bins |
 |
 |
| Module-wise count rates for Quadrant B Data is divided into 100 sec bins |
 |
 |
| Module-wise count rates for Quadrant C Data is divided into 100 sec bins |
 |
 |
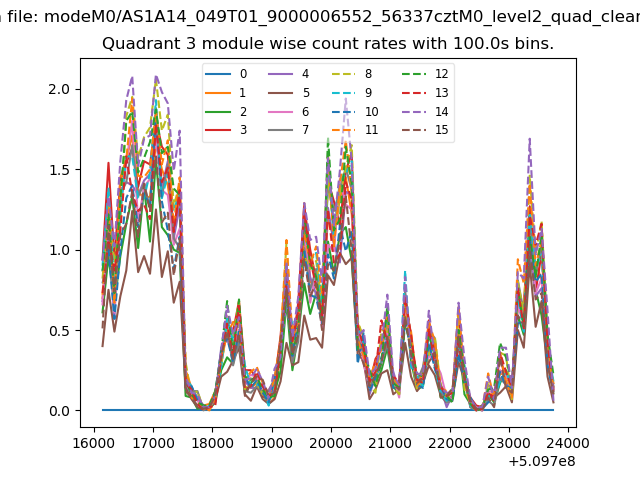
| Module-wise count rates for Quadrant D Data is divided into 100 sec bins |
 |
 |
| Parameter | Plot |
|---|---|
| CZT HV Monitor | 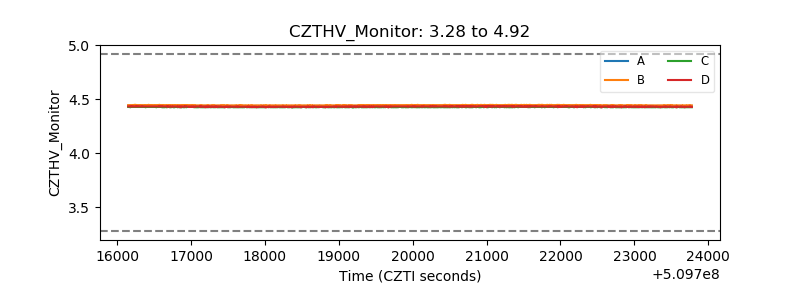 |
| D_VDD |  |
| Temperature 1 |  |
| Veto HV Monitor | 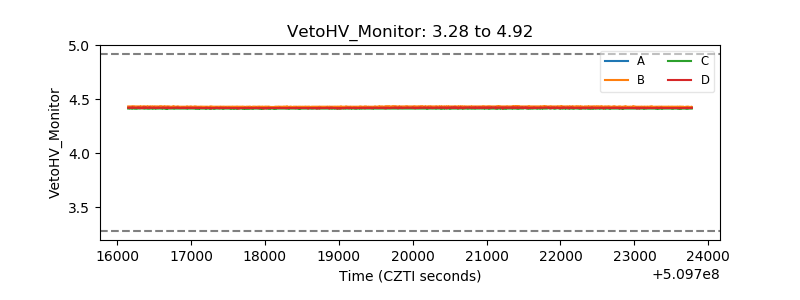 |
| Veto LLD | 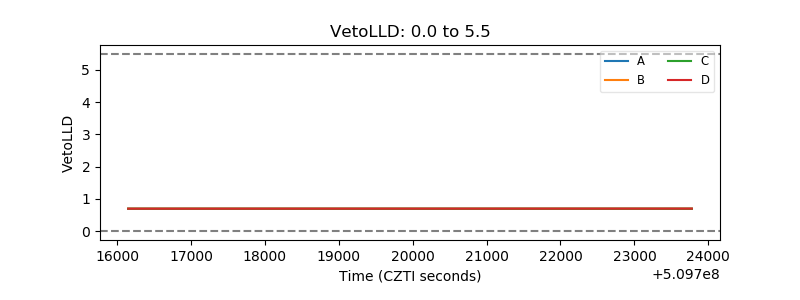 |
| Alpha Counter | 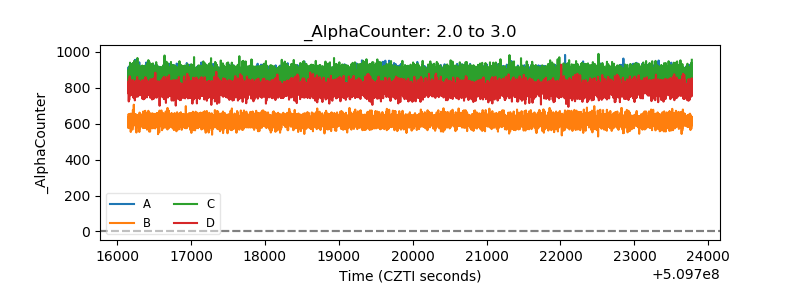 |
| _CPM_Rate | 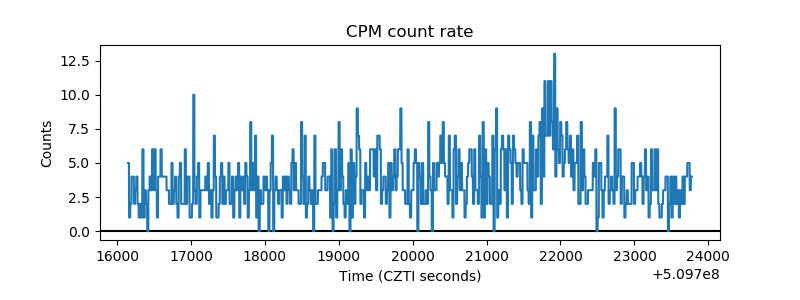 |
| CZT Counter |  |
| +2.5 Volts monitor |  |
| +5 Volts monitor | 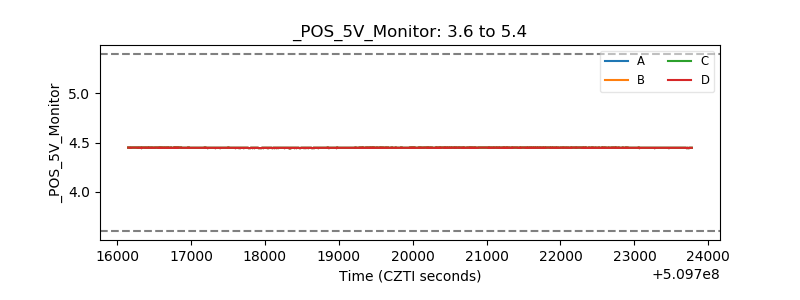 |
| _ROLL_ROT | 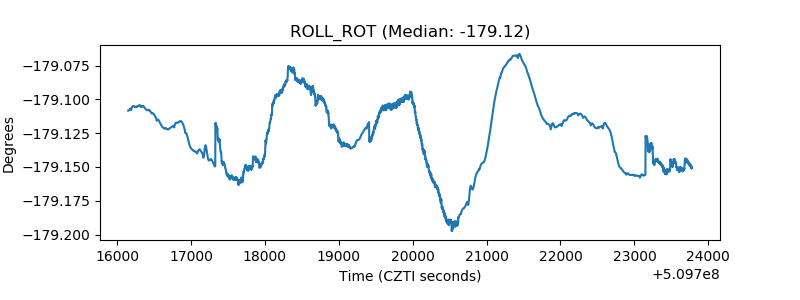 |
| _Roll_DEC | 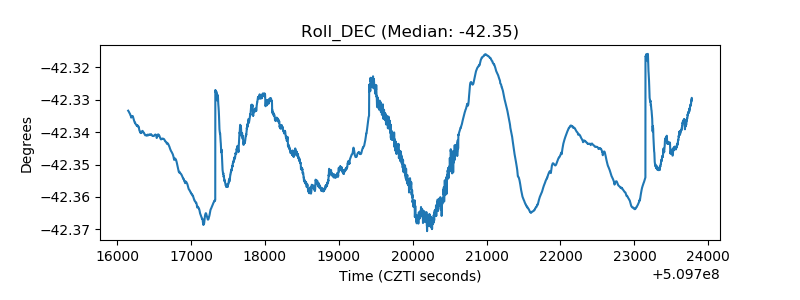 |
| _Roll_RA |  |
| Veto Counter | 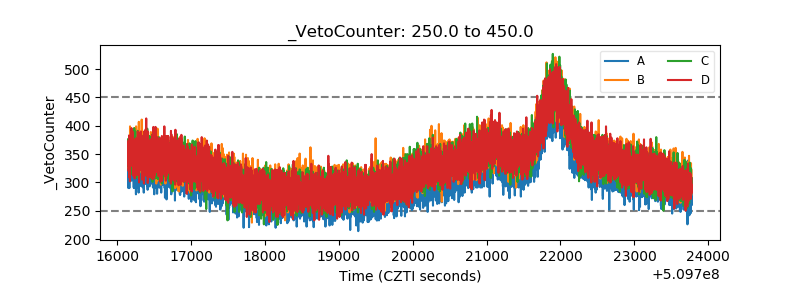 |