| Param | Original file | Final file |
|---|---|---|
| Filename | modeM0/AS1A14_049T01_9000006552_56338cztM0_level2.fits | modeM0/AS1A14_049T01_9000006552_56338cztM0_level2_quad_clean.evt |
| Size (bytes) | 724,374,720 | 93,680,640 |
| Size | 690.8 MB | 89.3 MB |
| Events in quadrant A | 5,107,303 | 671,106 |
| Events in quadrant B | 4,734,500 | 686,033 |
| Events in quadrant C | 4,869,693 | 628,863 |
| Events in quadrant D | 11,541,019 | 346,091 |
| Mode SS | |||
|---|---|---|---|
| Quadrant | BADHDUFLAG | Total packets | Discarded packets |
| A | 0 | 146 | 0 |
| B | 0 | 146 | 0 |
| C | 0 | 146 | 0 |
| D | 0 | 146 | 0 |
| Mode M0 | |||
|---|---|---|---|
| Quadrant | BADHDUFLAG | Total packets | Discarded packets |
| A | 0 | 20198 | 0 |
| B | 0 | 19229 | 0 |
| C | 0 | 19580 | 0 |
| D | 0 | 39229 | 3 |
| Quadrant | Total seconds | Saturated seconds | Saturation percentage |
|---|---|---|---|
| A | 7237 | 159 | 2.197043% |
| B | 7237 | 476 | 6.577311% |
| C | 7237 | 360 | 4.974437% |
| D | 7236 | 3429 | 47.388060% |
Noise dominated data is calculated using 1-second bins in cleaned event files. If a bin has >2000 counts, and if more than 50% of those come from <1% of pixels, then it is considered to be noise-dominated and hence unusable.
| Quadrant | # 1 sec bins | Bins with >0 counts | Bins with >2000 counts | High rate bins dominated by noise | Noise dominated (total time) | Noise dominated (detector-on time) | Marked lightcurve |
|---|---|---|---|---|---|---|---|
| A | 7237 | 7237 | 131 | 131 | 1.81% | 1.81% |  |
| B | 7237 | 7237 | 292 | 292 | 4.03% | 4.03% | 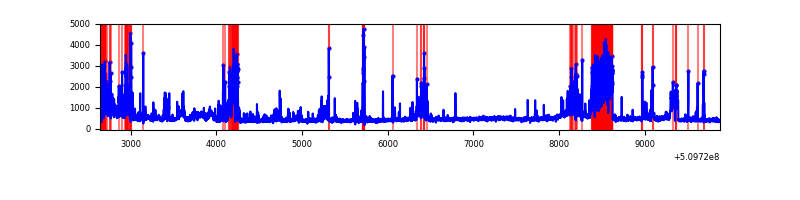 |
| C | 7237 | 7237 | 304 | 304 | 4.20% | 4.20% | 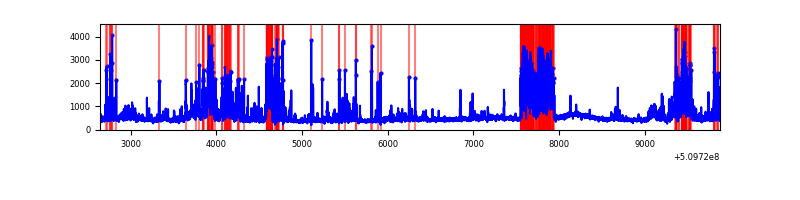 |
| D | 7236 | 7236 | 2805 | 2805 | 38.76% | 38.76% |  |
Top three noisy pixels from each quadrant. If the there are fewer than three noisy pixels in the level2.evt file, extra rows are filled as -1
| Pixel properties | Quadrant properties | ||||||
|---|---|---|---|---|---|---|---|
| Quadrant | DetID | PixID | Counts | Sigma | Mean | Median | Sigma |
| A | 4 | 95 | 573609 | 2953.4 | 771 | 752 | 194.0 |
| A | 3 | 14 | 520951 | 2681.92 | 771 | 752 | 194.0 |
| A | 3 | 45 | 169465 | 869.81 | 771 | 752 | 194.0 |
| B | 5 | 185 | 595836 | 3684.3 | 748 | 721 | 161.5 |
| B | 0 | 171 | 497248 | 3073.95 | 748 | 721 | 161.5 |
| B | 0 | 231 | 227958 | 1406.8 | 748 | 721 | 161.5 |
| C | 12 | 254 | 570473 | 2821.32 | 736 | 730 | 201.9 |
| C | 15 | 158 | 510828 | 2525.97 | 736 | 730 | 201.9 |
| C | 12 | 252 | 331734 | 1639.11 | 736 | 730 | 201.9 |
| D | 8 | 129 | 8388872 | 56752.07 | 517 | 494 | 147.8 |
| D | 6 | 239 | 191054 | 1289.24 | 517 | 494 | 147.8 |
| D | 2 | 249 | 179693 | 1212.38 | 517 | 494 | 147.8 |
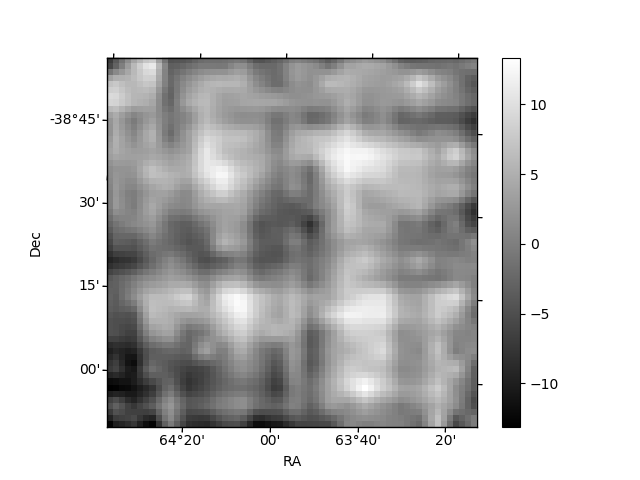
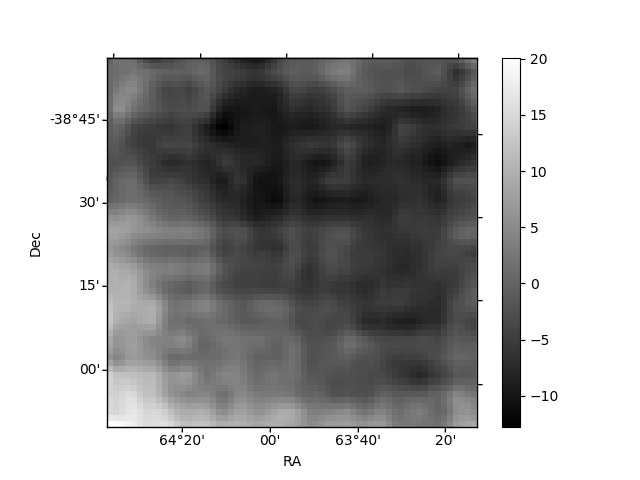
Histogram calculated using DETX and DETY for each event in the final _common_clean file
| Quadrant A | 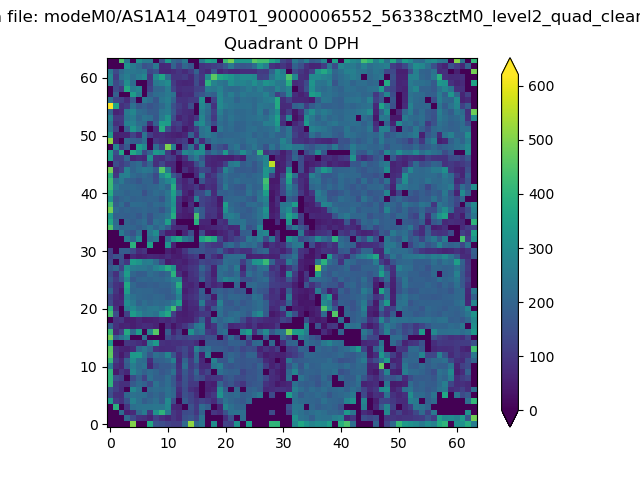 |
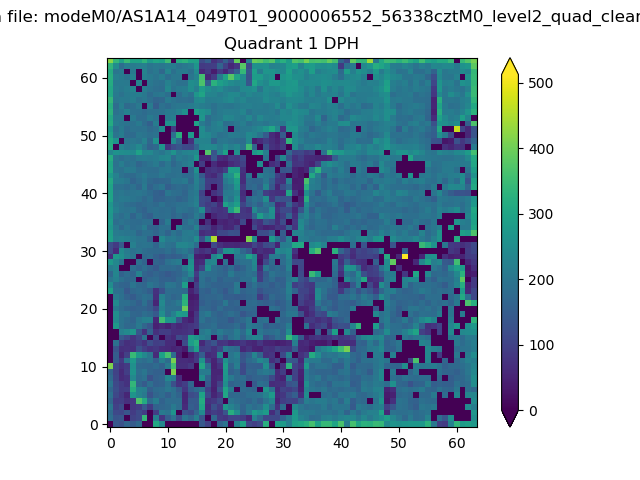 |
Quadrant B |
|---|---|---|---|
| Quadrant D | 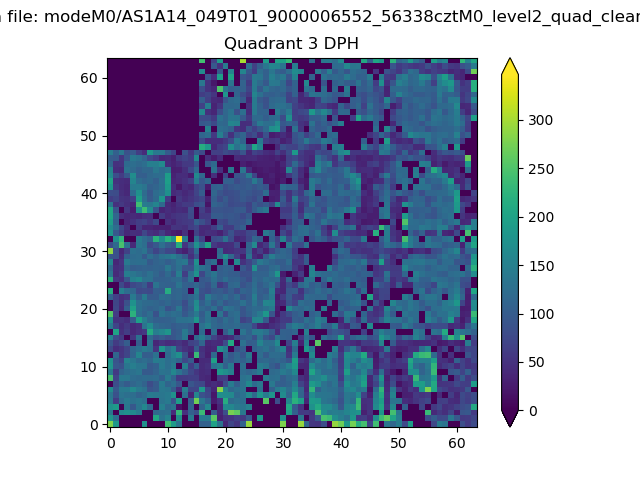 |
 |
Quadrant C |
| Plot type | Count rate plots | Images |
|---|---|---|
| Comparison with Poisson distribution Blue bars denote a histogram of data divided into 1 sec bins. Red curve is a Poisson curve with rate = median count rate of data. |
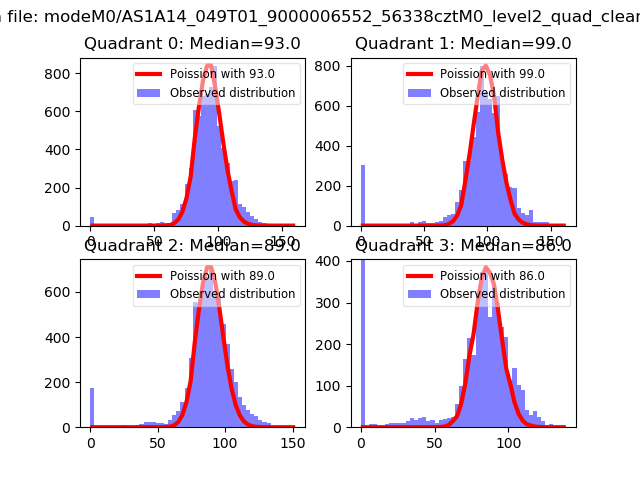 |
 |
| Quadrant-wise count rates Data is divided into 100 sec bins |
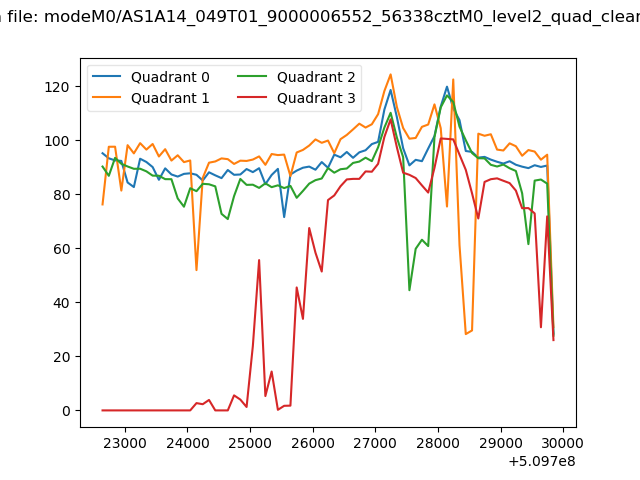 |
|
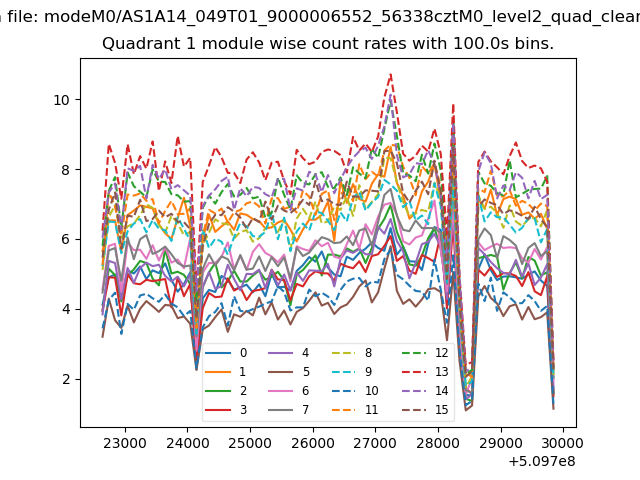
| Module-wise count rates for Quadrant A Data is divided into 100 sec bins |
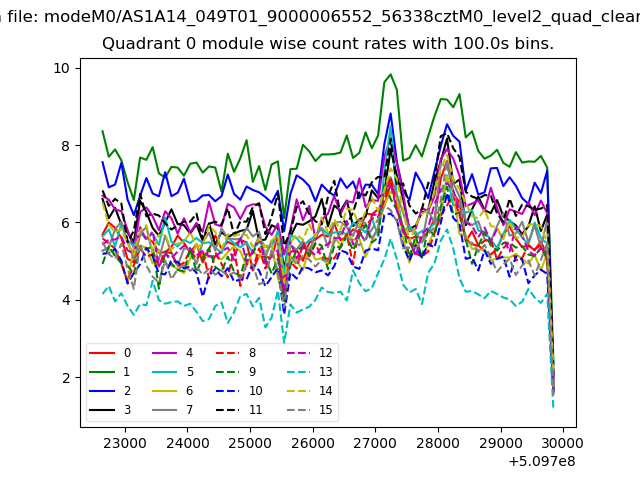 |
 |
| Module-wise count rates for Quadrant B Data is divided into 100 sec bins |
 |
 |
| Module-wise count rates for Quadrant C Data is divided into 100 sec bins |
 |
 |
| Module-wise count rates for Quadrant D Data is divided into 100 sec bins |
 |
 |
| Parameter | Plot |
|---|---|
| CZT HV Monitor |  |
| D_VDD | 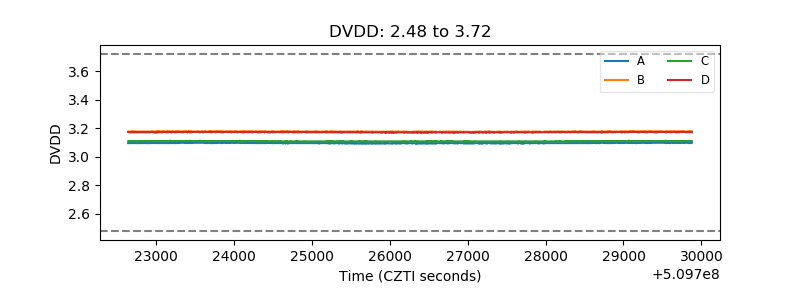 |
| Temperature 1 |  |
| Veto HV Monitor | 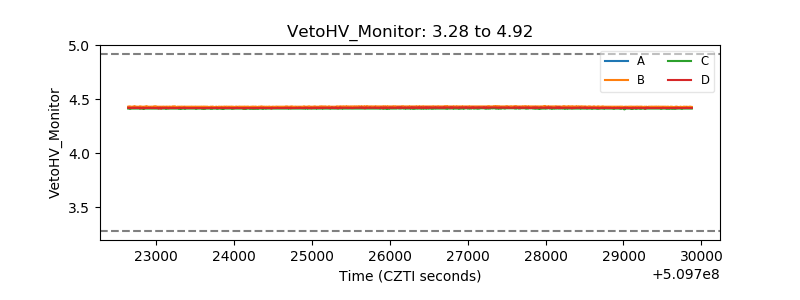 |
| Veto LLD | 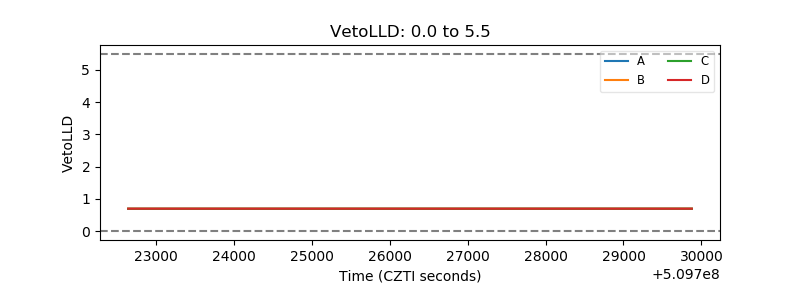 |
| Alpha Counter |  |
| _CPM_Rate | 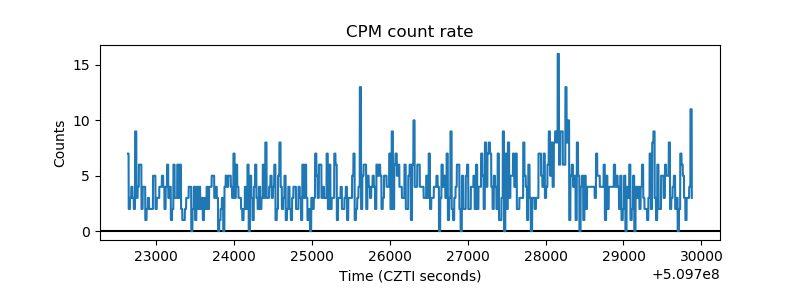 |
| CZT Counter | 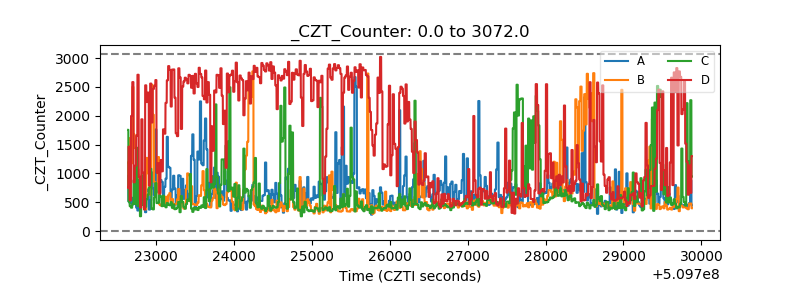 |
| +2.5 Volts monitor |  |
| +5 Volts monitor |  |
| _ROLL_ROT | 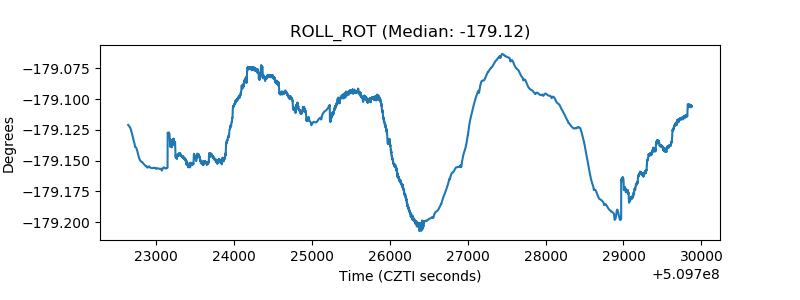 |
| _Roll_DEC | 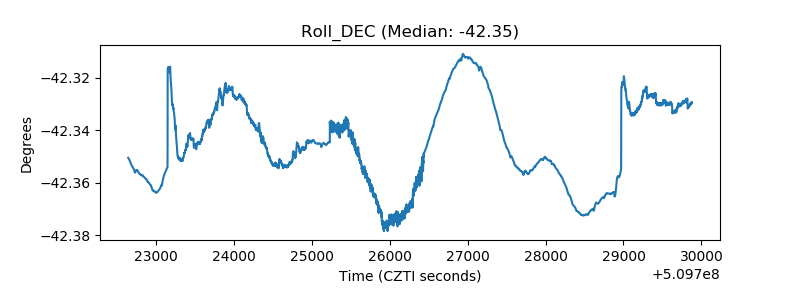 |
| _Roll_RA |  |
| Veto Counter | 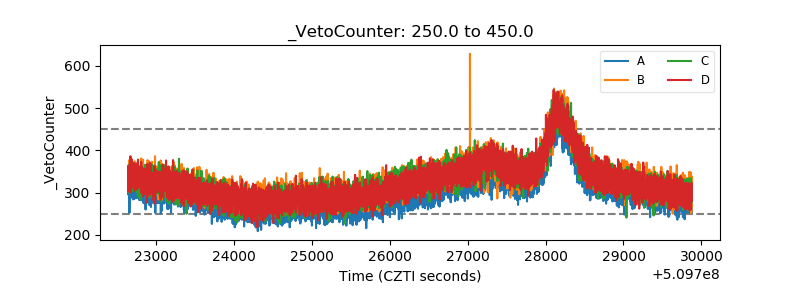 |