| Param | Original file | Final file |
|---|---|---|
| Filename | modeM0/AS1A14_049T01_9000006552_56342cztM0_level2.fits | modeM0/AS1A14_049T01_9000006552_56342cztM0_level2_quad_clean.evt |
| Size (bytes) | 739,506,240 | 87,148,800 |
| Size | 705.2 MB | 83.1 MB |
| Events in quadrant A | 5,905,429 | 585,915 |
| Events in quadrant B | 3,790,730 | 664,959 |
| Events in quadrant C | 6,243,809 | 547,434 |
| Events in quadrant D | 10,907,707 | 366,259 |
| Mode SS | |||
|---|---|---|---|
| Quadrant | BADHDUFLAG | Total packets | Discarded packets |
| A | 0 | 138 | 0 |
| B | 0 | 140 | 0 |
| C | 0 | 140 | 0 |
| D | 0 | 140 | 0 |
| Mode M9 | |||
|---|---|---|---|
| Quadrant | BADHDUFLAG | Total packets | Discarded packets |
| A | 0 | 14 | 0 |
| B | 0 | 15 | 0 |
| C | 0 | 15 | 0 |
| D | 0 | 15 | 0 |
| Mode M0 | |||
|---|---|---|---|
| Quadrant | BADHDUFLAG | Total packets | Discarded packets |
| A | 0 | 22338 | 2 |
| B | 0 | 16192 | 2 |
| C | 0 | 23377 | 2 |
| D | 0 | 37058 | 2 |
| Quadrant | Total seconds | Saturated seconds | Saturation percentage |
|---|---|---|---|
| A | 6799 | 595 | 8.751287% |
| B | 6799 | 227 | 3.338726% |
| C | 6799 | 834 | 12.266510% |
| D | 6799 | 2691 | 39.579350% |
Noise dominated data is calculated using 1-second bins in cleaned event files. If a bin has >2000 counts, and if more than 50% of those come from <1% of pixels, then it is considered to be noise-dominated and hence unusable.
| Quadrant | # 1 sec bins | Bins with >0 counts | Bins with >2000 counts | High rate bins dominated by noise | Noise dominated (total time) | Noise dominated (detector-on time) | Marked lightcurve |
|---|---|---|---|---|---|---|---|
| A | 7649 | 6800 | 616 | 616 | 8.05% | 9.06% | 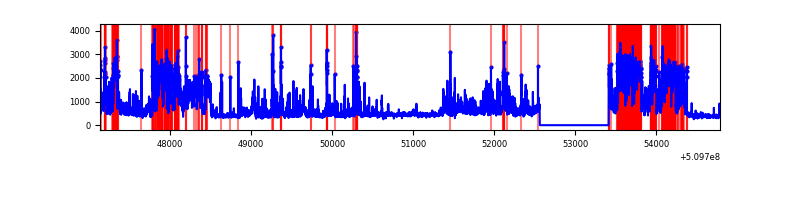 |
| B | 7649 | 6800 | 130 | 130 | 1.70% | 1.91% |  |
| C | 7649 | 6800 | 666 | 666 | 8.71% | 9.79% | 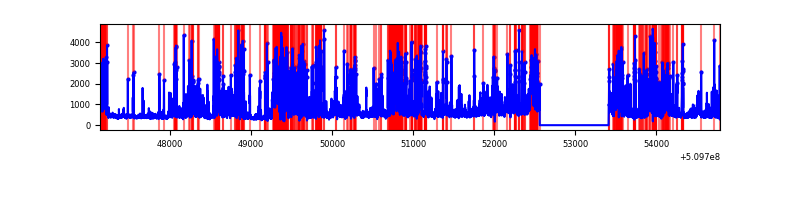 |
| D | 7649 | 6799 | 2518 | 2518 | 32.92% | 37.03% | 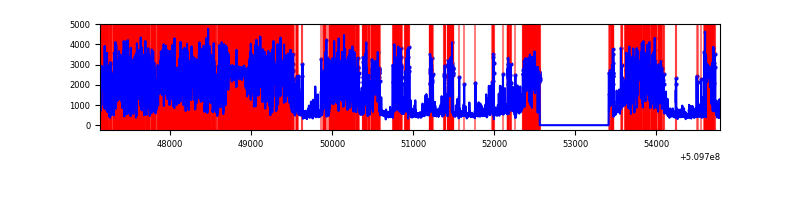 |
Top three noisy pixels from each quadrant. If the there are fewer than three noisy pixels in the level2.evt file, extra rows are filled as -1
| Pixel properties | Quadrant properties | ||||||
|---|---|---|---|---|---|---|---|
| Quadrant | DetID | PixID | Counts | Sigma | Mean | Median | Sigma |
| A | 4 | 95 | 2092834 | 12006.71 | 694 | 677 | 174.2 |
| A | 1 | 191 | 312238 | 1788.02 | 694 | 677 | 174.2 |
| A | 3 | 78 | 143984 | 822.43 | 694 | 677 | 174.2 |
| B | 5 | 185 | 495060 | 3300.19 | 703 | 678 | 149.8 |
| B | 0 | 231 | 89601 | 593.6 | 703 | 678 | 149.8 |
| B | 0 | 171 | 88499 | 586.24 | 703 | 678 | 149.8 |
| C | 5 | 250 | 1398314 | 7794.5 | 652 | 647 | 179.3 |
| C | 12 | 254 | 981993 | 5472.77 | 652 | 647 | 179.3 |
| C | 15 | 230 | 507679 | 2827.61 | 652 | 647 | 179.3 |
| D | 8 | 129 | 7298102 | 46291.35 | 545 | 520 | 157.6 |
| D | 6 | 239 | 980694 | 6217.62 | 545 | 520 | 157.6 |
| D | 2 | 249 | 116907 | 738.29 | 545 | 520 | 157.6 |
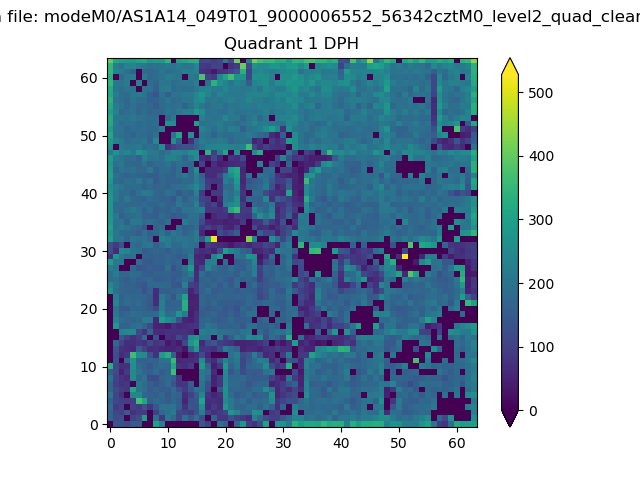
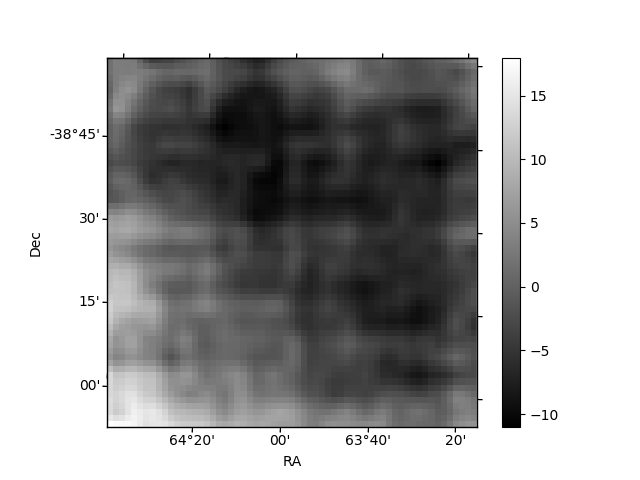
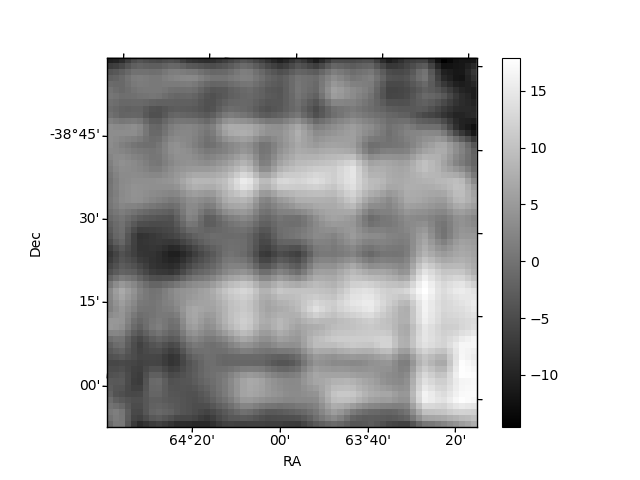
Histogram calculated using DETX and DETY for each event in the final _common_clean file
| Quadrant A | 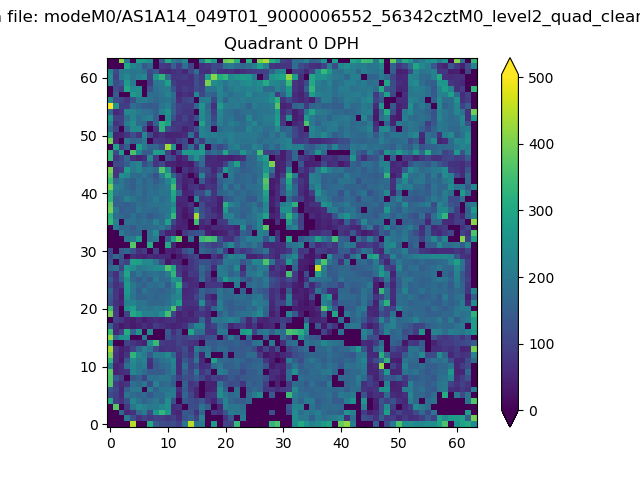 |
 |
Quadrant B |
|---|---|---|---|
| Quadrant D |  |
 |
Quadrant C |
| Plot type | Count rate plots | Images |
|---|---|---|
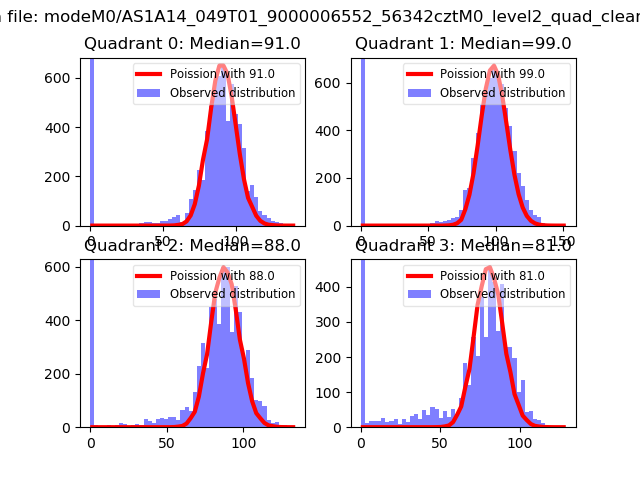
| Comparison with Poisson distribution Blue bars denote a histogram of data divided into 1 sec bins. Red curve is a Poisson curve with rate = median count rate of data. |
 |
 |
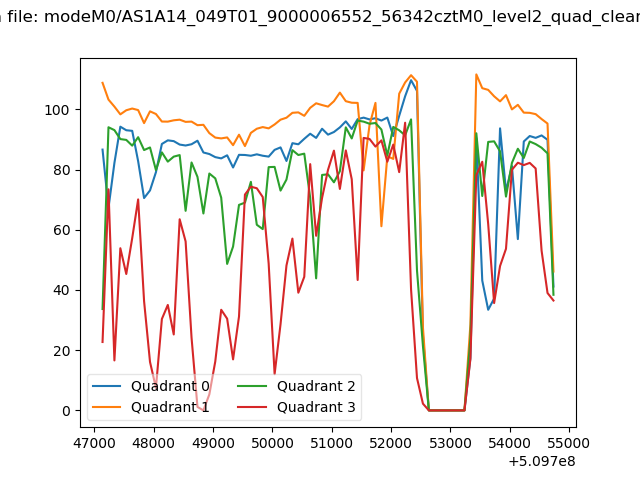
| Quadrant-wise count rates Data is divided into 100 sec bins |
 |
|
| Module-wise count rates for Quadrant A Data is divided into 100 sec bins |
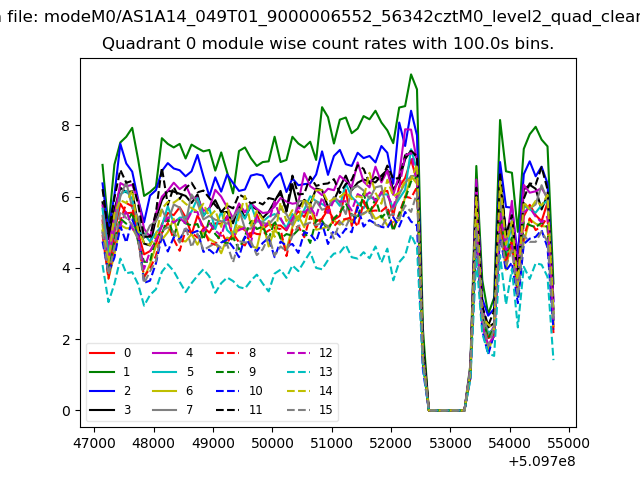 |
 |
| Module-wise count rates for Quadrant B Data is divided into 100 sec bins |
 |
 |
| Module-wise count rates for Quadrant C Data is divided into 100 sec bins |
 |
 |
| Module-wise count rates for Quadrant D Data is divided into 100 sec bins |
 |
 |
| Parameter | Plot |
|---|---|
| CZT HV Monitor | 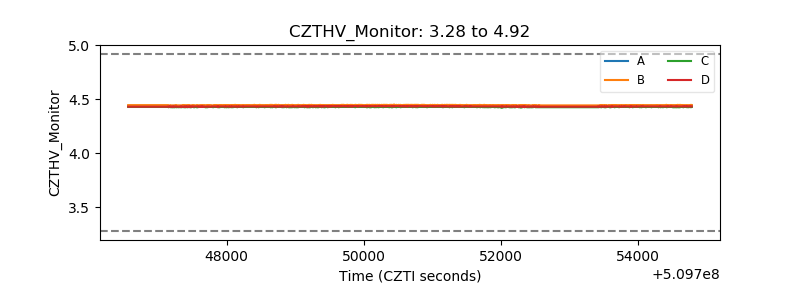 |
| D_VDD |  |
| Temperature 1 | 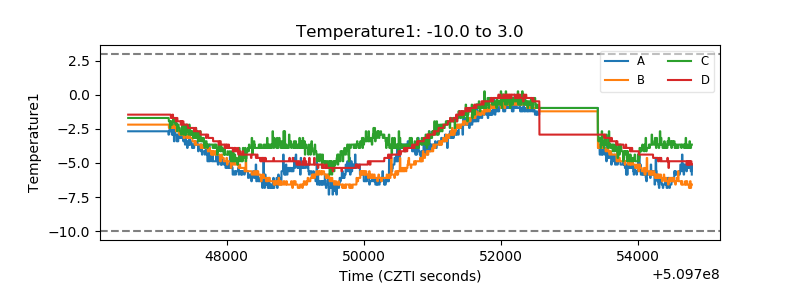 |
| Veto HV Monitor | 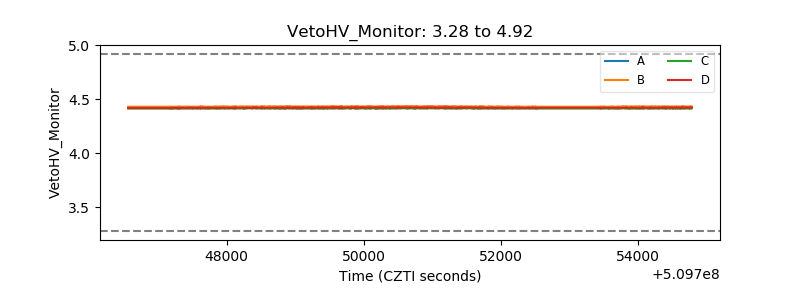 |
| Veto LLD | 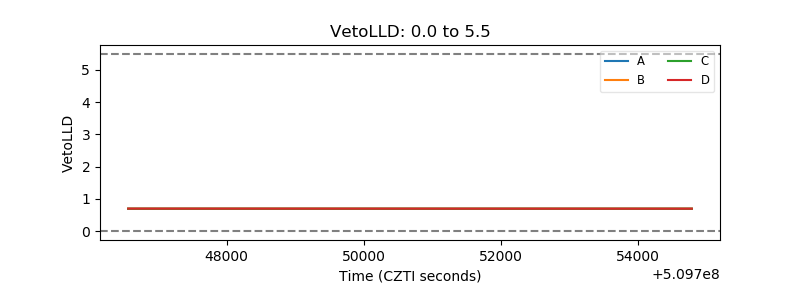 |
| Alpha Counter | 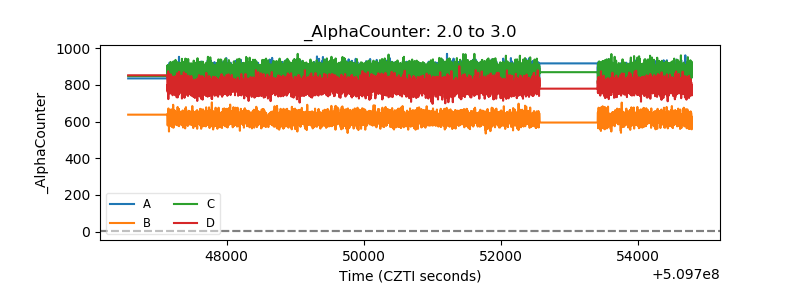 |
| _CPM_Rate |  |
| CZT Counter | 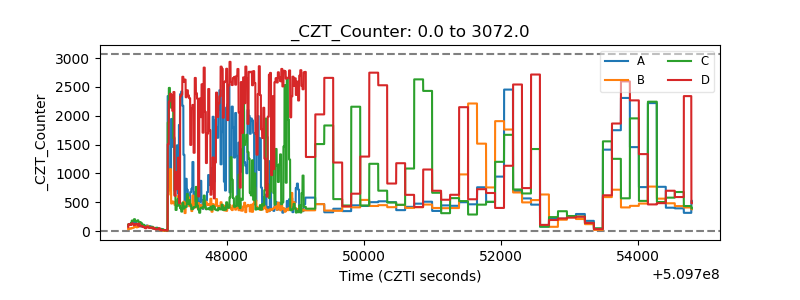 |
| +2.5 Volts monitor | 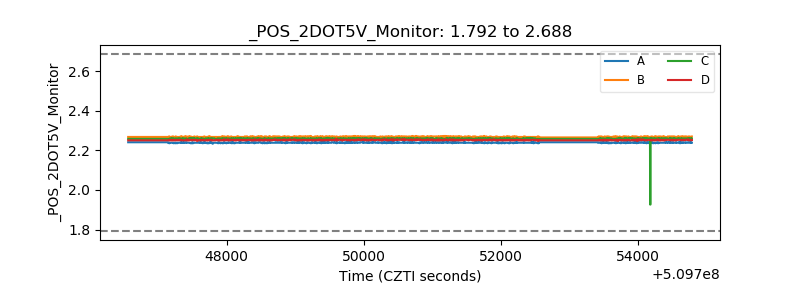 |
| +5 Volts monitor |  |
| _ROLL_ROT |  |
| _Roll_DEC |  |
| _Roll_RA | 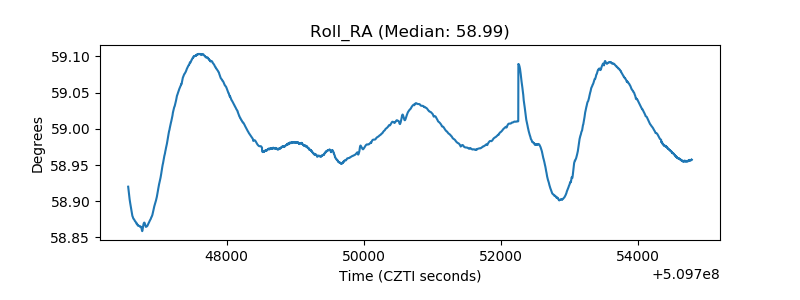 |
| Veto Counter |  |