| Param | Original file | Final file |
|---|---|---|
| Filename | modeM0/AS1A14_049T01_9000006552_56344cztM0_level2.fits | modeM0/AS1A14_049T01_9000006552_56344cztM0_level2_quad_clean.evt |
| Size (bytes) | 677,151,360 | 92,148,480 |
| Size | 645.8 MB | 87.9 MB |
| Events in quadrant A | 4,803,968 | 614,081 |
| Events in quadrant B | 4,248,700 | 680,497 |
| Events in quadrant C | 6,912,099 | 540,073 |
| Events in quadrant D | 8,565,017 | 473,225 |
| Mode SS | |||
|---|---|---|---|
| Quadrant | BADHDUFLAG | Total packets | Discarded packets |
| A | 0 | 142 | 0 |
| B | 0 | 142 | 0 |
| C | 0 | 142 | 0 |
| D | 0 | 142 | 0 |
| Mode M9 | |||
|---|---|---|---|
| Quadrant | BADHDUFLAG | Total packets | Discarded packets |
| A | 0 | 19 | 0 |
| B | 0 | 19 | 0 |
| C | 0 | 19 | 0 |
| D | 0 | 19 | 0 |
| Mode M0 | |||
|---|---|---|---|
| Quadrant | BADHDUFLAG | Total packets | Discarded packets |
| A | 0 | 19346 | 2 |
| B | 0 | 17369 | 2 |
| C | 0 | 25338 | 2 |
| D | 0 | 30213 | 2 |
| Quadrant | Total seconds | Saturated seconds | Saturation percentage |
|---|---|---|---|
| A | 6919 | 508 | 7.342101% |
| B | 6919 | 302 | 4.364793% |
| C | 6919 | 1103 | 15.941610% |
| D | 6919 | 1445 | 20.884521% |
Noise dominated data is calculated using 1-second bins in cleaned event files. If a bin has >2000 counts, and if more than 50% of those come from <1% of pixels, then it is considered to be noise-dominated and hence unusable.
| Quadrant | # 1 sec bins | Bins with >0 counts | Bins with >2000 counts | High rate bins dominated by noise | Noise dominated (total time) | Noise dominated (detector-on time) | Marked lightcurve |
|---|---|---|---|---|---|---|---|
| A | 8739 | 6921 | 480 | 480 | 5.49% | 6.94% |  |
| B | 8739 | 6921 | 150 | 150 | 1.72% | 2.17% |  |
| C | 8739 | 6920 | 911 | 911 | 10.42% | 13.16% | 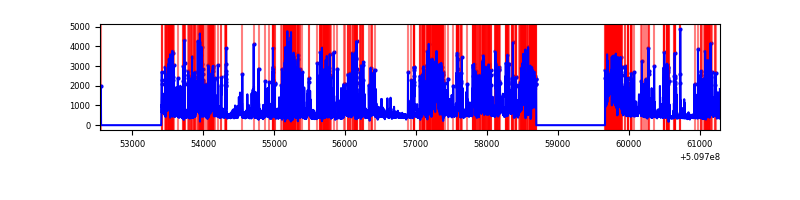 |
| D | 8739 | 6919 | 1346 | 1346 | 15.40% | 19.45% | 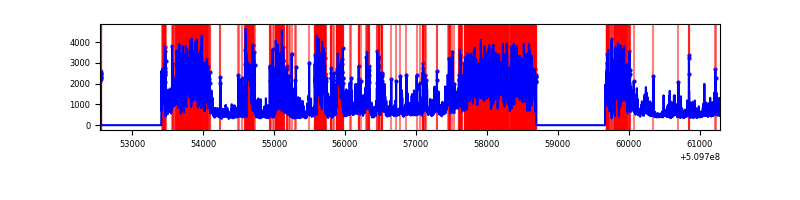 |
Top three noisy pixels from each quadrant. If the there are fewer than three noisy pixels in the level2.evt file, extra rows are filled as -1
| Pixel properties | Quadrant properties | ||||||
|---|---|---|---|---|---|---|---|
| Quadrant | DetID | PixID | Counts | Sigma | Mean | Median | Sigma |
| A | 4 | 95 | 1147660 | 6477.5 | 712 | 698 | 177.1 |
| A | 3 | 78 | 398023 | 2243.9 | 712 | 698 | 177.1 |
| A | 1 | 191 | 131106 | 736.48 | 712 | 698 | 177.1 |
| B | 5 | 172 | 383637 | 2492.97 | 719 | 694 | 153.6 |
| B | 0 | 171 | 338048 | 2196.19 | 719 | 694 | 153.6 |
| B | 5 | 185 | 263567 | 1711.31 | 719 | 694 | 153.6 |
| C | 12 | 254 | 1515798 | 8381.97 | 657 | 651 | 180.8 |
| C | 15 | 230 | 1297409 | 7173.81 | 657 | 651 | 180.8 |
| C | 13 | 3 | 934428 | 5165.76 | 657 | 651 | 180.8 |
| D | 8 | 129 | 3973132 | 21546.78 | 638 | 609 | 184.4 |
| D | 8 | 240 | 659822 | 3575.54 | 638 | 609 | 184.4 |
| D | 6 | 239 | 538517 | 2917.59 | 638 | 609 | 184.4 |
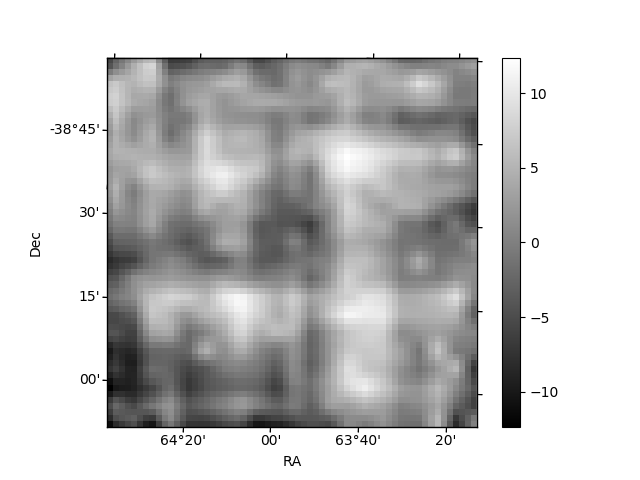
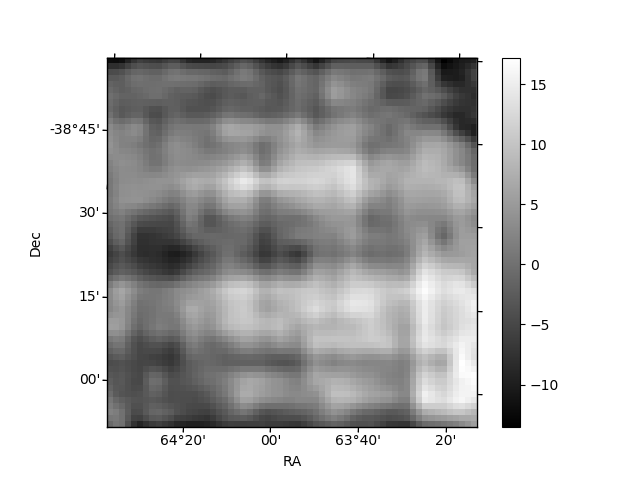
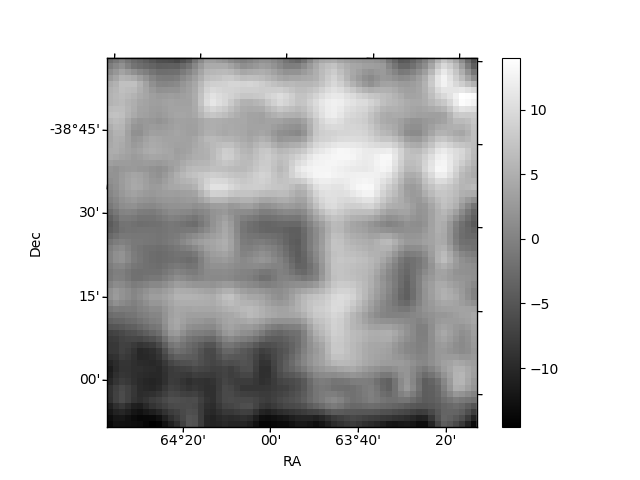
Histogram calculated using DETX and DETY for each event in the final _common_clean file
| Quadrant A |  |
 |
Quadrant B |
|---|---|---|---|
| Quadrant D | 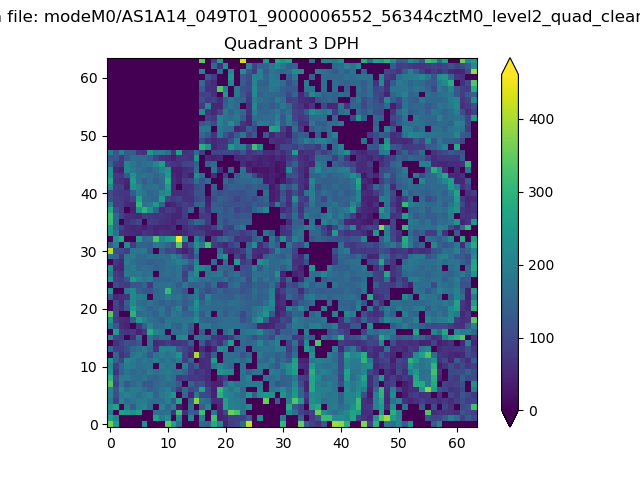 |
 |
Quadrant C |
| Plot type | Count rate plots | Images |
|---|---|---|
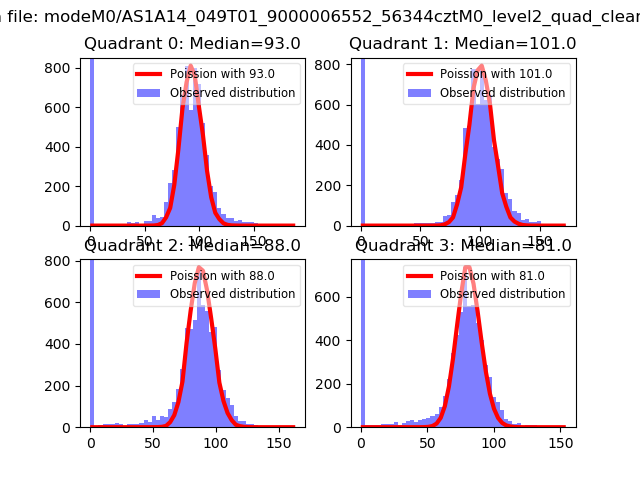
| Comparison with Poisson distribution Blue bars denote a histogram of data divided into 1 sec bins. Red curve is a Poisson curve with rate = median count rate of data. |
 |
 |
| Quadrant-wise count rates Data is divided into 100 sec bins |
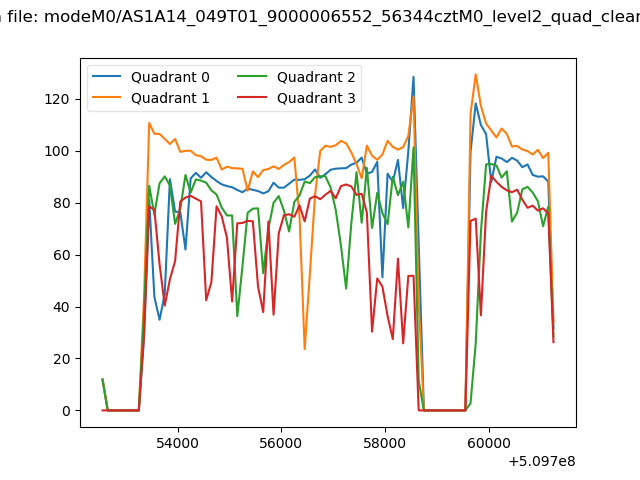 |
|
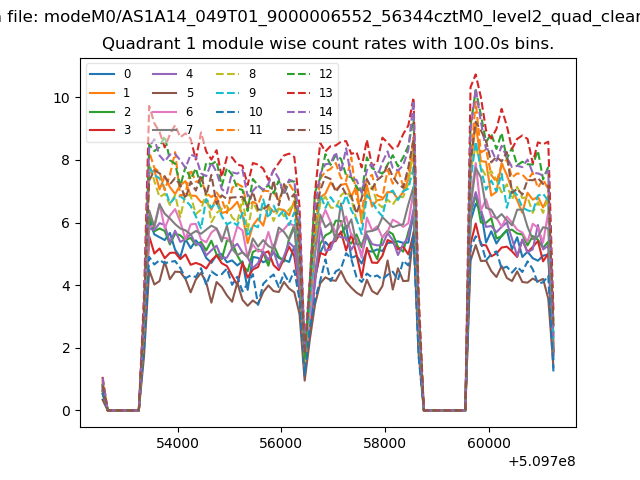
| Module-wise count rates for Quadrant A Data is divided into 100 sec bins |
 |
 |
| Module-wise count rates for Quadrant B Data is divided into 100 sec bins |
 |
 |
| Module-wise count rates for Quadrant C Data is divided into 100 sec bins |
 |
 |
| Module-wise count rates for Quadrant D Data is divided into 100 sec bins |
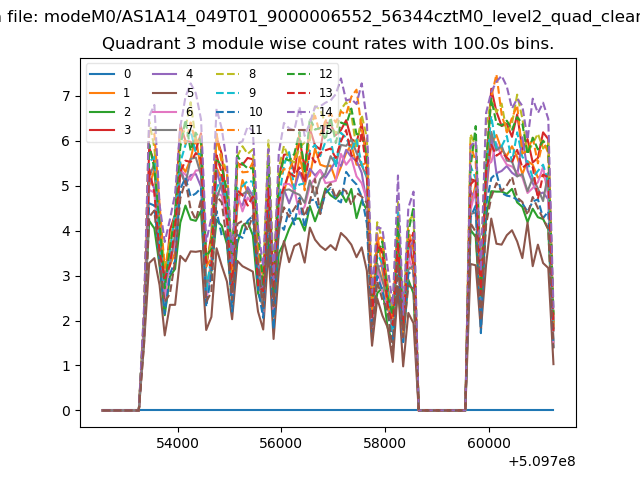 |
 |
| Parameter | Plot |
|---|---|
| CZT HV Monitor | 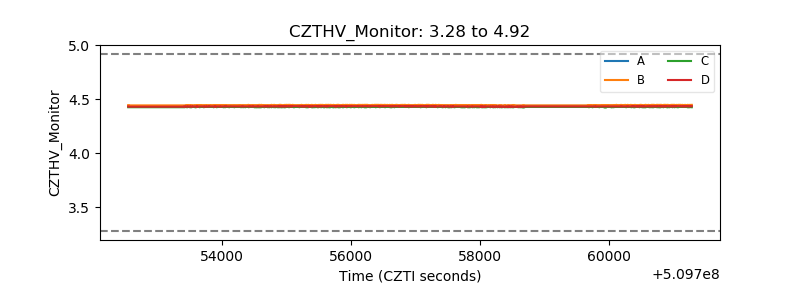 |
| D_VDD |  |
| Temperature 1 | 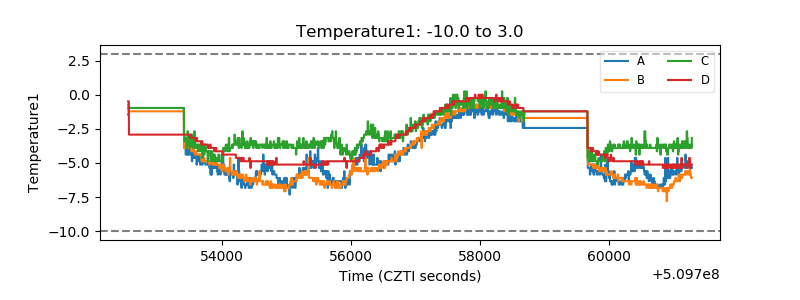 |
| Veto HV Monitor |  |
| Veto LLD | 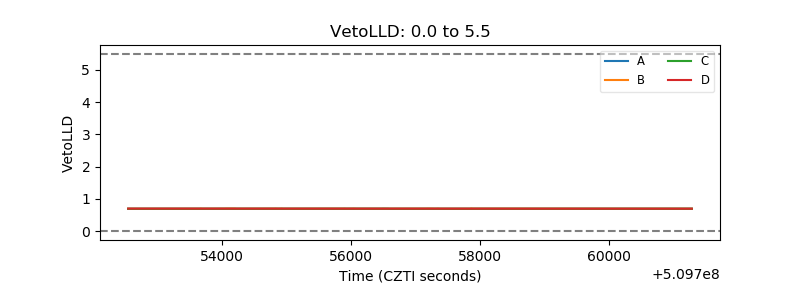 |
| Alpha Counter | 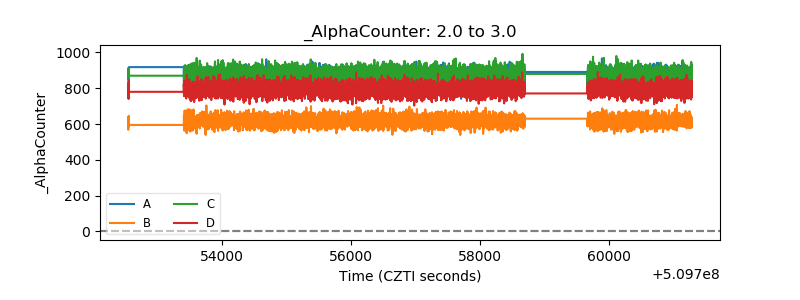 |
| _CPM_Rate | 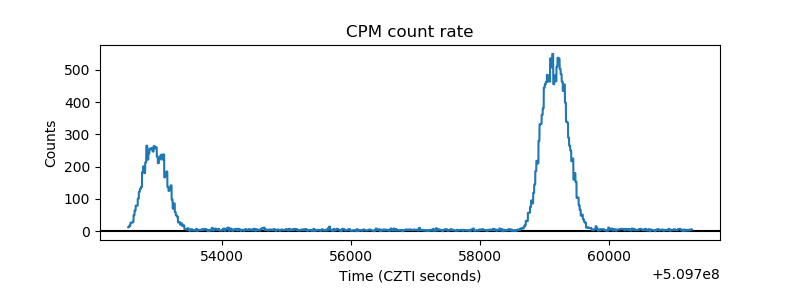 |
| CZT Counter |  |
| +2.5 Volts monitor |  |
| +5 Volts monitor | 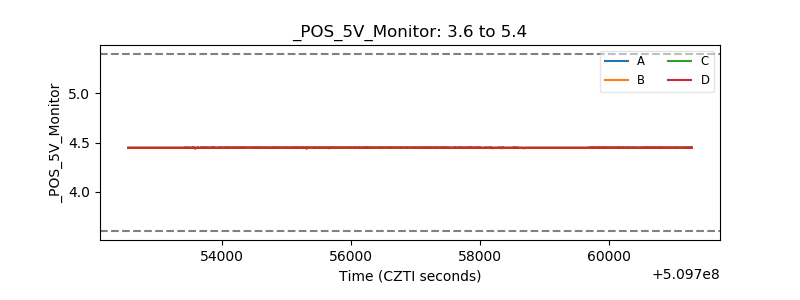 |
| _ROLL_ROT | 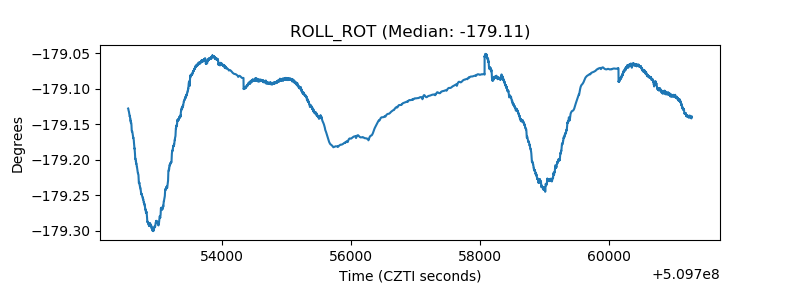 |
| _Roll_DEC | 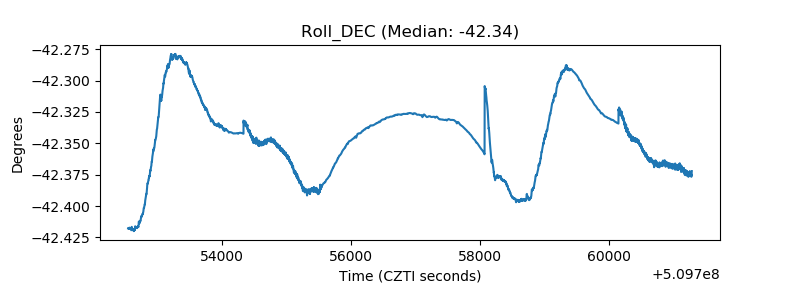 |
| _Roll_RA |  |
| Veto Counter | 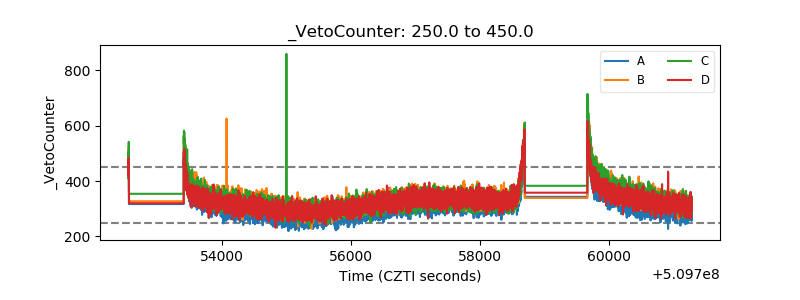 |