| Param | Original file | Final file |
|---|---|---|
| Filename | modeM0/AS1A14_049T01_9000006552_56345cztM0_level2.fits | modeM0/AS1A14_049T01_9000006552_56345cztM0_level2_quad_clean.evt |
| Size (bytes) | 582,868,800 | 95,022,720 |
| Size | 555.9 MB | 90.6 MB |
| Events in quadrant A | 4,241,947 | 635,905 |
| Events in quadrant B | 3,743,464 | 697,670 |
| Events in quadrant C | 6,461,890 | 543,825 |
| Events in quadrant D | 6,605,487 | 529,445 |
| Mode SS | |||
|---|---|---|---|
| Quadrant | BADHDUFLAG | Total packets | Discarded packets |
| A | 0 | 138 | 0 |
| B | 0 | 138 | 0 |
| C | 0 | 138 | 0 |
| D | 0 | 138 | 0 |
| Mode M9 | |||
|---|---|---|---|
| Quadrant | BADHDUFLAG | Total packets | Discarded packets |
| A | 0 | 20 | 0 |
| B | 0 | 21 | 0 |
| C | 0 | 21 | 0 |
| D | 0 | 21 | 0 |
| Mode M0 | |||
|---|---|---|---|
| Quadrant | BADHDUFLAG | Total packets | Discarded packets |
| A | 0 | 17302 | 2 |
| B | 0 | 15858 | 2 |
| C | 0 | 23930 | 2 |
| D | 0 | 24293 | 2 |
| Quadrant | Total seconds | Saturated seconds | Saturation percentage |
|---|---|---|---|
| A | 6748 | 238 | 3.526971% |
| B | 6748 | 170 | 2.519265% |
| C | 6748 | 962 | 14.256076% |
| D | 6748 | 712 | 10.551274% |
Noise dominated data is calculated using 1-second bins in cleaned event files. If a bin has >2000 counts, and if more than 50% of those come from <1% of pixels, then it is considered to be noise-dominated and hence unusable.
| Quadrant | # 1 sec bins | Bins with >0 counts | Bins with >2000 counts | High rate bins dominated by noise | Noise dominated (total time) | Noise dominated (detector-on time) | Marked lightcurve |
|---|---|---|---|---|---|---|---|
| A | 7798 | 6749 | 140 | 140 | 1.80% | 2.07% |  |
| B | 7798 | 6749 | 76 | 76 | 0.97% | 1.13% |  |
| C | 7798 | 6749 | 748 | 748 | 9.59% | 11.08% | 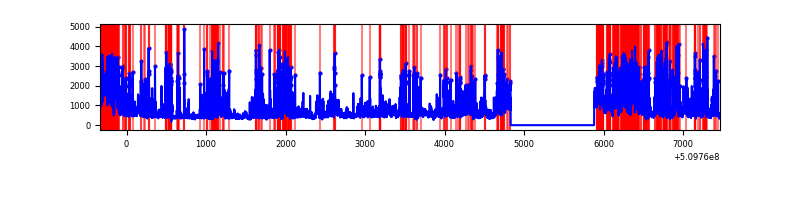 |
| D | 7798 | 6749 | 611 | 611 | 7.84% | 9.05% |  |
Top three noisy pixels from each quadrant. If the there are fewer than three noisy pixels in the level2.evt file, extra rows are filled as -1
| Pixel properties | Quadrant properties | ||||||
|---|---|---|---|---|---|---|---|
| Quadrant | DetID | PixID | Counts | Sigma | Mean | Median | Sigma |
| A | 3 | 78 | 673256 | 3787.68 | 718 | 701 | 177.6 |
| A | 1 | 191 | 238672 | 1340.2 | 718 | 701 | 177.6 |
| A | 15 | 33 | 97388 | 544.52 | 718 | 701 | 177.6 |
| B | 5 | 185 | 241310 | 1559.68 | 725 | 697 | 154.3 |
| B | 5 | 172 | 204685 | 1322.28 | 725 | 697 | 154.3 |
| B | 0 | 213 | 89636 | 576.51 | 725 | 697 | 154.3 |
| C | 12 | 254 | 1584211 | 8719.33 | 662 | 656 | 181.6 |
| C | 15 | 230 | 1553496 | 8550.21 | 662 | 656 | 181.6 |
| C | 12 | 252 | 300223 | 1649.47 | 662 | 656 | 181.6 |
| D | 8 | 129 | 1167743 | 6022.13 | 677 | 644 | 193.8 |
| D | 6 | 239 | 781019 | 4026.67 | 677 | 644 | 193.8 |
| D | 2 | 249 | 761036 | 3923.56 | 677 | 644 | 193.8 |
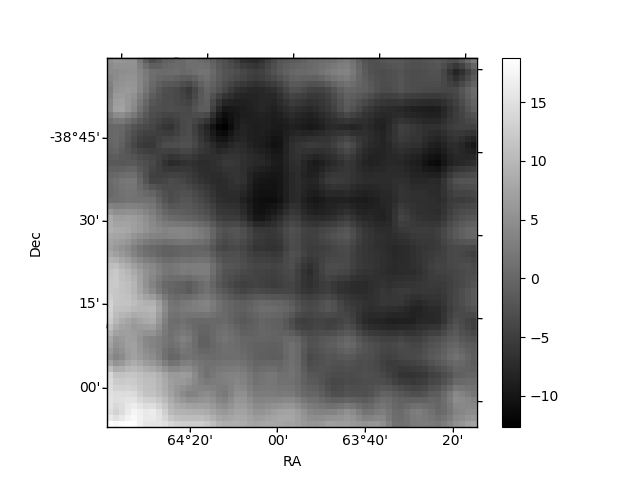
Histogram calculated using DETX and DETY for each event in the final _common_clean file
| Quadrant A | 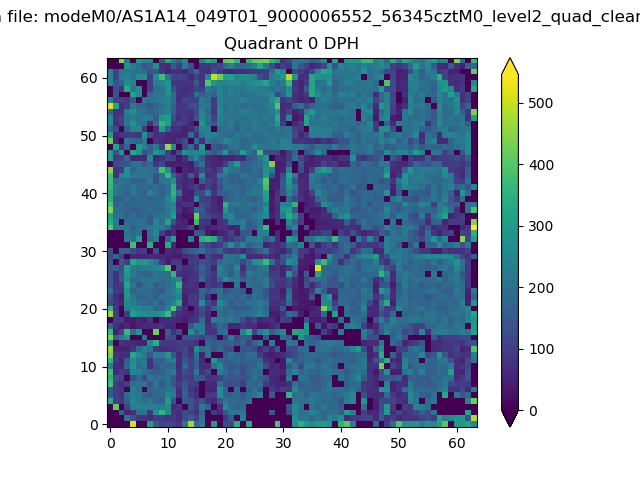 |
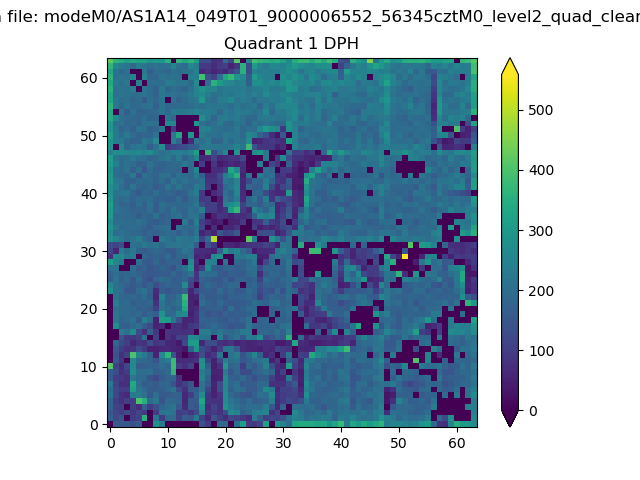 |
Quadrant B |
|---|---|---|---|
| Quadrant D |  |
 |
Quadrant C |
| Plot type | Count rate plots | Images |
|---|---|---|
| Comparison with Poisson distribution Blue bars denote a histogram of data divided into 1 sec bins. Red curve is a Poisson curve with rate = median count rate of data. |
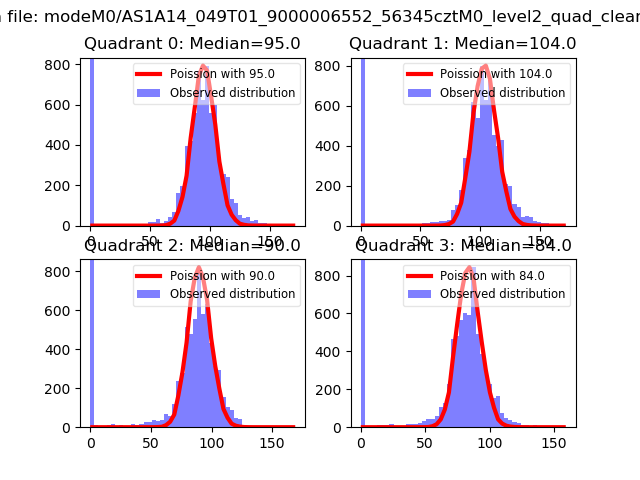 |
 |
| Quadrant-wise count rates Data is divided into 100 sec bins |
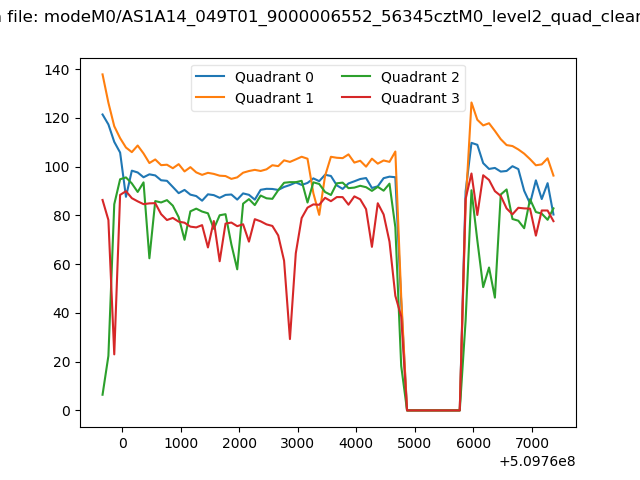 |
|
| Module-wise count rates for Quadrant A Data is divided into 100 sec bins |
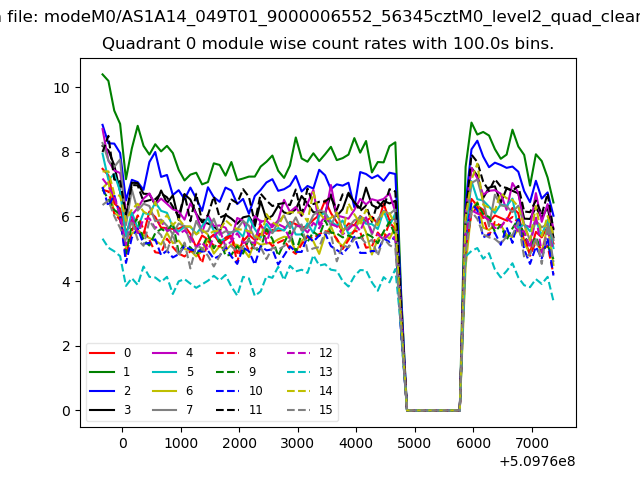 |
 |
| Module-wise count rates for Quadrant B Data is divided into 100 sec bins |
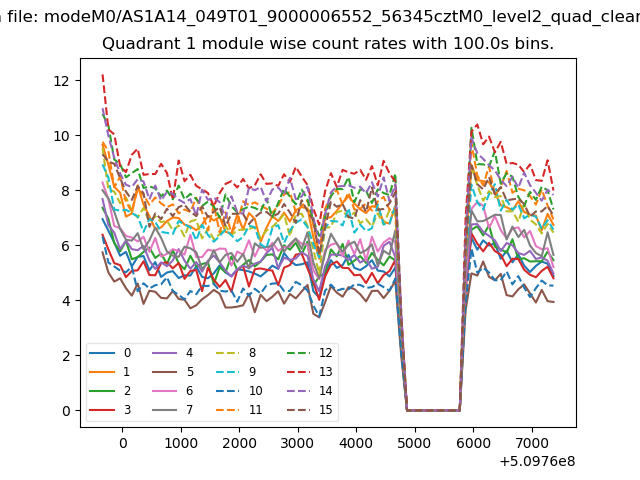 |
 |
| Module-wise count rates for Quadrant C Data is divided into 100 sec bins |
 |
 |
| Module-wise count rates for Quadrant D Data is divided into 100 sec bins |
 |
 |
| Parameter | Plot |
|---|---|
| CZT HV Monitor |  |
| D_VDD |  |
| Temperature 1 | 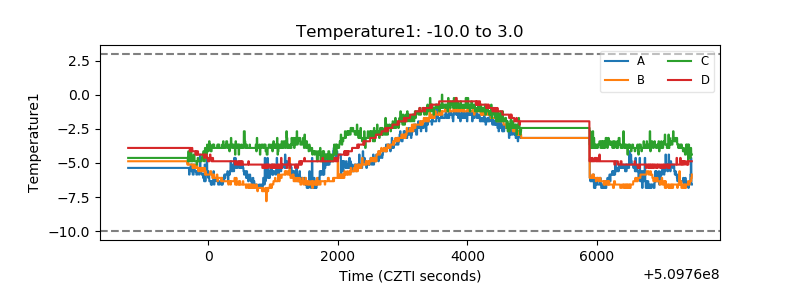 |
| Veto HV Monitor | 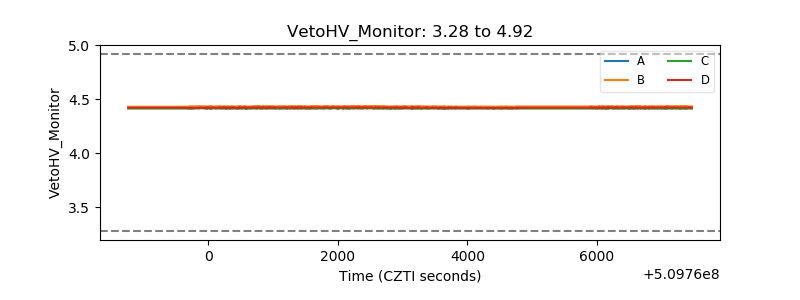 |
| Veto LLD | 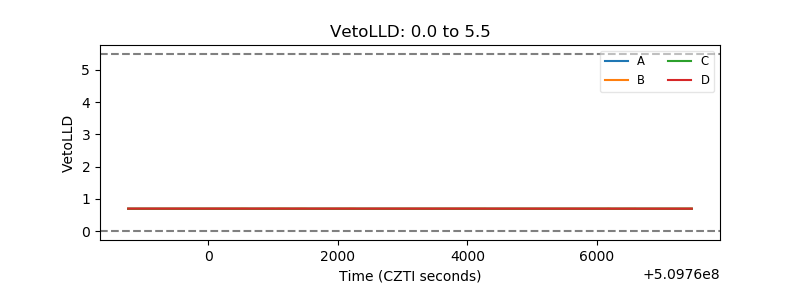 |
| Alpha Counter |  |
| _CPM_Rate | 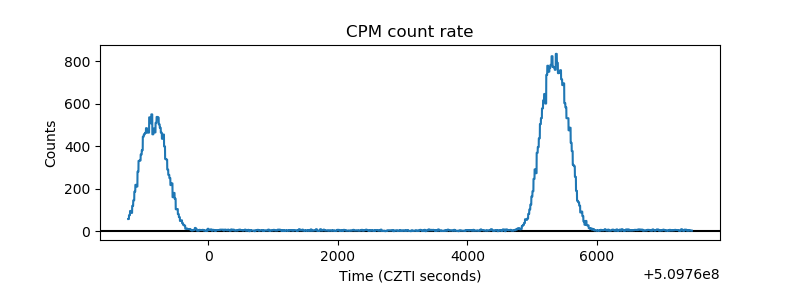 |
| CZT Counter | 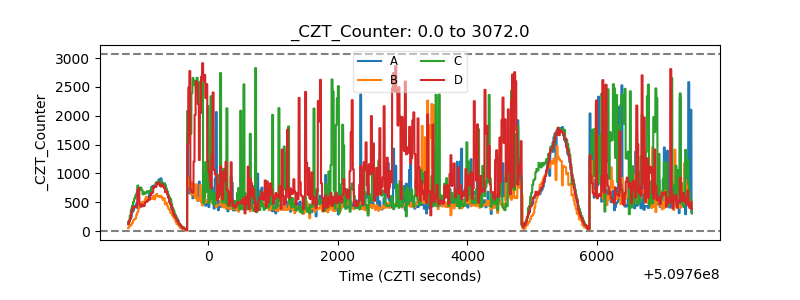 |
| +2.5 Volts monitor |  |
| +5 Volts monitor |  |
| _ROLL_ROT | 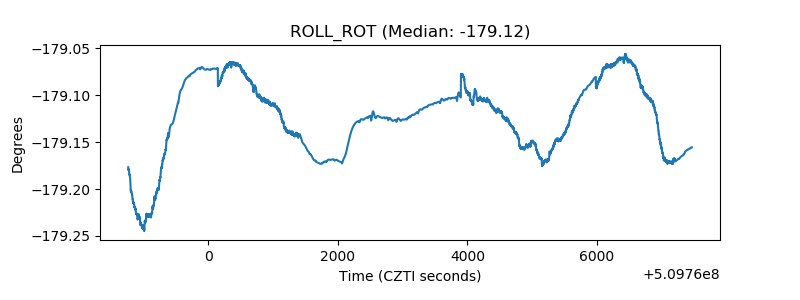 |
| _Roll_DEC | 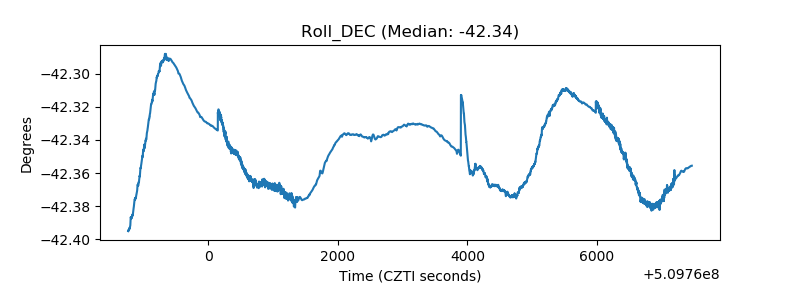 |
| _Roll_RA |  |
| Veto Counter | 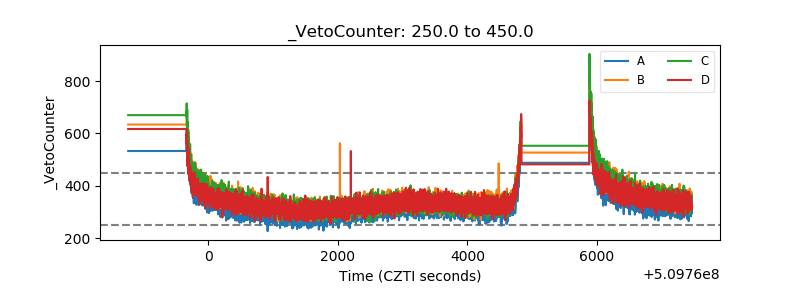 |