| Param | Original file | Final file |
|---|---|---|
| Filename | modeM0/AS1A14_049T01_9000006552_56346cztM0_level2.fits | modeM0/AS1A14_049T01_9000006552_56346cztM0_level2_quad_clean.evt |
| Size (bytes) | 690,805,440 | 90,408,960 |
| Size | 658.8 MB | 86.2 MB |
| Events in quadrant A | 4,669,088 | 624,395 |
| Events in quadrant B | 5,224,233 | 673,108 |
| Events in quadrant C | 8,447,600 | 448,380 |
| Events in quadrant D | 6,723,497 | 534,327 |
| Mode SS | |||
|---|---|---|---|
| Quadrant | BADHDUFLAG | Total packets | Discarded packets |
| A | 0 | 134 | 0 |
| B | 0 | 134 | 0 |
| C | 0 | 134 | 0 |
| D | 0 | 134 | 0 |
| Mode M9 | |||
|---|---|---|---|
| Quadrant | BADHDUFLAG | Total packets | Discarded packets |
| A | 0 | 11 | 0 |
| B | 0 | 11 | 0 |
| C | 0 | 11 | 0 |
| D | 0 | 11 | 0 |
| Mode M0 | |||
|---|---|---|---|
| Quadrant | BADHDUFLAG | Total packets | Discarded packets |
| A | 0 | 18256 | 2 |
| B | 0 | 20106 | 2 |
| C | 0 | 29620 | 2 |
| D | 0 | 24530 | 6 |
| Quadrant | Total seconds | Saturated seconds | Saturation percentage |
|---|---|---|---|
| A | 6550 | 340 | 5.190840% |
| B | 6550 | 418 | 6.381679% |
| C | 6550 | 2066 | 31.541985% |
| D | 6549 | 664 | 10.138953% |
Noise dominated data is calculated using 1-second bins in cleaned event files. If a bin has >2000 counts, and if more than 50% of those come from <1% of pixels, then it is considered to be noise-dominated and hence unusable.
| Quadrant | # 1 sec bins | Bins with >0 counts | Bins with >2000 counts | High rate bins dominated by noise | Noise dominated (total time) | Noise dominated (detector-on time) | Marked lightcurve |
|---|---|---|---|---|---|---|---|
| A | 7670 | 6551 | 228 | 228 | 2.97% | 3.48% |  |
| B | 7670 | 6551 | 211 | 211 | 2.75% | 3.22% | 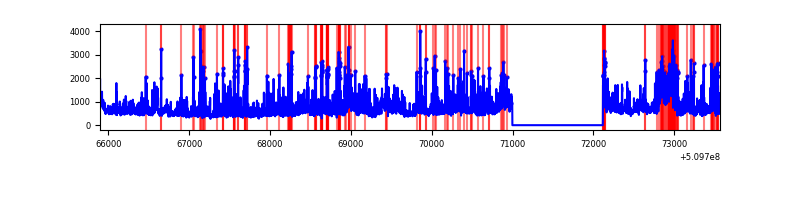 |
| C | 7669 | 6549 | 1601 | 1601 | 20.88% | 24.45% | 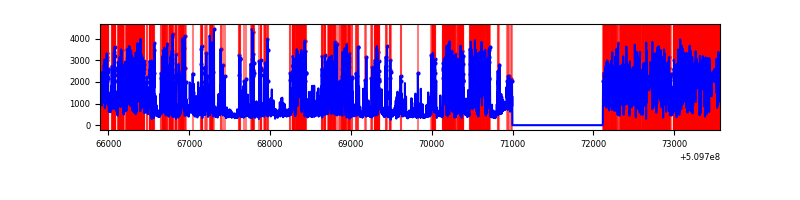 |
| D | 7669 | 6549 | 626 | 626 | 8.16% | 9.56% |  |
Top three noisy pixels from each quadrant. If the there are fewer than three noisy pixels in the level2.evt file, extra rows are filled as -1
| Pixel properties | Quadrant properties | ||||||
|---|---|---|---|---|---|---|---|
| Quadrant | DetID | PixID | Counts | Sigma | Mean | Median | Sigma |
| A | 3 | 78 | 771367 | 4382.58 | 712 | 697 | 175.8 |
| A | 3 | 14 | 247646 | 1404.33 | 712 | 697 | 175.8 |
| A | 8 | 25 | 205005 | 1161.84 | 712 | 697 | 175.8 |
| B | 5 | 172 | 1472716 | 9859.72 | 711 | 687 | 149.3 |
| B | 5 | 185 | 212864 | 1421.17 | 711 | 687 | 149.3 |
| B | 4 | 171 | 163881 | 1093.08 | 711 | 687 | 149.3 |
| C | 12 | 254 | 3083854 | 19010.75 | 600 | 596 | 162.2 |
| C | 15 | 230 | 2401465 | 14803.28 | 600 | 596 | 162.2 |
| C | 13 | 3 | 249904 | 1537.18 | 600 | 596 | 162.2 |
| D | 2 | 62 | 1054396 | 5436.25 | 680 | 648 | 193.8 |
| D | 6 | 239 | 1017613 | 5246.49 | 680 | 648 | 193.8 |
| D | 8 | 129 | 794878 | 4097.41 | 680 | 648 | 193.8 |
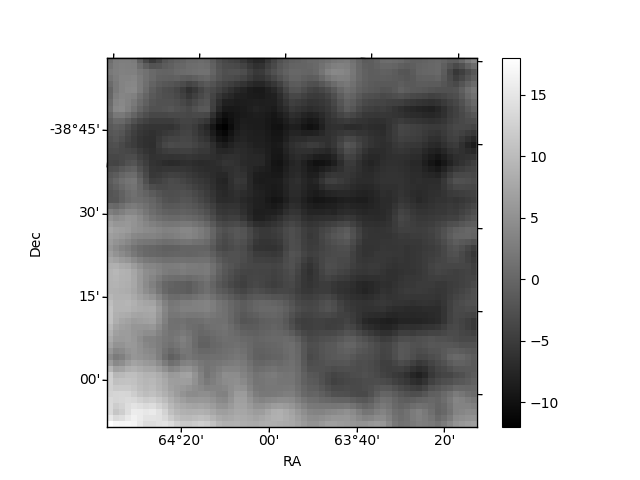
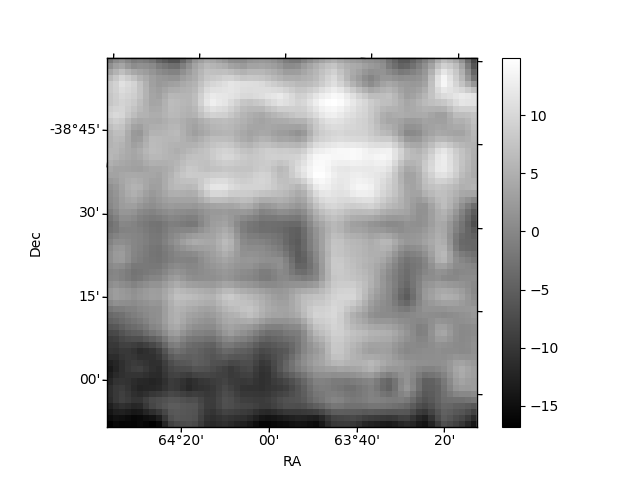
Histogram calculated using DETX and DETY for each event in the final _common_clean file
| Quadrant A | 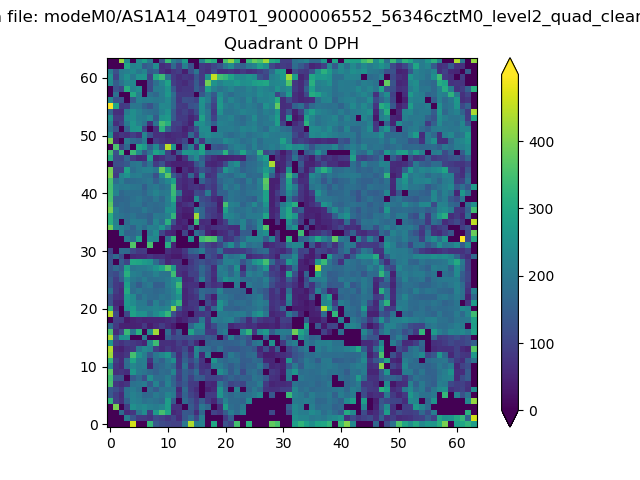 |
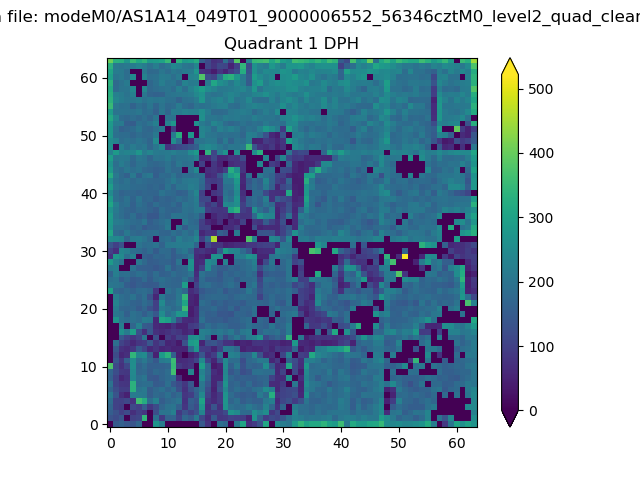 |
Quadrant B |
|---|---|---|---|
| Quadrant D | 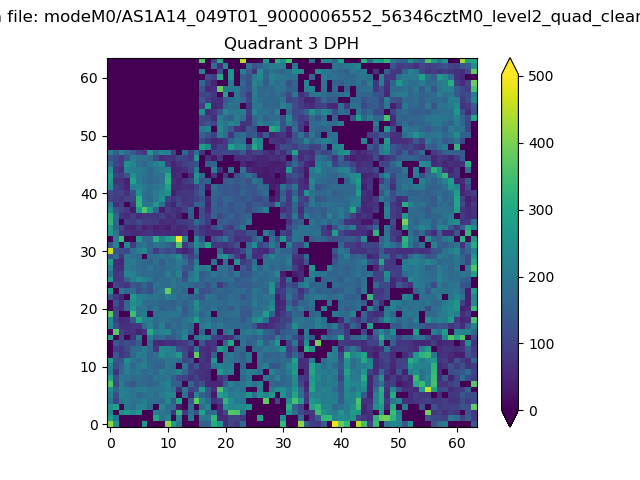 |
 |
Quadrant C |
| Plot type | Count rate plots | Images |
|---|---|---|
| Comparison with Poisson distribution Blue bars denote a histogram of data divided into 1 sec bins. Red curve is a Poisson curve with rate = median count rate of data. |
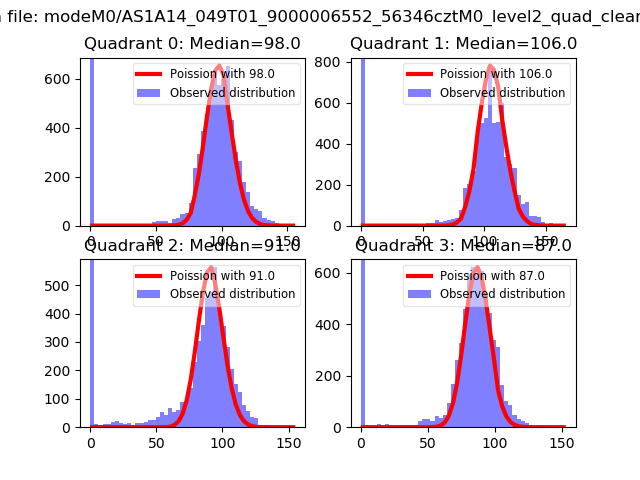 |
 |
| Quadrant-wise count rates Data is divided into 100 sec bins |
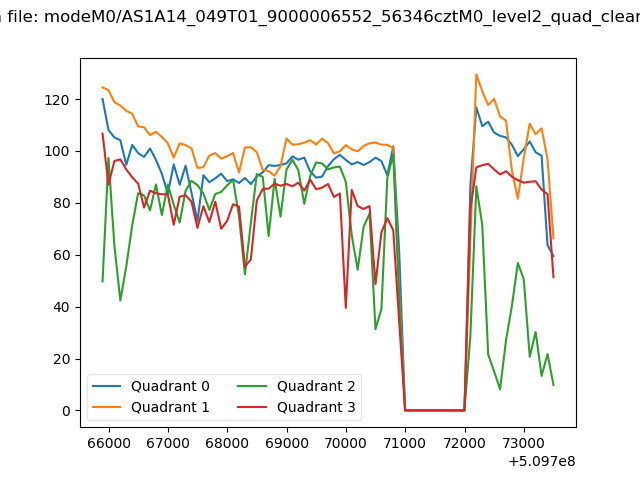 |
|
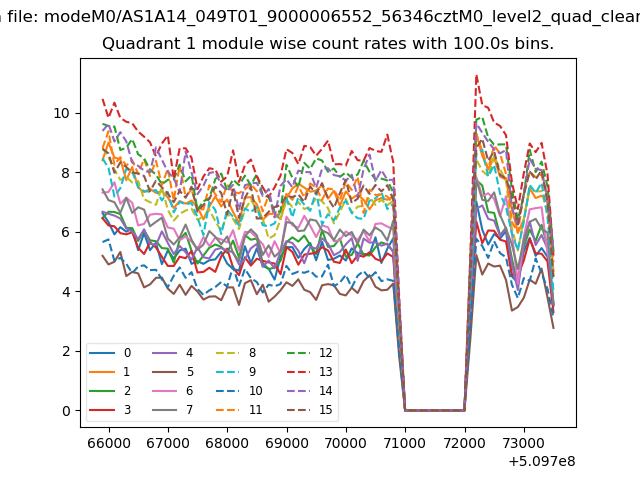
| Module-wise count rates for Quadrant A Data is divided into 100 sec bins |
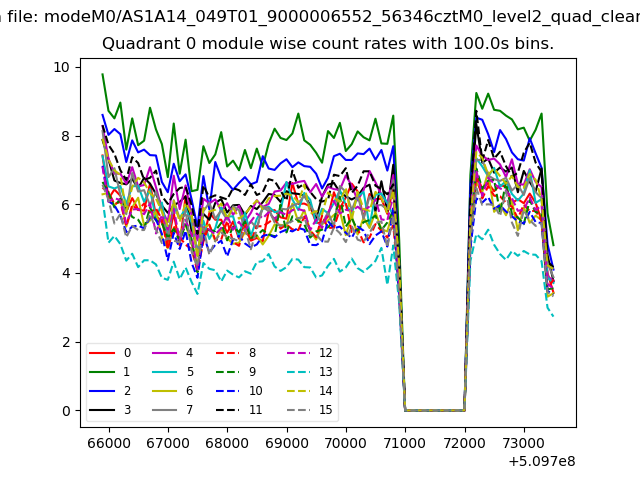 |
 |
| Module-wise count rates for Quadrant B Data is divided into 100 sec bins |
 |
 |
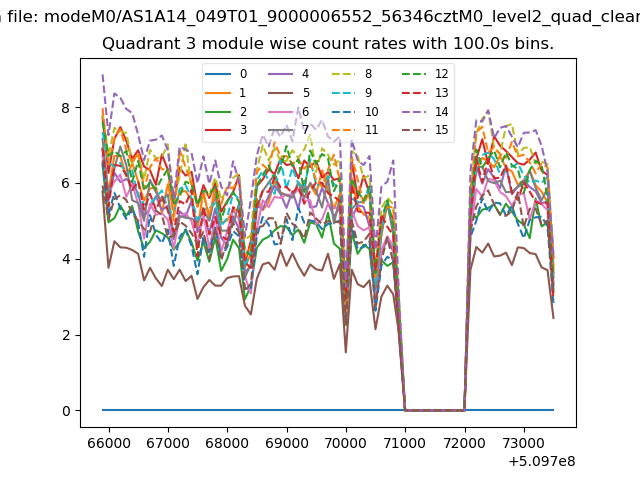
| Module-wise count rates for Quadrant C Data is divided into 100 sec bins |
 |
 |
| Module-wise count rates for Quadrant D Data is divided into 100 sec bins |
 |
 |
| Parameter | Plot |
|---|---|
| CZT HV Monitor | 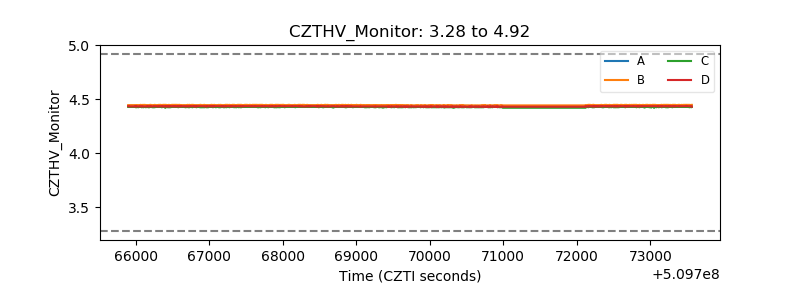 |
| D_VDD |  |
| Temperature 1 |  |
| Veto HV Monitor | 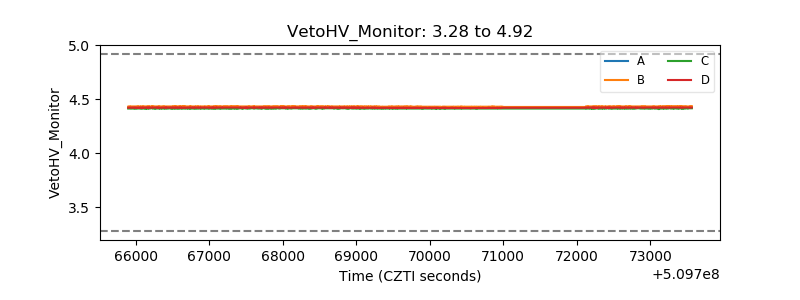 |
| Veto LLD | 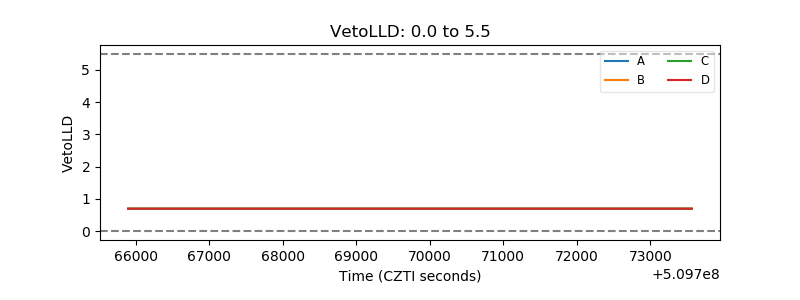 |
| Alpha Counter |  |
| _CPM_Rate | 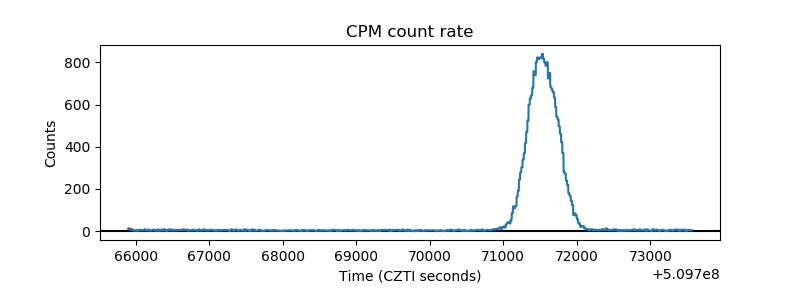 |
| CZT Counter |  |
| +2.5 Volts monitor |  |
| +5 Volts monitor | 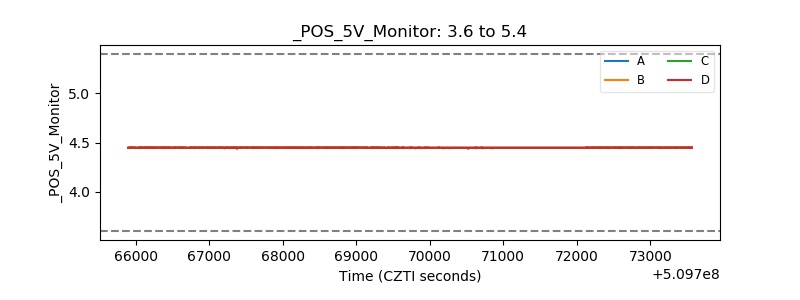 |
| _ROLL_ROT | 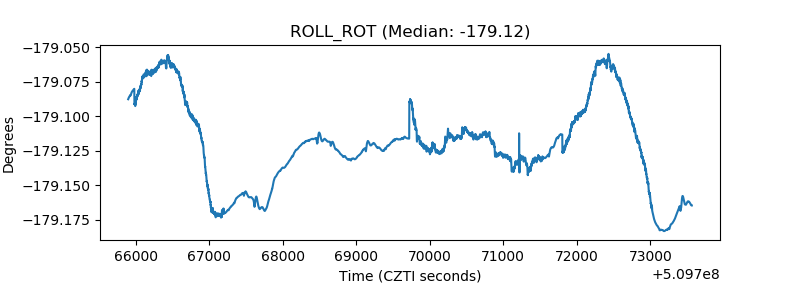 |
| _Roll_DEC | 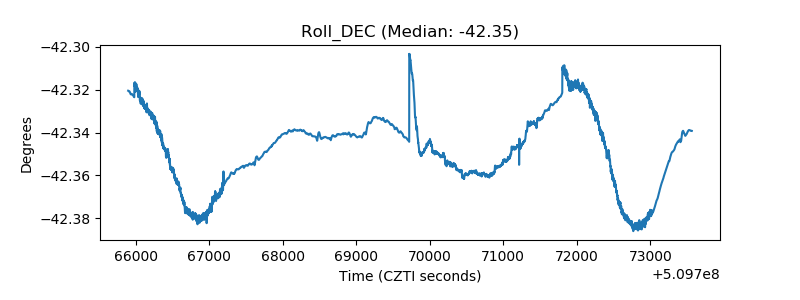 |
| _Roll_RA |  |
| Veto Counter | 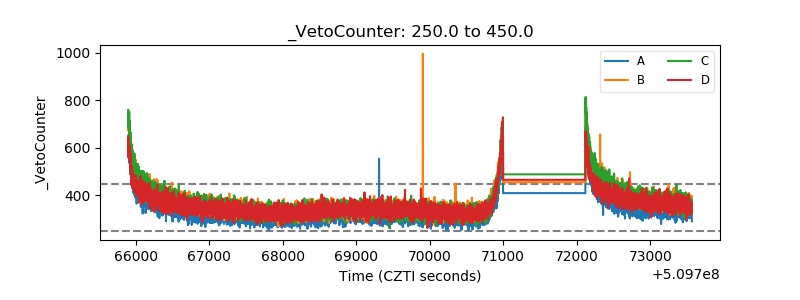 |