| Param | Original file | Final file |
|---|---|---|
| Filename | modeM0/AS1A14_049T01_9000006552_56347cztM0_level2.fits | modeM0/AS1A14_049T01_9000006552_56347cztM0_level2_quad_clean.evt |
| Size (bytes) | 784,958,400 | 79,614,720 |
| Size | 748.6 MB | 75.9 MB |
| Events in quadrant A | 5,592,525 | 576,842 |
| Events in quadrant B | 4,862,227 | 642,521 |
| Events in quadrant C | 8,097,743 | 399,002 |
| Events in quadrant D | 10,026,044 | 360,624 |
| Mode SS | |||
|---|---|---|---|
| Quadrant | BADHDUFLAG | Total packets | Discarded packets |
| A | 0 | 126 | 0 |
| B | 0 | 126 | 0 |
| C | 0 | 126 | 0 |
| D | 0 | 126 | 0 |
| Mode M9 | |||
|---|---|---|---|
| Quadrant | BADHDUFLAG | Total packets | Discarded packets |
| A | 0 | 11 | 0 |
| B | 0 | 11 | 0 |
| C | 0 | 11 | 0 |
| D | 0 | 11 | 0 |
| Mode M0 | |||
|---|---|---|---|
| Quadrant | BADHDUFLAG | Total packets | Discarded packets |
| A | 0 | 20837 | 1 |
| B | 0 | 18669 | 1 |
| C | 0 | 28331 | 1 |
| D | 0 | 34026 | 1 |
| Quadrant | Total seconds | Saturated seconds | Saturation percentage |
|---|---|---|---|
| A | 6179 | 504 | 8.156660% |
| B | 6179 | 393 | 6.360252% |
| C | 6179 | 2203 | 35.653018% |
| D | 6179 | 2449 | 39.634245% |
Noise dominated data is calculated using 1-second bins in cleaned event files. If a bin has >2000 counts, and if more than 50% of those come from <1% of pixels, then it is considered to be noise-dominated and hence unusable.
| Quadrant | # 1 sec bins | Bins with >0 counts | Bins with >2000 counts | High rate bins dominated by noise | Noise dominated (total time) | Noise dominated (detector-on time) | Marked lightcurve |
|---|---|---|---|---|---|---|---|
| A | 7329 | 6179 | 389 | 389 | 5.31% | 6.30% |  |
| B | 7329 | 6180 | 206 | 206 | 2.81% | 3.33% |  |
| C | 7329 | 6180 | 1693 | 1693 | 23.10% | 27.39% | 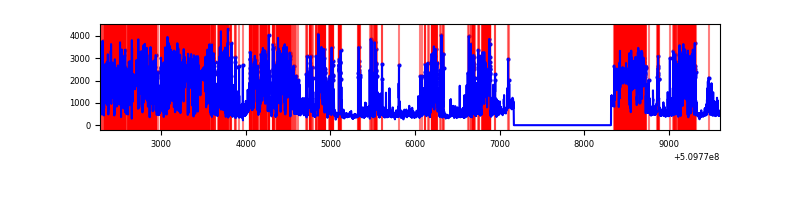 |
| D | 7329 | 6179 | 2209 | 2209 | 30.14% | 35.75% | 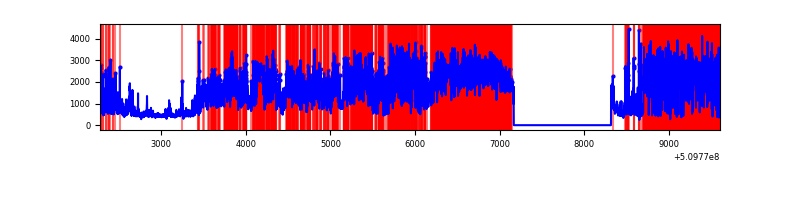 |
Top three noisy pixels from each quadrant. If the there are fewer than three noisy pixels in the level2.evt file, extra rows are filled as -1
| Pixel properties | Quadrant properties | ||||||
|---|---|---|---|---|---|---|---|
| Quadrant | DetID | PixID | Counts | Sigma | Mean | Median | Sigma |
| A | 7 | 64 | 920475 | 5631.85 | 664 | 649 | 163.3 |
| A | 3 | 14 | 639565 | 3911.91 | 664 | 649 | 163.3 |
| A | 4 | 95 | 365356 | 2233.0 | 664 | 649 | 163.3 |
| B | 5 | 172 | 1200305 | 8515.71 | 672 | 648 | 140.9 |
| B | 5 | 185 | 269202 | 1906.32 | 672 | 648 | 140.9 |
| B | 4 | 171 | 265917 | 1883.0 | 672 | 648 | 140.9 |
| C | 15 | 230 | 3677897 | 24589.67 | 548 | 543 | 149.5 |
| C | 12 | 254 | 1779897 | 11898.15 | 548 | 543 | 149.5 |
| C | 13 | 3 | 300531 | 2005.95 | 548 | 543 | 149.5 |
| D | 2 | 62 | 5067369 | 30574.17 | 578 | 550 | 165.7 |
| D | 12 | 3 | 876150 | 5283.54 | 578 | 550 | 165.7 |
| D | 6 | 239 | 639935 | 3858.17 | 578 | 550 | 165.7 |
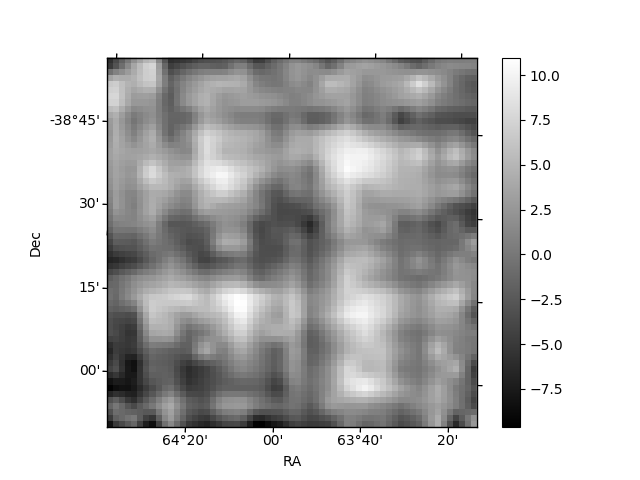
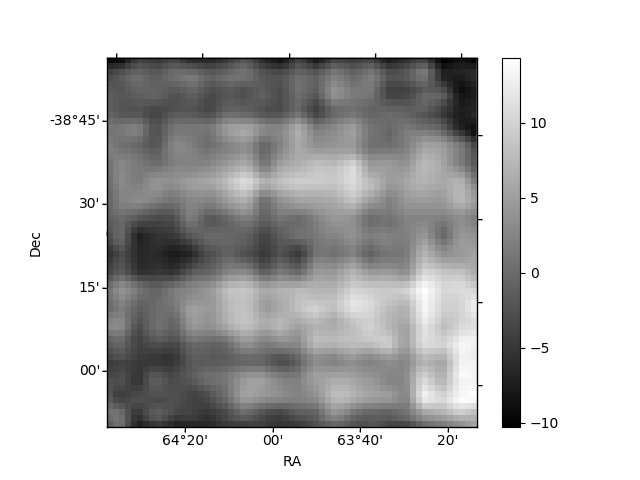
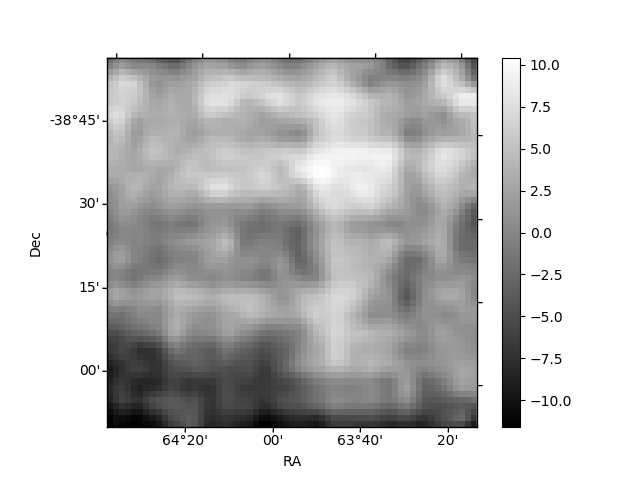
Histogram calculated using DETX and DETY for each event in the final _common_clean file
| Quadrant A |  |
 |
Quadrant B |
|---|---|---|---|
| Quadrant D | 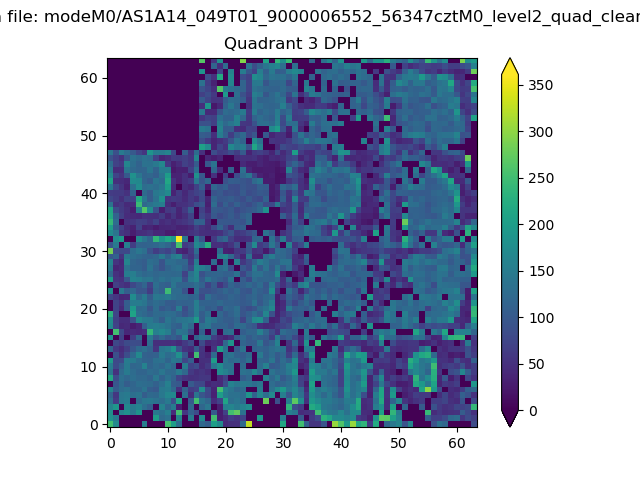 |
 |
Quadrant C |
| Plot type | Count rate plots | Images |
|---|---|---|
| Comparison with Poisson distribution Blue bars denote a histogram of data divided into 1 sec bins. Red curve is a Poisson curve with rate = median count rate of data. |
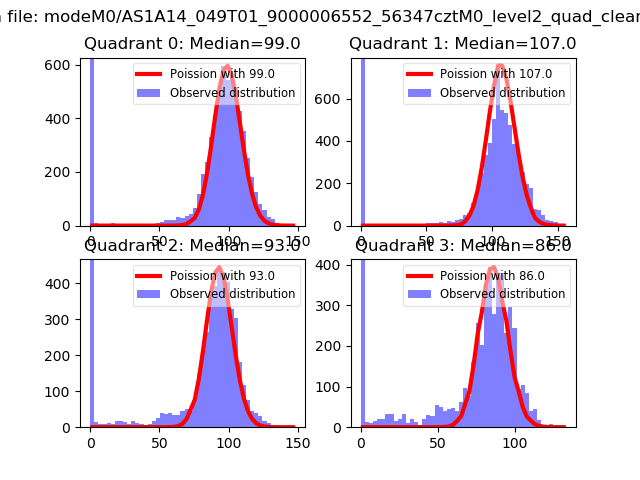 |
 |
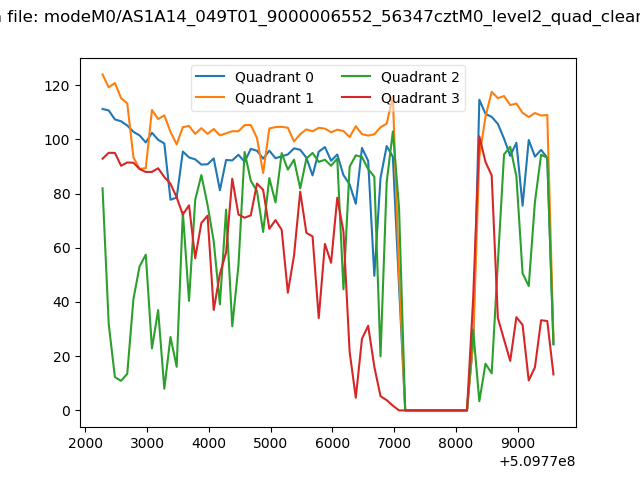
| Quadrant-wise count rates Data is divided into 100 sec bins |
 |
|
| Module-wise count rates for Quadrant A Data is divided into 100 sec bins |
 |
 |
| Module-wise count rates for Quadrant B Data is divided into 100 sec bins |
 |
 |
| Module-wise count rates for Quadrant C Data is divided into 100 sec bins |
 |
 |
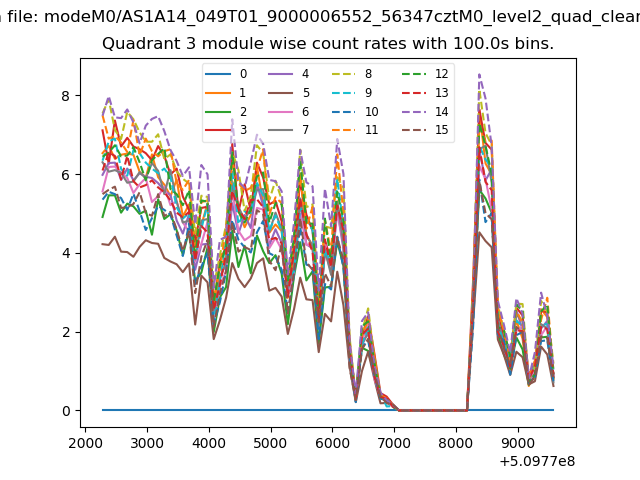
| Module-wise count rates for Quadrant D Data is divided into 100 sec bins |
 |
 |
| Parameter | Plot |
|---|---|
| CZT HV Monitor | 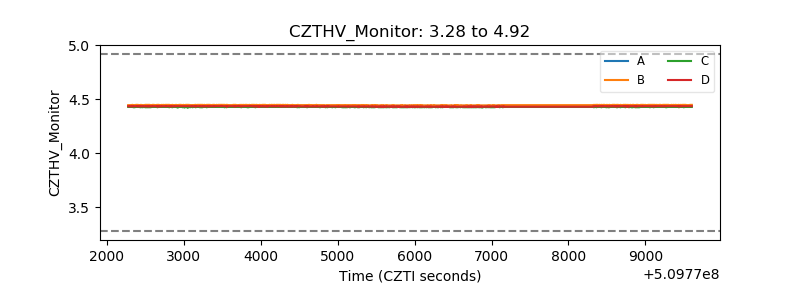 |
| D_VDD |  |
| Temperature 1 |  |
| Veto HV Monitor | 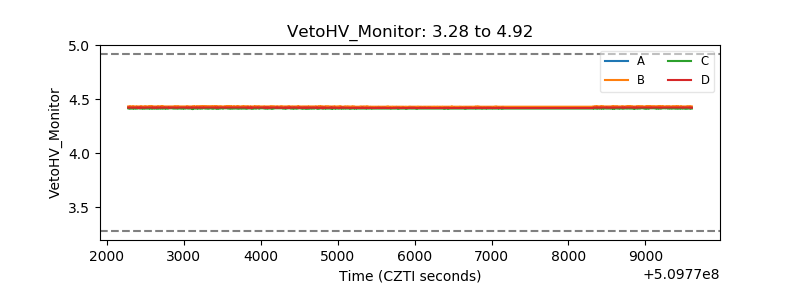 |
| Veto LLD | 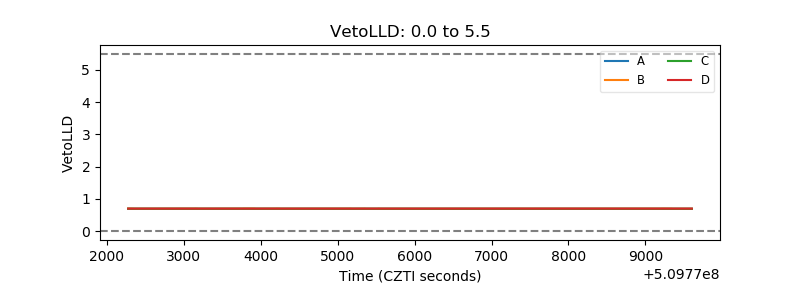 |
| Alpha Counter | 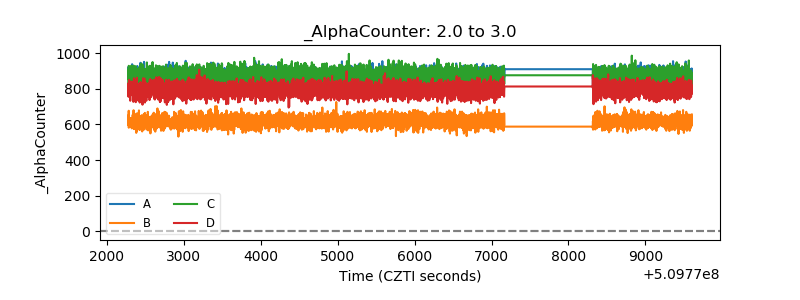 |
| _CPM_Rate | 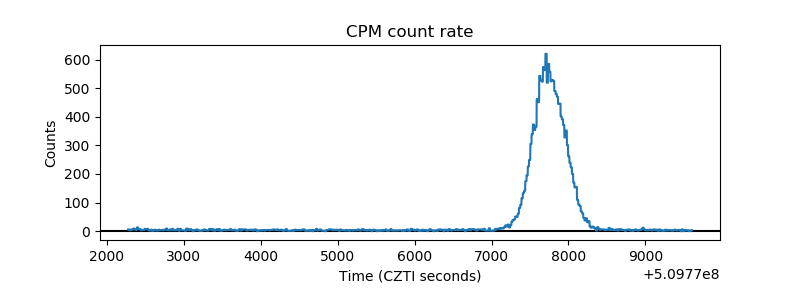 |
| CZT Counter |  |
| +2.5 Volts monitor |  |
| +5 Volts monitor | 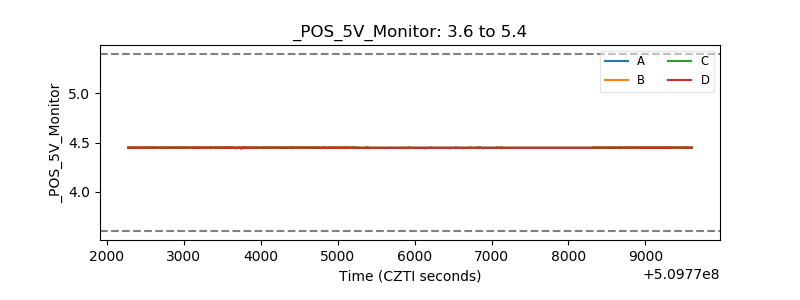 |
| _ROLL_ROT | 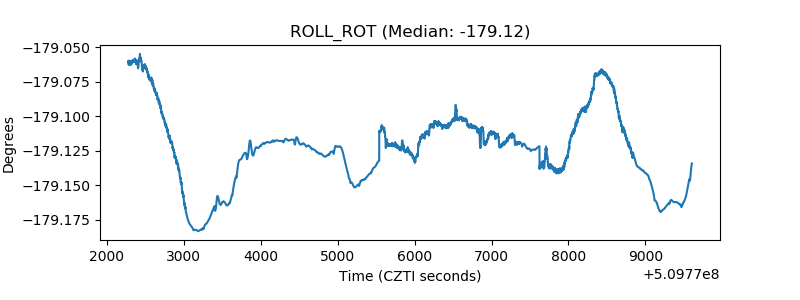 |
| _Roll_DEC | 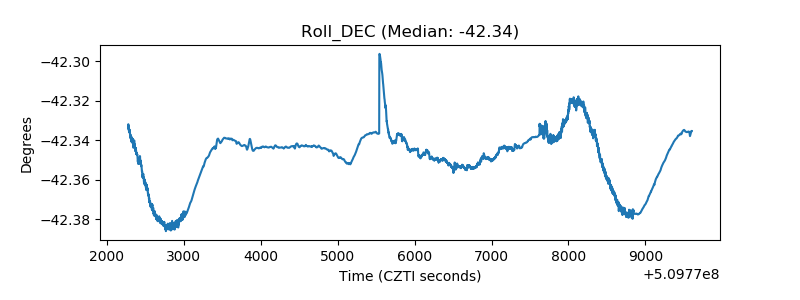 |
| _Roll_RA |  |
| Veto Counter | 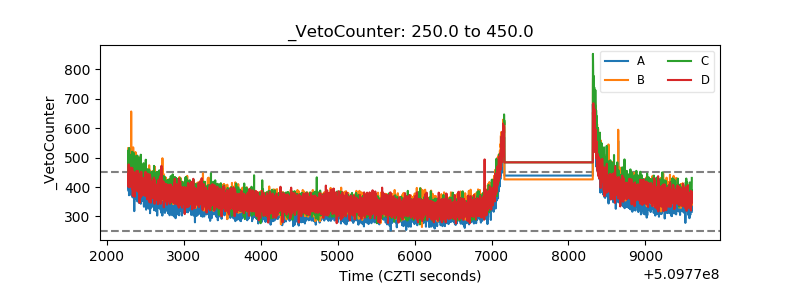 |