| Param | Original file | Final file |
|---|---|---|
| Filename | modeM0/AS1A14_049T01_9000006552_56348cztM0_level2.fits | modeM0/AS1A14_049T01_9000006552_56348cztM0_level2_quad_clean.evt |
| Size (bytes) | 511,444,800 | 51,186,240 |
| Size | 487.8 MB | 48.8 MB |
| Events in quadrant A | 3,309,241 | 378,001 |
| Events in quadrant B | 4,109,021 | 372,954 |
| Events in quadrant C | 4,196,067 | 303,216 |
| Events in quadrant D | 7,001,707 | 208,785 |
| Mode SS | |||
|---|---|---|---|
| Quadrant | BADHDUFLAG | Total packets | Discarded packets |
| A | 0 | 82 | 0 |
| B | 0 | 82 | 0 |
| C | 0 | 82 | 0 |
| D | 0 | 82 | 0 |
| Mode M9 | |||
|---|---|---|---|
| Quadrant | BADHDUFLAG | Total packets | Discarded packets |
| A | 0 | 3 | 0 |
| B | 0 | 4 | 0 |
| C | 0 | 4 | 0 |
| D | 0 | 4 | 0 |
| Mode M0 | |||
|---|---|---|---|
| Quadrant | BADHDUFLAG | Total packets | Discarded packets |
| A | 0 | 12596 | 1 |
| B | 0 | 14942 | 1 |
| C | 0 | 15264 | 1 |
| D | 0 | 23574 | 1 |
| Quadrant | Total seconds | Saturated seconds | Saturation percentage |
|---|---|---|---|
| A | 4063 | 262 | 6.448437% |
| B | 4063 | 699 | 17.204036% |
| C | 4063 | 921 | 22.667979% |
| D | 4063 | 1902 | 46.812700% |
Noise dominated data is calculated using 1-second bins in cleaned event files. If a bin has >2000 counts, and if more than 50% of those come from <1% of pixels, then it is considered to be noise-dominated and hence unusable.
| Quadrant | # 1 sec bins | Bins with >0 counts | Bins with >2000 counts | High rate bins dominated by noise | Noise dominated (total time) | Noise dominated (detector-on time) | Marked lightcurve |
|---|---|---|---|---|---|---|---|
| A | 4063 | 4063 | 232 | 232 | 5.71% | 5.71% | 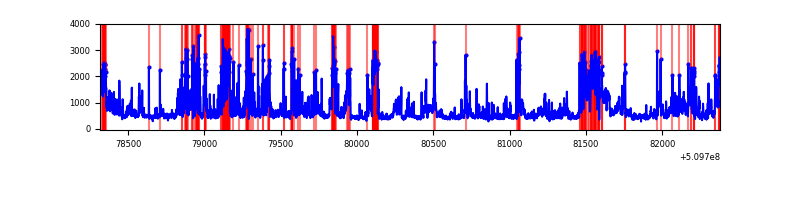 |
| B | 4062 | 4062 | 567 | 567 | 13.96% | 13.96% |  |
| C | 4063 | 4063 | 757 | 757 | 18.63% | 18.63% | 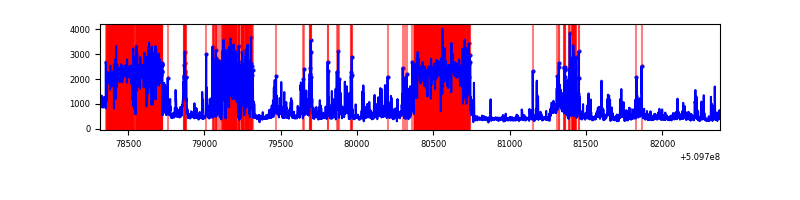 |
| D | 4062 | 4062 | 1551 | 1551 | 38.18% | 38.18% | 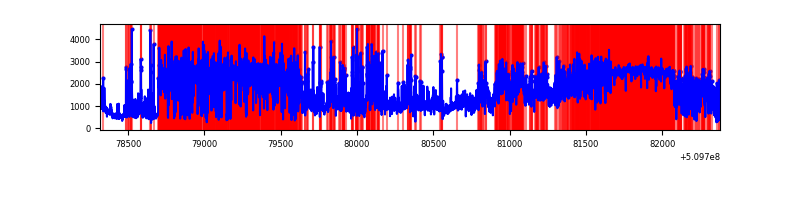 |
Top three noisy pixels from each quadrant. If the there are fewer than three noisy pixels in the level2.evt file, extra rows are filled as -1
| Pixel properties | Quadrant properties | ||||||
|---|---|---|---|---|---|---|---|
| Quadrant | DetID | PixID | Counts | Sigma | Mean | Median | Sigma |
| A | 7 | 64 | 452868 | 4209.2 | 428 | 418 | 107.5 |
| A | 4 | 95 | 419037 | 3894.47 | 428 | 418 | 107.5 |
| A | 8 | 25 | 201501 | 1870.7 | 428 | 418 | 107.5 |
| B | 5 | 172 | 1476641 | 17071.39 | 405 | 391 | 86.5 |
| B | 5 | 185 | 408297 | 4717.03 | 405 | 391 | 86.5 |
| B | 8 | 128 | 179220 | 2067.98 | 405 | 391 | 86.5 |
| C | 15 | 230 | 2063349 | 20320.38 | 368 | 364 | 101.5 |
| C | 6 | 223 | 174375 | 1714.01 | 368 | 364 | 101.5 |
| C | 15 | 209 | 128620 | 1263.32 | 368 | 364 | 101.5 |
| D | 2 | 62 | 2665560 | 28198.48 | 328 | 312 | 94.5 |
| D | 12 | 3 | 2181460 | 23076.68 | 328 | 312 | 94.5 |
| D | 8 | 240 | 307563 | 3250.73 | 328 | 312 | 94.5 |
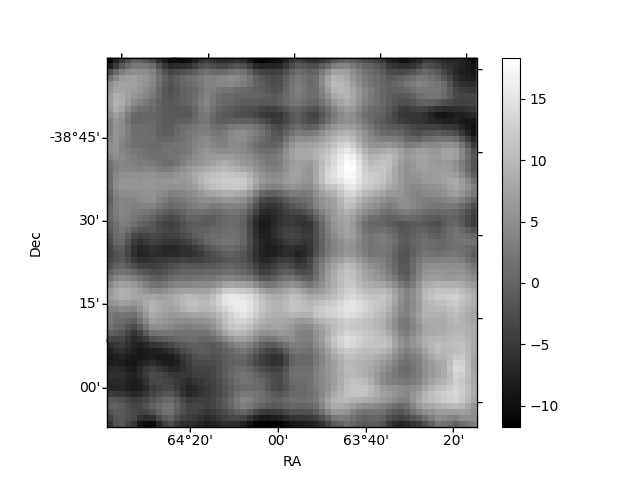
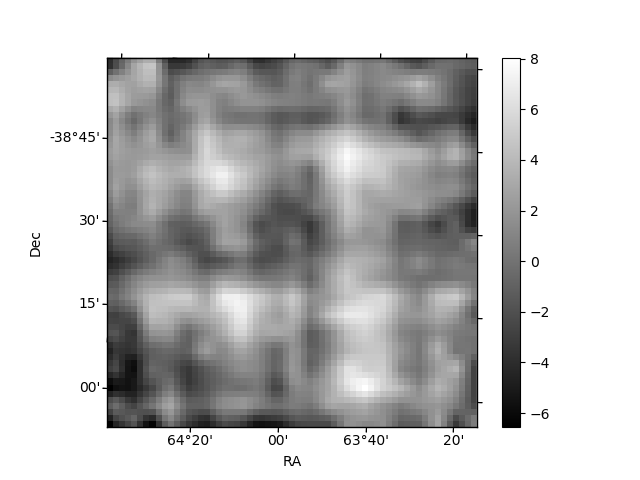
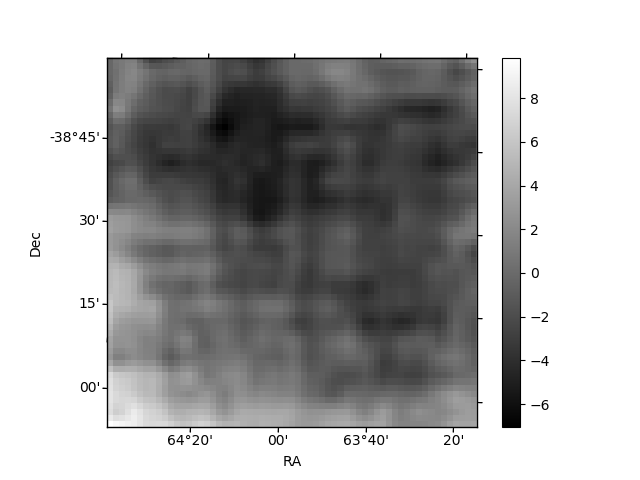
Histogram calculated using DETX and DETY for each event in the final _common_clean file
| Quadrant A | 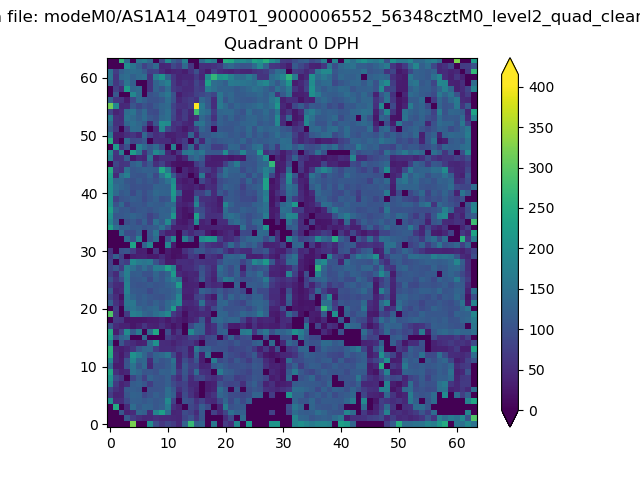 |
 |
Quadrant B |
|---|---|---|---|
| Quadrant D |  |
 |
Quadrant C |
| Plot type | Count rate plots | Images |
|---|---|---|
| Comparison with Poisson distribution Blue bars denote a histogram of data divided into 1 sec bins. Red curve is a Poisson curve with rate = median count rate of data. |
 |
 |
| Quadrant-wise count rates Data is divided into 100 sec bins |
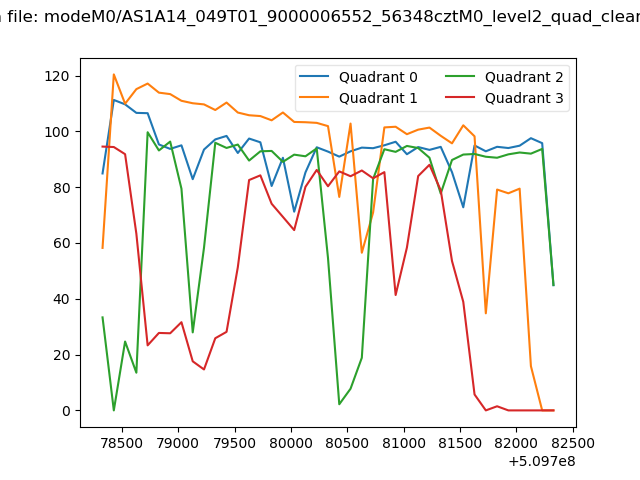 |
|
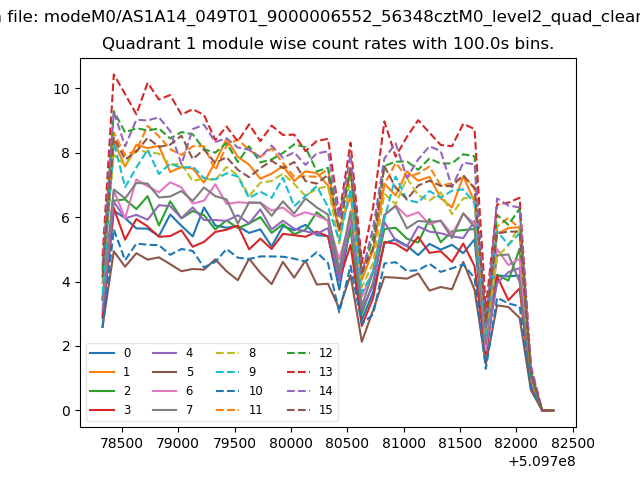
| Module-wise count rates for Quadrant A Data is divided into 100 sec bins |
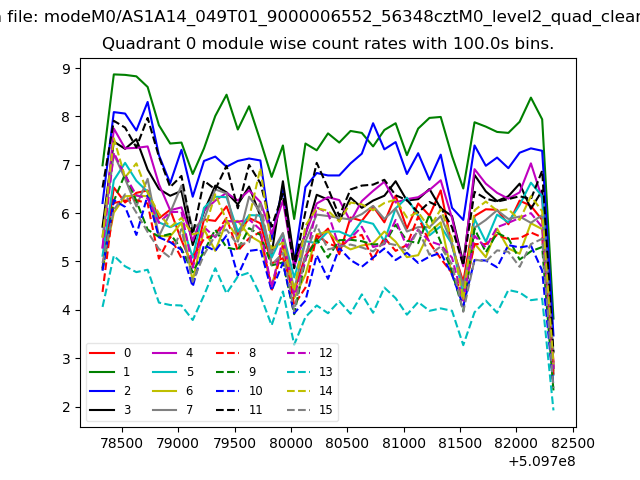 |
 |
| Module-wise count rates for Quadrant B Data is divided into 100 sec bins |
 |
 |
| Module-wise count rates for Quadrant C Data is divided into 100 sec bins |
 |
 |
| Module-wise count rates for Quadrant D Data is divided into 100 sec bins |
 |
 |
| Parameter | Plot |
|---|---|
| CZT HV Monitor | 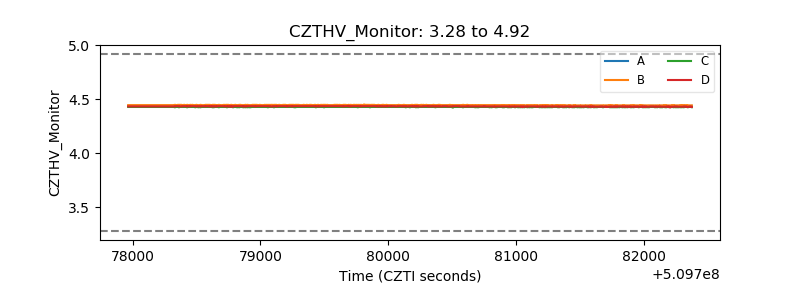 |
| D_VDD |  |
| Temperature 1 | 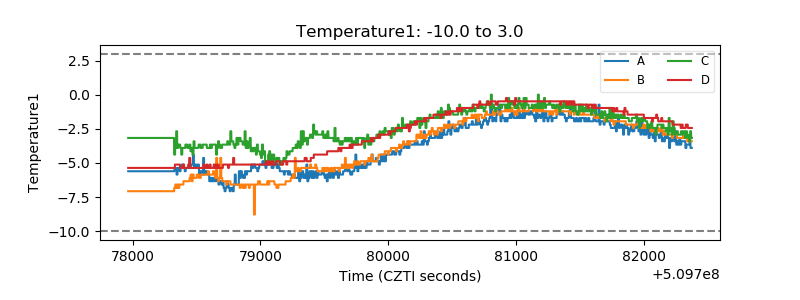 |
| Veto HV Monitor |  |
| Veto LLD | 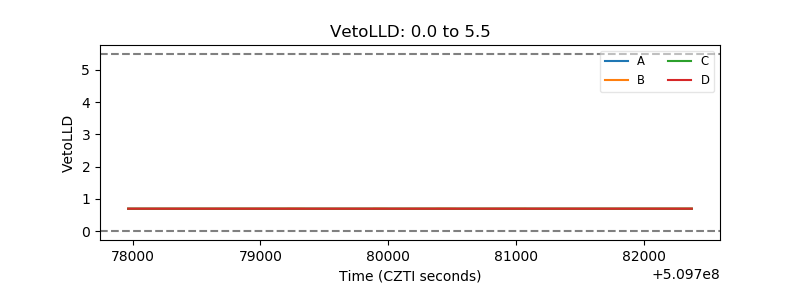 |
| Alpha Counter | 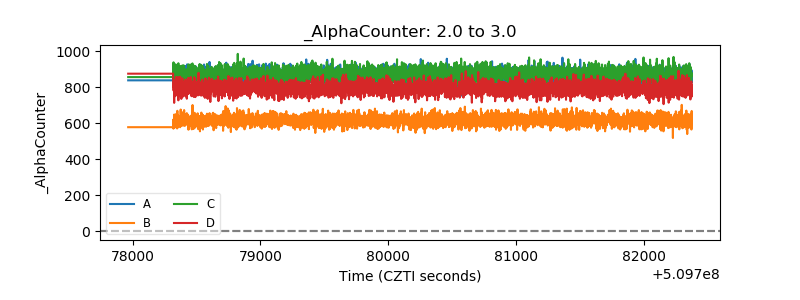 |
| _CPM_Rate |  |
| CZT Counter | 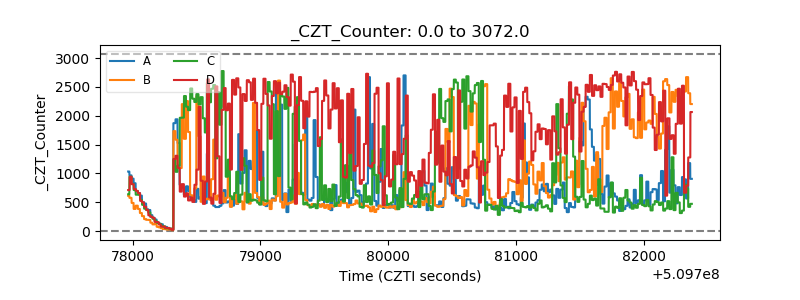 |
| +2.5 Volts monitor | 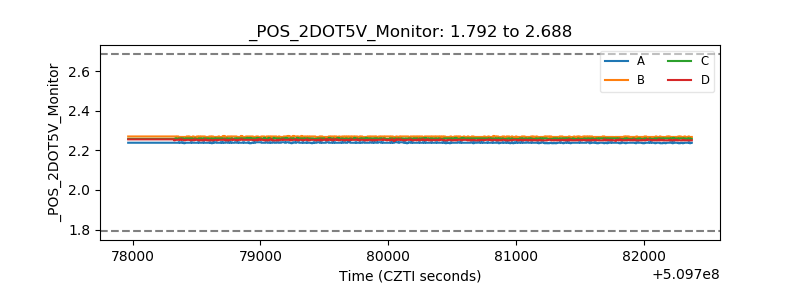 |
| +5 Volts monitor | 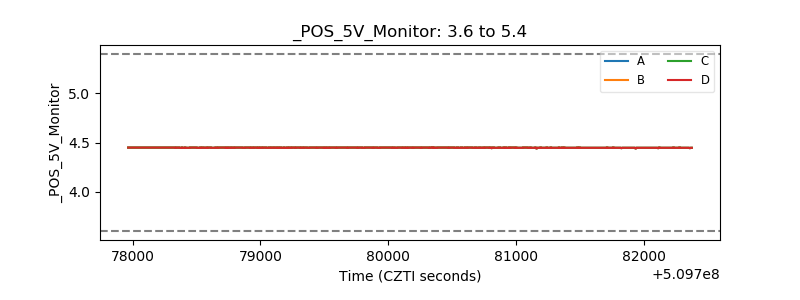 |
| _ROLL_ROT | 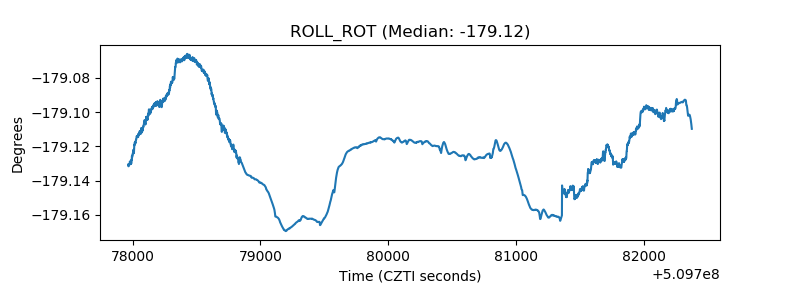 |
| _Roll_DEC |  |
| _Roll_RA |  |
| Veto Counter |  |