| Param | Original file | Final file |
|---|---|---|
| Filename | modeM0/AS1A14_083T05_9000006554_56349cztM0_level2.fits | modeM0/AS1A14_083T05_9000006554_56349cztM0_level2_quad_clean.evt |
| Size (bytes) | 820,206,720 | 80,501,760 |
| Size | 782.2 MB | 76.8 MB |
| Events in quadrant A | 5,753,957 | 580,682 |
| Events in quadrant B | 7,193,693 | 550,428 |
| Events in quadrant C | 5,897,854 | 506,852 |
| Events in quadrant D | 11,013,726 | 346,092 |
| Mode M9 | |||
|---|---|---|---|
| Quadrant | BADHDUFLAG | Total packets | Discarded packets |
| A | 0 | 9 | 0 |
| B | 0 | 9 | 0 |
| C | 0 | 9 | 0 |
| D | 0 | 9 | 0 |
| Mode SS | |||
|---|---|---|---|
| Quadrant | BADHDUFLAG | Total packets | Discarded packets |
| A | 0 | 132 | 0 |
| B | 0 | 132 | 0 |
| C | 0 | 132 | 0 |
| D | 0 | 132 | 0 |
| Mode M0 | |||
|---|---|---|---|
| Quadrant | BADHDUFLAG | Total packets | Discarded packets |
| A | 0 | 21534 | 1 |
| B | 0 | 25869 | 1 |
| C | 0 | 22099 | 1 |
| D | 0 | 37180 | 1 |
| Quadrant | Total seconds | Saturated seconds | Saturation percentage |
|---|---|---|---|
| A | 6494 | 611 | 9.408685% |
| B | 6495 | 1532 | 23.587375% |
| C | 6495 | 1132 | 17.428791% |
| D | 6495 | 2764 | 42.555812% |
Noise dominated data is calculated using 1-second bins in cleaned event files. If a bin has >2000 counts, and if more than 50% of those come from <1% of pixels, then it is considered to be noise-dominated and hence unusable.
| Quadrant | # 1 sec bins | Bins with >0 counts | Bins with >2000 counts | High rate bins dominated by noise | Noise dominated (total time) | Noise dominated (detector-on time) | Marked lightcurve |
|---|---|---|---|---|---|---|---|
| A | 7359 | 6494 | 451 | 451 | 6.13% | 6.94% |  |
| B | 7360 | 6495 | 1214 | 1214 | 16.49% | 18.69% |  |
| C | 7360 | 6496 | 833 | 833 | 11.32% | 12.82% |  |
| D | 7360 | 6496 | 2500 | 2500 | 33.97% | 38.49% |  |
Top three noisy pixels from each quadrant. If the there are fewer than three noisy pixels in the level2.evt file, extra rows are filled as -1
| Pixel properties | Quadrant properties | ||||||
|---|---|---|---|---|---|---|---|
| Quadrant | DetID | PixID | Counts | Sigma | Mean | Median | Sigma |
| A | 4 | 95 | 1791022 | 10383.82 | 696 | 680 | 172.4 |
| A | 1 | 191 | 267524 | 1547.67 | 696 | 680 | 172.4 |
| A | 0 | 8 | 258872 | 1497.49 | 696 | 680 | 172.4 |
| B | 5 | 172 | 4070339 | 30055.26 | 634 | 611 | 135.4 |
| B | 4 | 171 | 119214 | 875.89 | 634 | 611 | 135.4 |
| B | 5 | 185 | 82370 | 603.79 | 634 | 611 | 135.4 |
| C | 15 | 230 | 2290966 | 13129.26 | 633 | 626 | 174.4 |
| C | 13 | 3 | 468806 | 2683.82 | 633 | 626 | 174.4 |
| C | 12 | 254 | 207493 | 1185.86 | 633 | 626 | 174.4 |
| D | 2 | 62 | 5221824 | 31828.45 | 580 | 552 | 164.0 |
| D | 8 | 129 | 1537530 | 9369.29 | 580 | 552 | 164.0 |
| D | 12 | 3 | 813502 | 4955.67 | 580 | 552 | 164.0 |
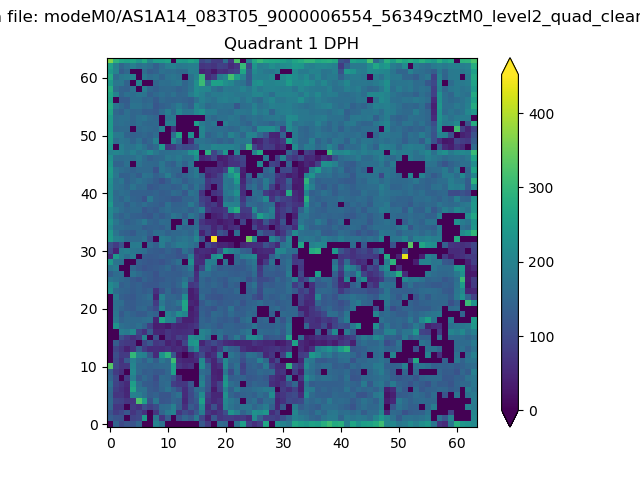
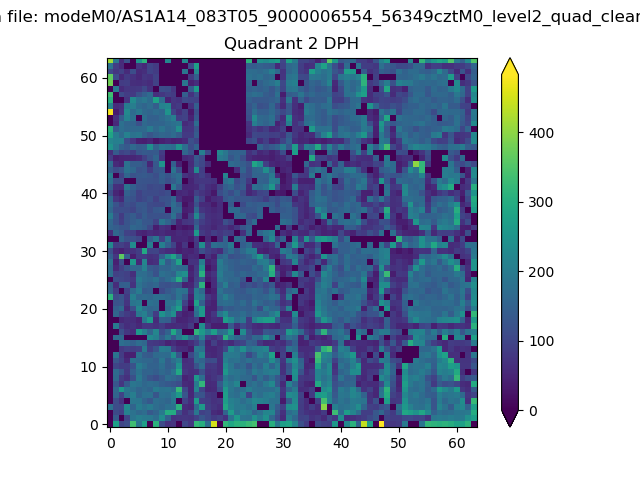
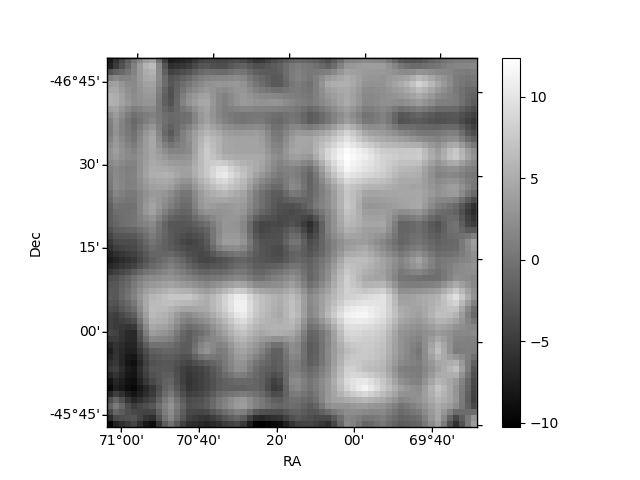
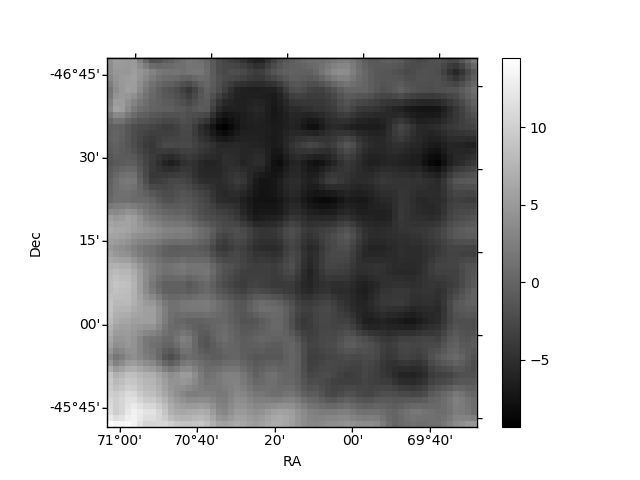
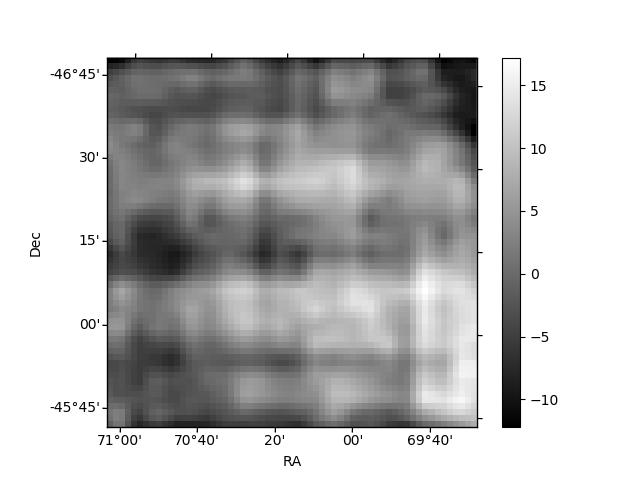
Histogram calculated using DETX and DETY for each event in the final _common_clean file
| Quadrant A |  |
 |
Quadrant B |
|---|---|---|---|
| Quadrant D |  |
 |
Quadrant C |
| Plot type | Count rate plots | Images |
|---|---|---|
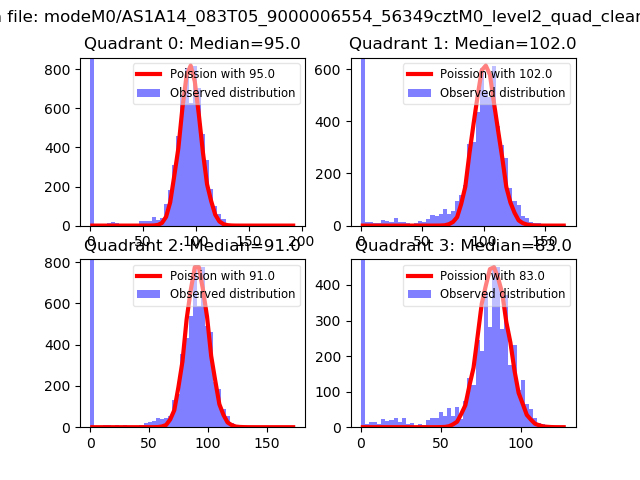
| Comparison with Poisson distribution Blue bars denote a histogram of data divided into 1 sec bins. Red curve is a Poisson curve with rate = median count rate of data. |
 |
 |
| Quadrant-wise count rates Data is divided into 100 sec bins |
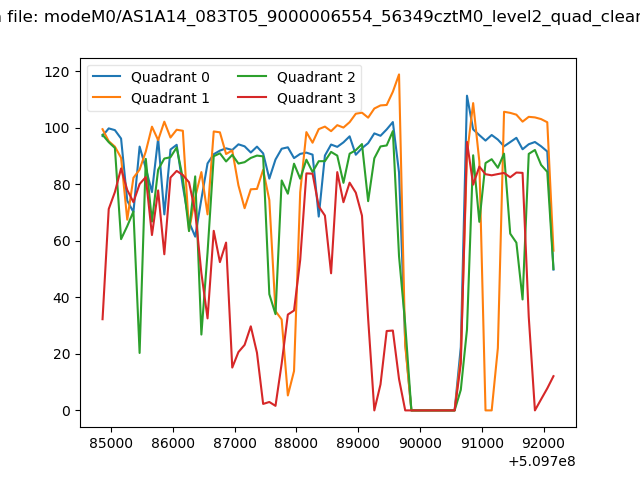 |
|
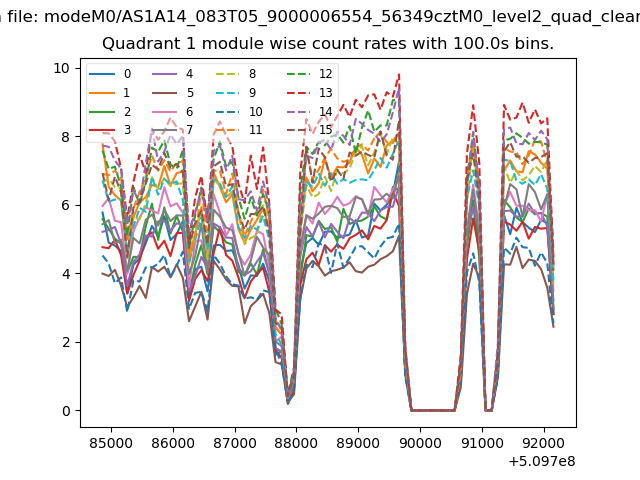
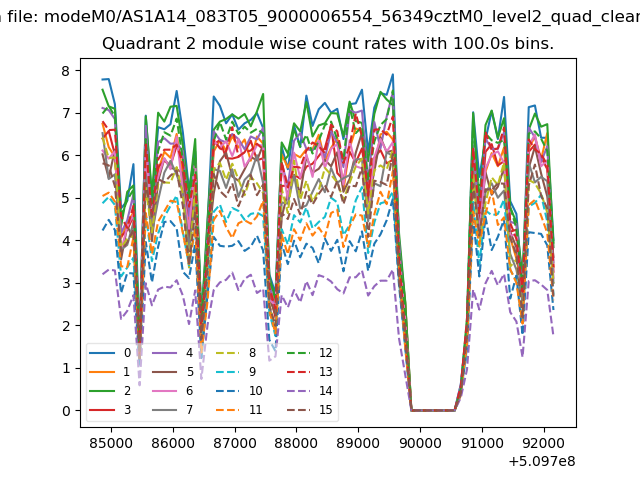
| Module-wise count rates for Quadrant A Data is divided into 100 sec bins |
 |
 |
| Module-wise count rates for Quadrant B Data is divided into 100 sec bins |
 |
 |
| Module-wise count rates for Quadrant C Data is divided into 100 sec bins |
 |
 |
| Module-wise count rates for Quadrant D Data is divided into 100 sec bins |
 |
 |
| Parameter | Plot |
|---|---|
| CZT HV Monitor | 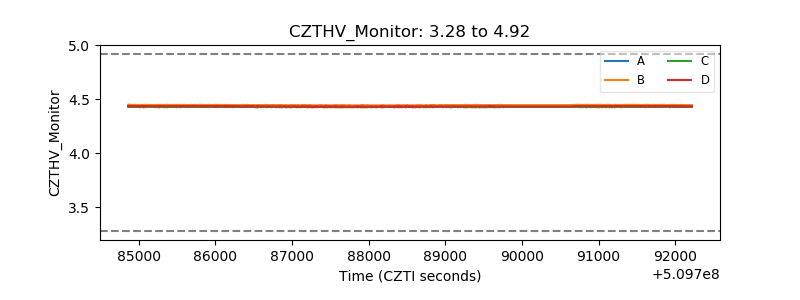 |
| D_VDD |  |
| Temperature 1 | 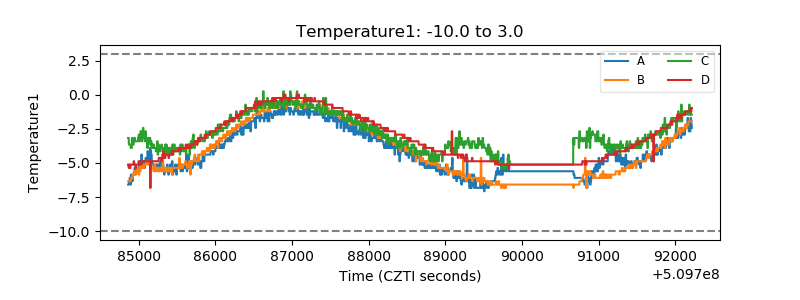 |
| Veto HV Monitor |  |
| Veto LLD |  |
| Alpha Counter |  |
| _CPM_Rate | 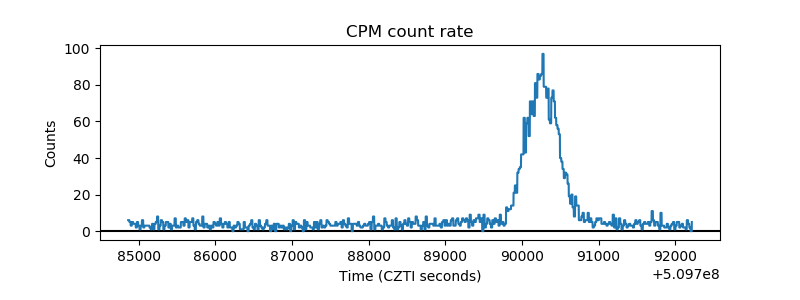 |
| CZT Counter | 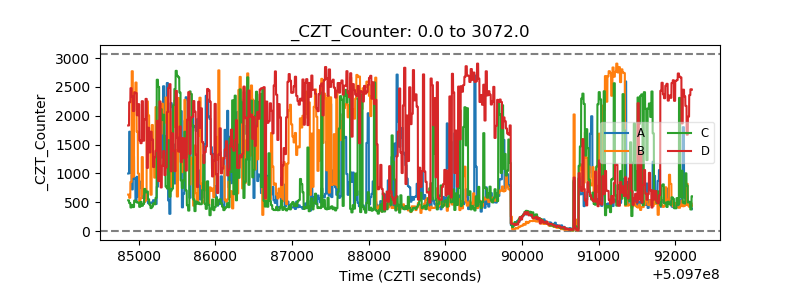 |
| +2.5 Volts monitor | 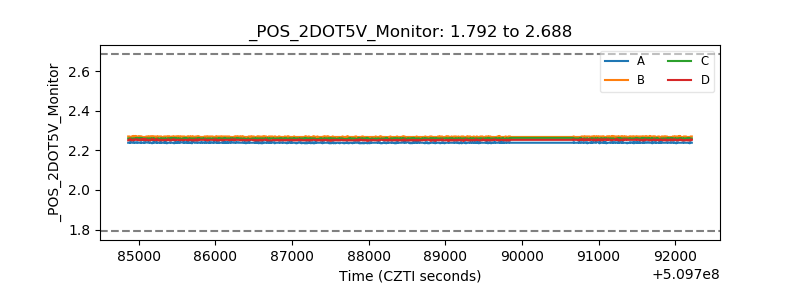 |
| +5 Volts monitor | 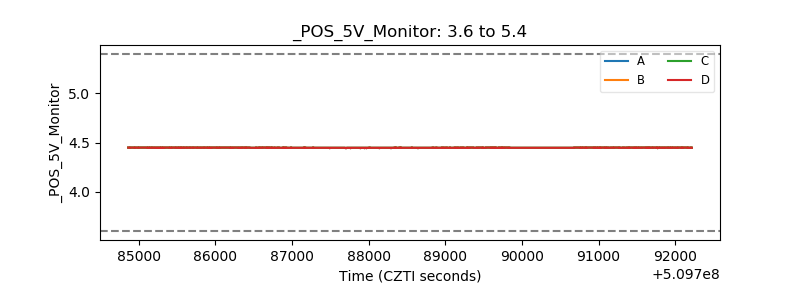 |
| _ROLL_ROT |  |
| _Roll_DEC |  |
| _Roll_RA |  |
| Veto Counter |  |