| Param | Original file | Final file |
|---|---|---|
| Filename | modeM0/AS1A14_083T05_9000006554_56350cztM0_level2.fits | modeM0/AS1A14_083T05_9000006554_56350cztM0_level2_quad_clean.evt |
| Size (bytes) | 943,583,040 | 85,164,480 |
| Size | 899.9 MB | 81.2 MB |
| Events in quadrant A | 5,548,906 | 652,317 |
| Events in quadrant B | 6,326,000 | 664,222 |
| Events in quadrant C | 6,048,258 | 622,059 |
| Events in quadrant D | 16,434,840 | 127,559 |
| Mode M9 | |||
|---|---|---|---|
| Quadrant | BADHDUFLAG | Total packets | Discarded packets |
| A | 0 | 4 | 0 |
| B | 0 | 5 | 0 |
| C | 0 | 5 | 0 |
| D | 0 | 5 | 0 |
| Mode SS | |||
|---|---|---|---|
| Quadrant | BADHDUFLAG | Total packets | Discarded packets |
| A | 0 | 150 | 0 |
| B | 0 | 150 | 0 |
| C | 0 | 150 | 0 |
| D | 0 | 150 | 0 |
| Mode M0 | |||
|---|---|---|---|
| Quadrant | BADHDUFLAG | Total packets | Discarded packets |
| A | 0 | 21504 | 2 |
| B | 0 | 23780 | 2 |
| C | 0 | 23031 | 2 |
| D | 0 | 53905 | 2 |
| Quadrant | Total seconds | Saturated seconds | Saturation percentage |
|---|---|---|---|
| A | 7357 | 657 | 8.930270% |
| B | 7357 | 1134 | 15.413892% |
| C | 7357 | 844 | 11.472067% |
| D | 7357 | 6018 | 81.799647% |
Noise dominated data is calculated using 1-second bins in cleaned event files. If a bin has >2000 counts, and if more than 50% of those come from <1% of pixels, then it is considered to be noise-dominated and hence unusable.
| Quadrant | # 1 sec bins | Bins with >0 counts | Bins with >2000 counts | High rate bins dominated by noise | Noise dominated (total time) | Noise dominated (detector-on time) | Marked lightcurve |
|---|---|---|---|---|---|---|---|
| A | 7807 | 7357 | 290 | 290 | 3.71% | 3.94% |  |
| B | 7807 | 7357 | 659 | 659 | 8.44% | 8.96% |  |
| C | 7807 | 7359 | 550 | 550 | 7.04% | 7.47% |  |
| D | 7806 | 7357 | 5625 | 5625 | 72.06% | 76.46% |  |
Top three noisy pixels from each quadrant. If the there are fewer than three noisy pixels in the level2.evt file, extra rows are filled as -1
| Pixel properties | Quadrant properties | ||||||
|---|---|---|---|---|---|---|---|
| Quadrant | DetID | PixID | Counts | Sigma | Mean | Median | Sigma |
| A | 4 | 95 | 798830 | 3995.28 | 801 | 778 | 199.7 |
| A | 3 | 78 | 462931 | 2313.67 | 801 | 778 | 199.7 |
| A | 1 | 191 | 351136 | 1753.99 | 801 | 778 | 199.7 |
| B | 5 | 172 | 1757398 | 10958.9 | 746 | 718 | 160.3 |
| B | 5 | 185 | 710373 | 4427.12 | 746 | 718 | 160.3 |
| B | 4 | 171 | 192322 | 1195.31 | 746 | 718 | 160.3 |
| C | 15 | 230 | 1171902 | 5603.56 | 767 | 761 | 209.0 |
| C | 12 | 254 | 871212 | 4164.85 | 767 | 761 | 209.0 |
| C | 13 | 3 | 494516 | 2362.47 | 767 | 761 | 209.0 |
| D | 2 | 62 | 10966201 | 83109.22 | 464 | 441 | 131.9 |
| D | 8 | 129 | 1755393 | 13300.74 | 464 | 441 | 131.9 |
| D | 12 | 3 | 754836 | 5717.54 | 464 | 441 | 131.9 |
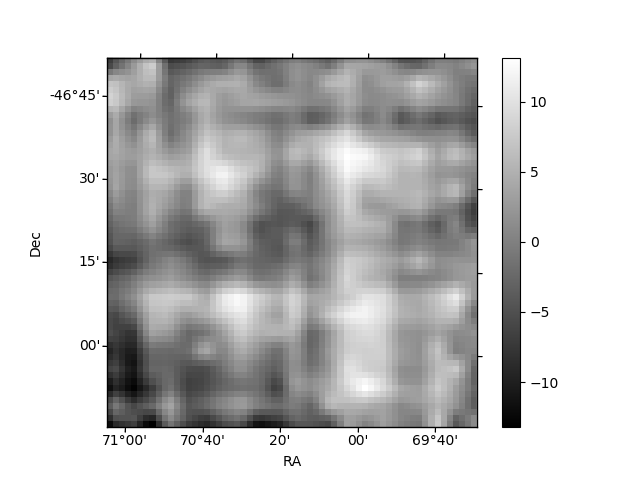
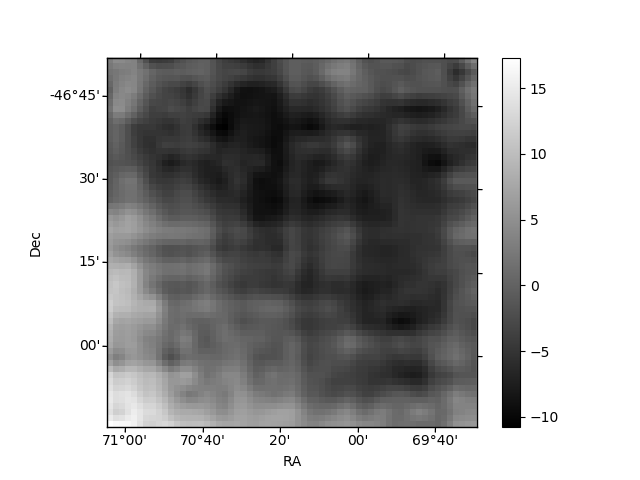
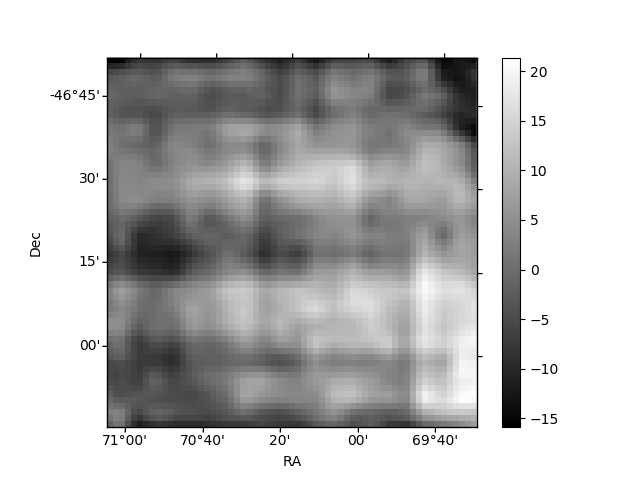
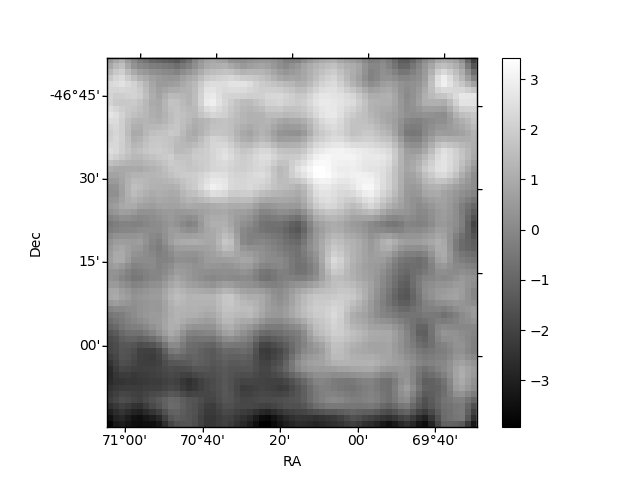
Histogram calculated using DETX and DETY for each event in the final _common_clean file
| Quadrant A | 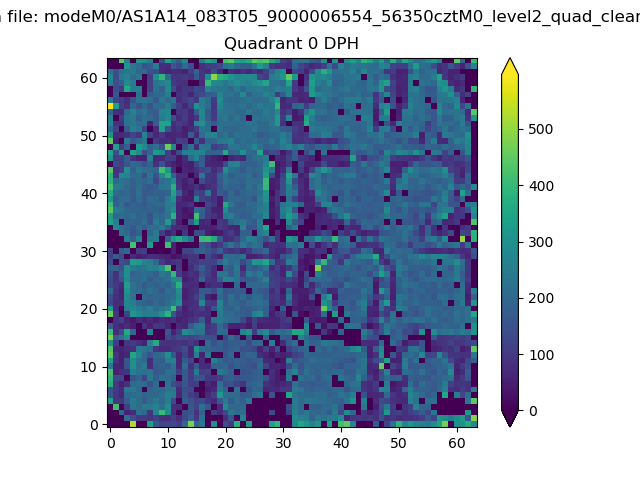 |
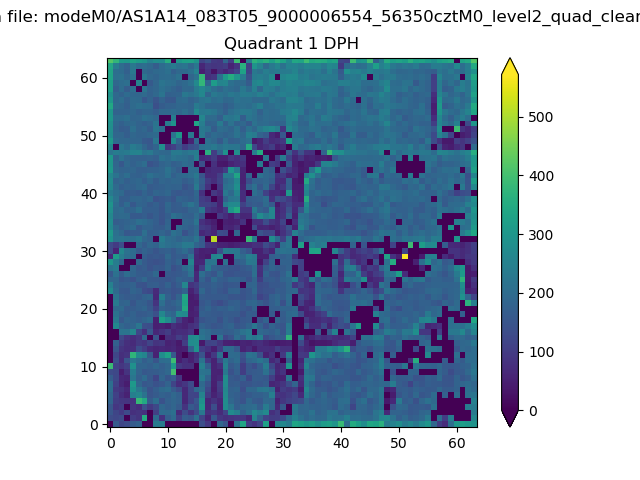 |
Quadrant B |
|---|---|---|---|
| Quadrant D | 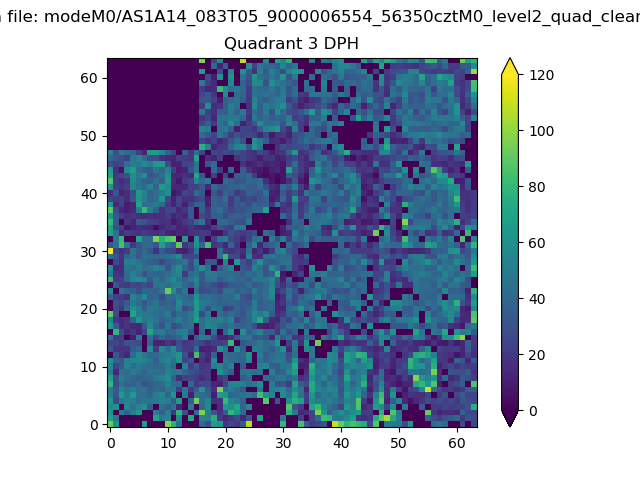 |
 |
Quadrant C |
| Plot type | Count rate plots | Images |
|---|---|---|
| Comparison with Poisson distribution Blue bars denote a histogram of data divided into 1 sec bins. Red curve is a Poisson curve with rate = median count rate of data. |
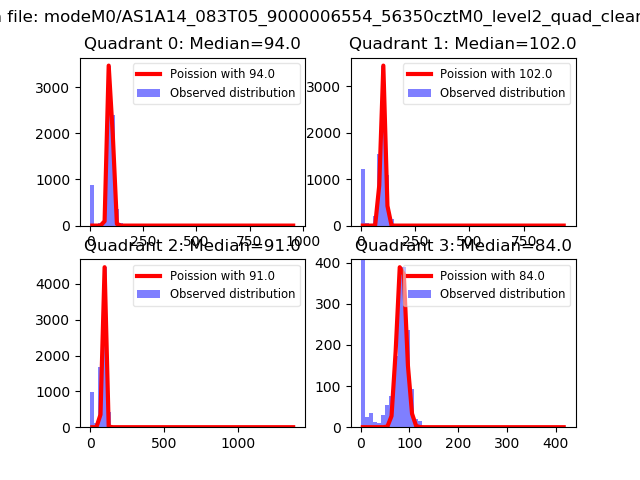 |
 |
| Quadrant-wise count rates Data is divided into 100 sec bins |
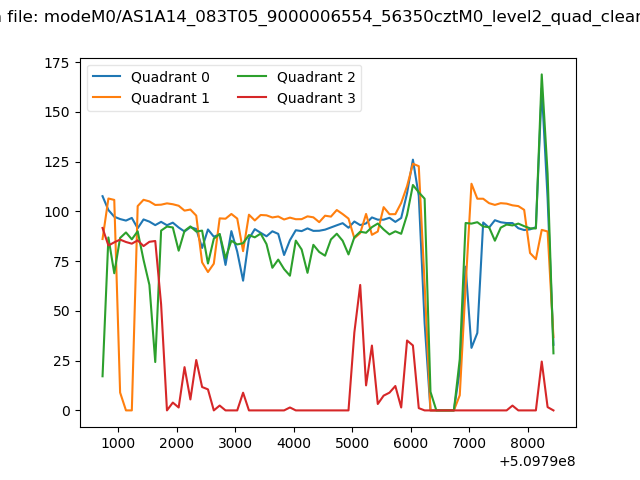 |
|
| Module-wise count rates for Quadrant A Data is divided into 100 sec bins |
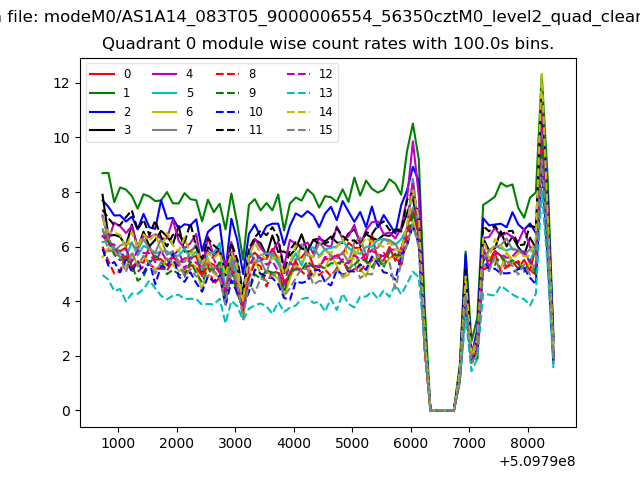 |
 |
| Module-wise count rates for Quadrant B Data is divided into 100 sec bins |
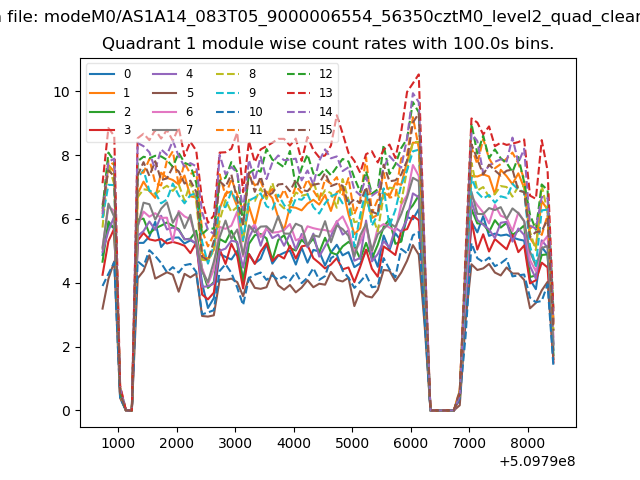 |
 |
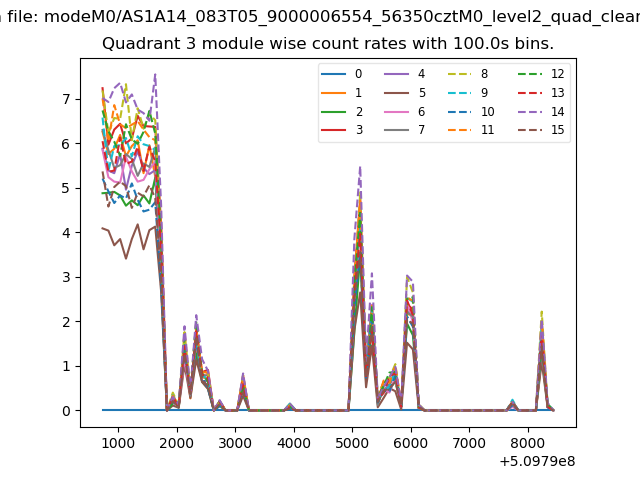
| Module-wise count rates for Quadrant C Data is divided into 100 sec bins |
 |
 |
| Module-wise count rates for Quadrant D Data is divided into 100 sec bins |
 |
 |
| Parameter | Plot |
|---|---|
| CZT HV Monitor | 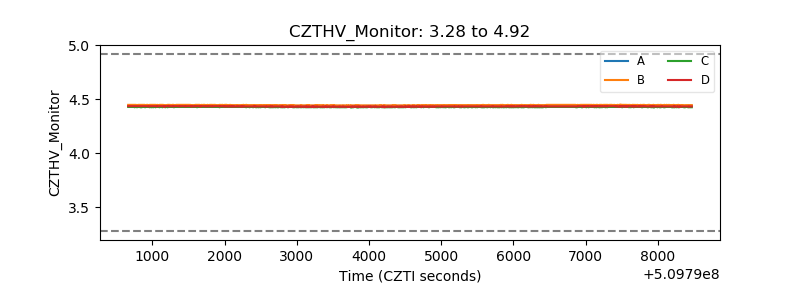 |
| D_VDD | 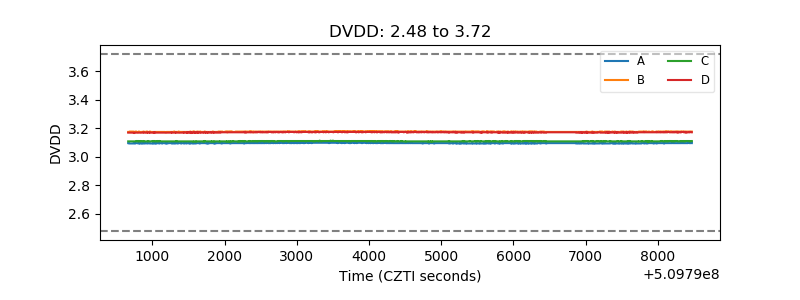 |
| Temperature 1 | 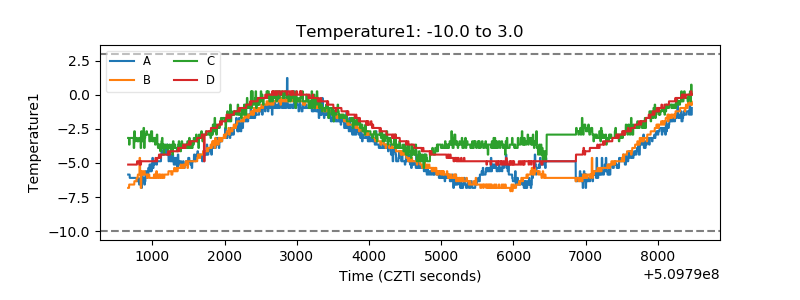 |
| Veto HV Monitor |  |
| Veto LLD |  |
| Alpha Counter | 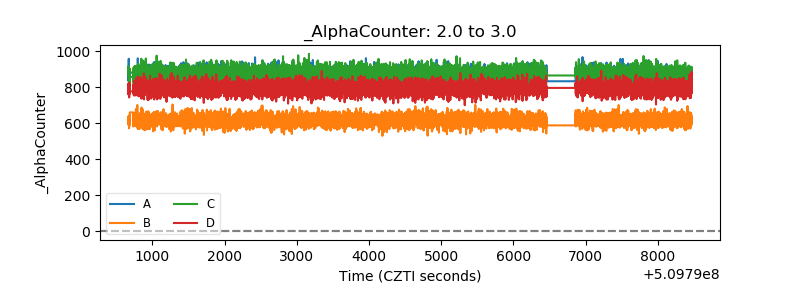 |
| _CPM_Rate | 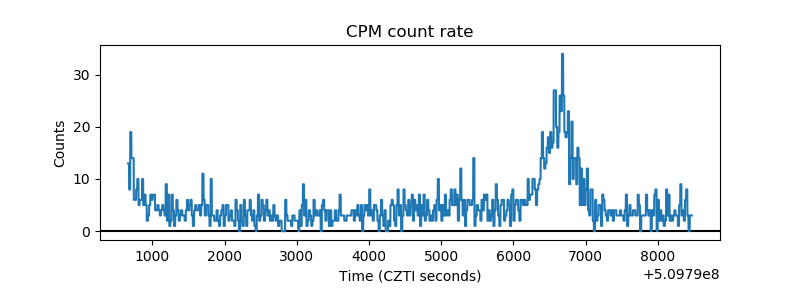 |
| CZT Counter |  |
| +2.5 Volts monitor |  |
| +5 Volts monitor | 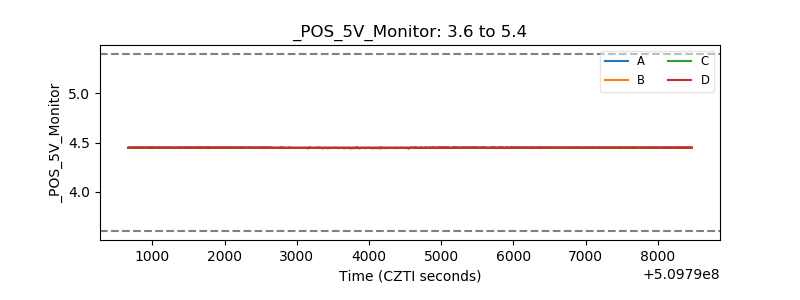 |
| _ROLL_ROT |  |
| _Roll_DEC |  |
| _Roll_RA |  |
| Veto Counter |  |