| Param | Original file | Final file |
|---|---|---|
| Filename | modeM0/AS1A14_083T05_9000006554_56351cztM0_level2.fits | modeM0/AS1A14_083T05_9000006554_56351cztM0_level2_quad_clean.evt |
| Size (bytes) | 930,640,320 | 85,959,360 |
| Size | 887.5 MB | 82.0 MB |
| Events in quadrant A | 6,168,319 | 639,185 |
| Events in quadrant B | 4,704,292 | 718,137 |
| Events in quadrant C | 7,825,441 | 559,883 |
| Events in quadrant D | 15,189,587 | 180,007 |
| Mode SS | |||
|---|---|---|---|
| Quadrant | BADHDUFLAG | Total packets | Discarded packets |
| A | 0 | 146 | 0 |
| B | 0 | 146 | 0 |
| C | 0 | 146 | 0 |
| D | 0 | 146 | 0 |
| Mode M0 | |||
|---|---|---|---|
| Quadrant | BADHDUFLAG | Total packets | Discarded packets |
| A | 0 | 23419 | 2 |
| B | 0 | 18970 | 0 |
| C | 0 | 28298 | 0 |
| D | 0 | 50162 | 0 |
| Quadrant | Total seconds | Saturated seconds | Saturation percentage |
|---|---|---|---|
| A | 7253 | 711 | 9.802840% |
| B | 7254 | 399 | 5.500414% |
| C | 7254 | 1479 | 20.388751% |
| D | 7254 | 5464 | 75.323959% |
Noise dominated data is calculated using 1-second bins in cleaned event files. If a bin has >2000 counts, and if more than 50% of those come from <1% of pixels, then it is considered to be noise-dominated and hence unusable.
| Quadrant | # 1 sec bins | Bins with >0 counts | Bins with >2000 counts | High rate bins dominated by noise | Noise dominated (total time) | Noise dominated (detector-on time) | Marked lightcurve |
|---|---|---|---|---|---|---|---|
| A | 7253 | 7253 | 607 | 607 | 8.37% | 8.37% | 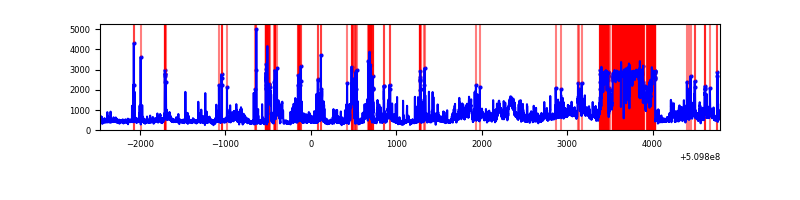 |
| B | 7254 | 7254 | 240 | 240 | 3.31% | 3.31% |  |
| C | 7254 | 7254 | 1221 | 1221 | 16.83% | 16.83% |  |
| D | 7254 | 7254 | 4710 | 4710 | 64.93% | 64.93% |  |
Top three noisy pixels from each quadrant. If the there are fewer than three noisy pixels in the level2.evt file, extra rows are filled as -1
| Pixel properties | Quadrant properties | ||||||
|---|---|---|---|---|---|---|---|
| Quadrant | DetID | PixID | Counts | Sigma | Mean | Median | Sigma |
| A | 4 | 249 | 1297924 | 7008.88 | 747 | 727 | 185.1 |
| A | 4 | 95 | 709386 | 3828.95 | 747 | 727 | 185.1 |
| A | 8 | 25 | 266662 | 1436.87 | 747 | 727 | 185.1 |
| B | 5 | 185 | 741886 | 4510.12 | 774 | 745 | 164.3 |
| B | 4 | 206 | 180331 | 1092.85 | 774 | 745 | 164.3 |
| B | 4 | 171 | 141618 | 857.27 | 774 | 745 | 164.3 |
| C | 12 | 254 | 2773007 | 14275.77 | 705 | 699 | 194.2 |
| C | 15 | 230 | 968572 | 4983.98 | 705 | 699 | 194.2 |
| C | 13 | 3 | 548703 | 2821.9 | 705 | 699 | 194.2 |
| D | 8 | 129 | 7346854 | 53621.98 | 466 | 441 | 137.0 |
| D | 2 | 62 | 4840618 | 35328.79 | 466 | 441 | 137.0 |
| D | 6 | 239 | 388153 | 2829.93 | 466 | 441 | 137.0 |
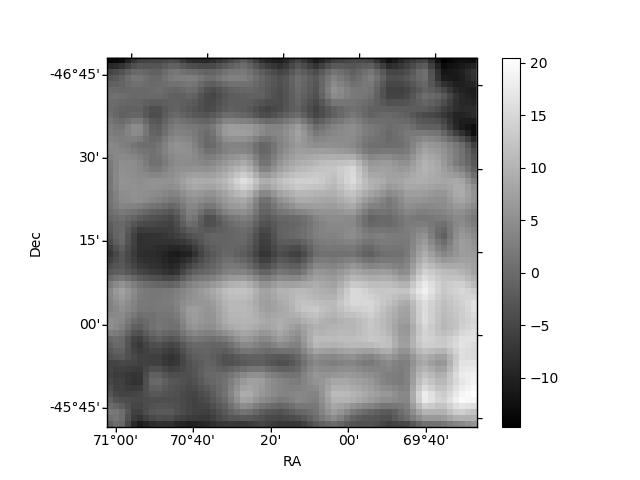
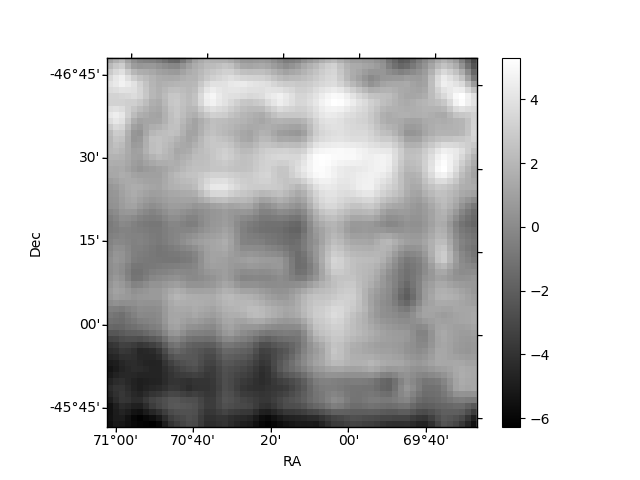
Histogram calculated using DETX and DETY for each event in the final _common_clean file
| Quadrant A |  |
 |
Quadrant B |
|---|---|---|---|
| Quadrant D | 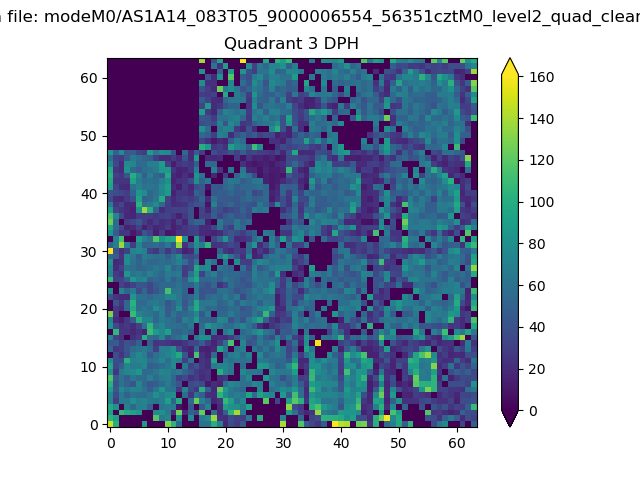 |
 |
Quadrant C |
| Plot type | Count rate plots | Images |
|---|---|---|
| Comparison with Poisson distribution Blue bars denote a histogram of data divided into 1 sec bins. Red curve is a Poisson curve with rate = median count rate of data. |
 |
 |
| Quadrant-wise count rates Data is divided into 100 sec bins |
 |
|
| Module-wise count rates for Quadrant A Data is divided into 100 sec bins |
 |
 |
| Module-wise count rates for Quadrant B Data is divided into 100 sec bins |
 |
 |
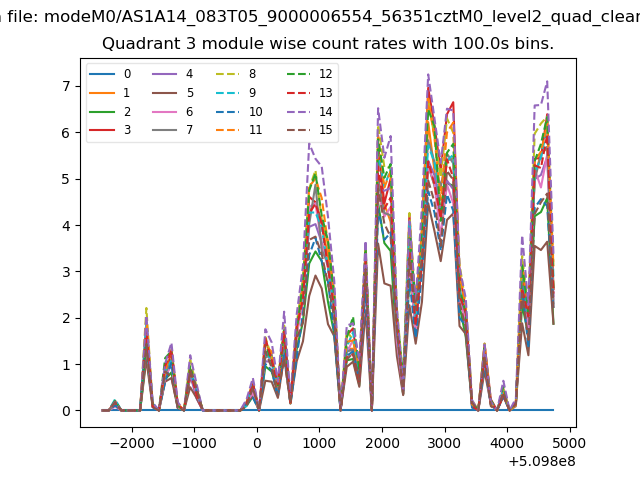
| Module-wise count rates for Quadrant C Data is divided into 100 sec bins |
 |
 |
| Module-wise count rates for Quadrant D Data is divided into 100 sec bins |
 |
 |
| Parameter | Plot |
|---|---|
| CZT HV Monitor | 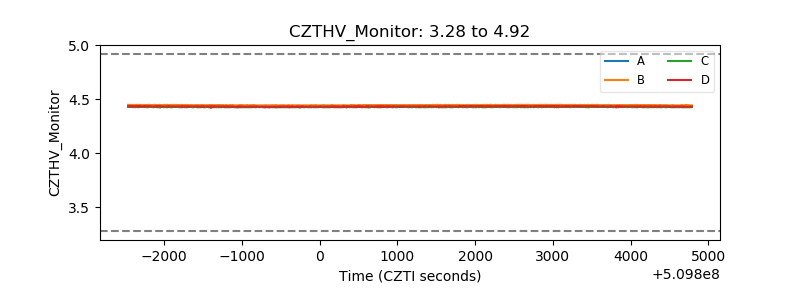 |
| D_VDD |  |
| Temperature 1 | 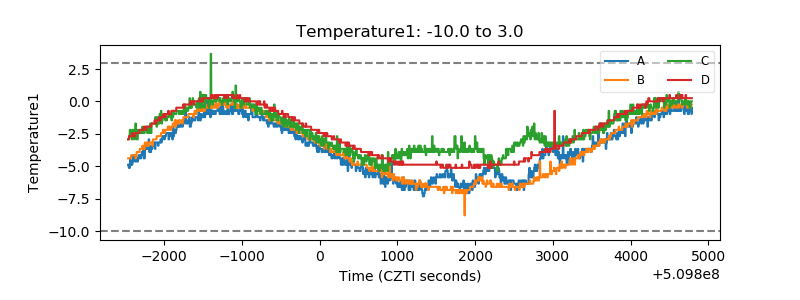 |
| Veto HV Monitor | 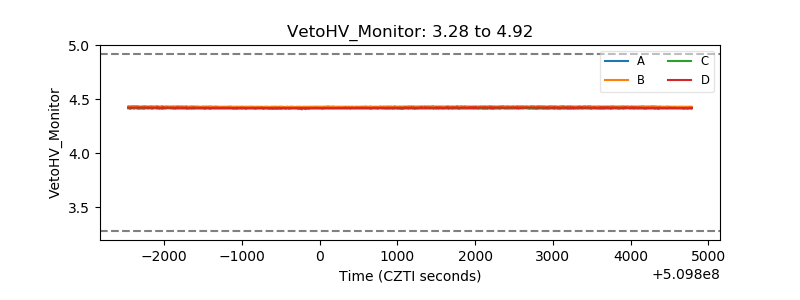 |
| Veto LLD |  |
| Alpha Counter |  |
| _CPM_Rate | 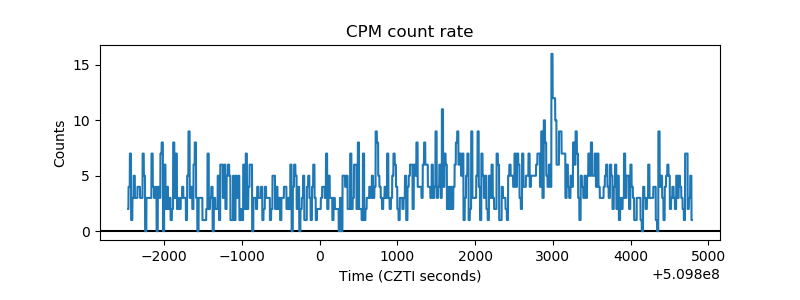 |
| CZT Counter | 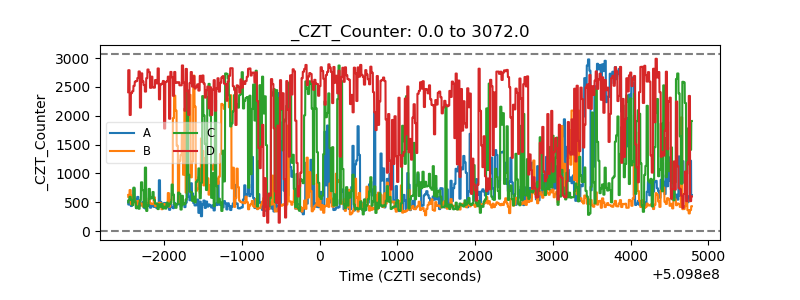 |
| +2.5 Volts monitor | 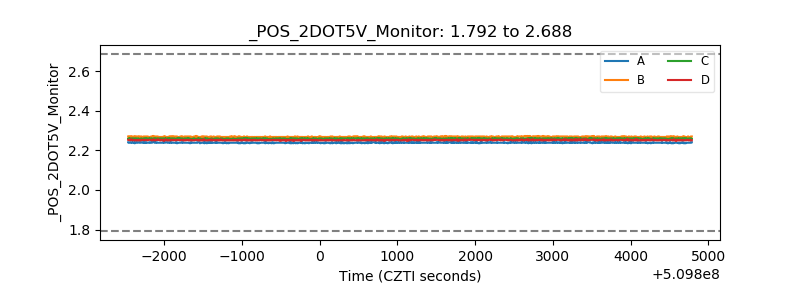 |
| +5 Volts monitor | 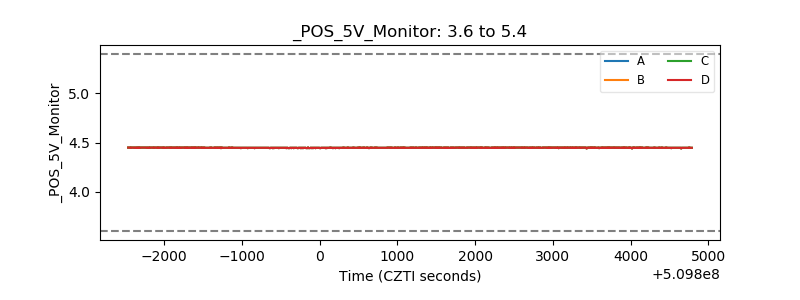 |
| _ROLL_ROT | 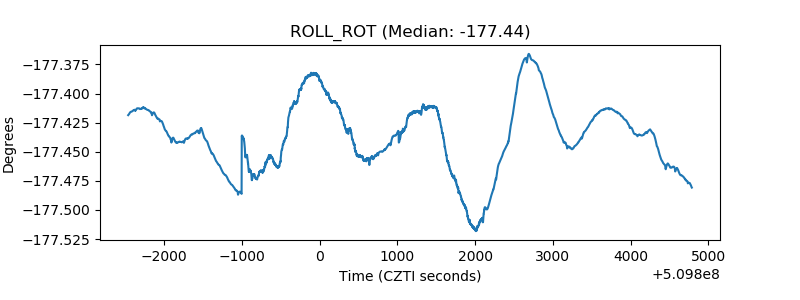 |
| _Roll_DEC | 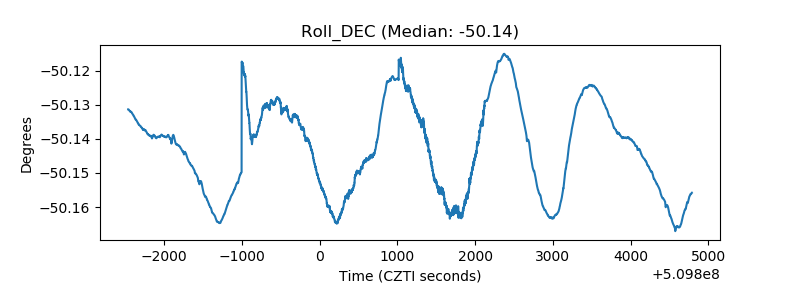 |
| _Roll_RA |  |
| Veto Counter | 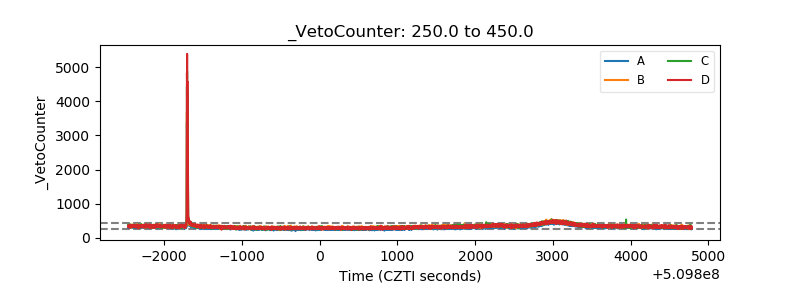 |