| Param | Original file | Final file |
|---|---|---|
| Filename | modeM0/AS1A14_083T05_9000006554_56352cztM0_level2.fits | modeM0/AS1A14_083T05_9000006554_56352cztM0_level2_quad_clean.evt |
| Size (bytes) | 787,631,040 | 97,657,920 |
| Size | 751.1 MB | 93.1 MB |
| Events in quadrant A | 6,023,380 | 665,162 |
| Events in quadrant B | 4,270,193 | 745,587 |
| Events in quadrant C | 8,349,813 | 572,004 |
| Events in quadrant D | 9,938,393 | 457,599 |
| Mode SS | |||
|---|---|---|---|
| Quadrant | BADHDUFLAG | Total packets | Discarded packets |
| A | 0 | 148 | 0 |
| B | 0 | 148 | 0 |
| C | 0 | 148 | 0 |
| D | 0 | 148 | 0 |
| Mode M0 | |||
|---|---|---|---|
| Quadrant | BADHDUFLAG | Total packets | Discarded packets |
| A | 0 | 23058 | 0 |
| B | 0 | 17750 | 0 |
| C | 0 | 29953 | 0 |
| D | 0 | 34765 | 4 |
| Quadrant | Total seconds | Saturated seconds | Saturation percentage |
|---|---|---|---|
| A | 7417 | 480 | 6.471619% |
| B | 7417 | 149 | 2.008898% |
| C | 7417 | 1362 | 18.363220% |
| D | 7416 | 2263 | 30.515102% |
Noise dominated data is calculated using 1-second bins in cleaned event files. If a bin has >2000 counts, and if more than 50% of those come from <1% of pixels, then it is considered to be noise-dominated and hence unusable.
| Quadrant | # 1 sec bins | Bins with >0 counts | Bins with >2000 counts | High rate bins dominated by noise | Noise dominated (total time) | Noise dominated (detector-on time) | Marked lightcurve |
|---|---|---|---|---|---|---|---|
| A | 7417 | 7417 | 456 | 456 | 6.15% | 6.15% | 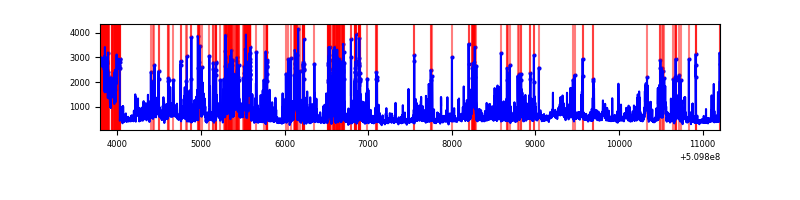 |
| B | 7417 | 7417 | 81 | 81 | 1.09% | 1.09% |  |
| C | 7417 | 7417 | 1265 | 1265 | 17.06% | 17.06% | 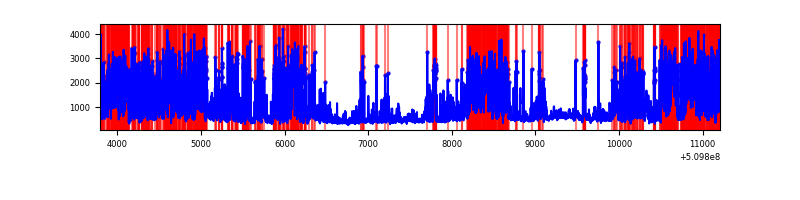 |
| D | 7415 | 7415 | 1671 | 1671 | 22.54% | 22.54% |  |
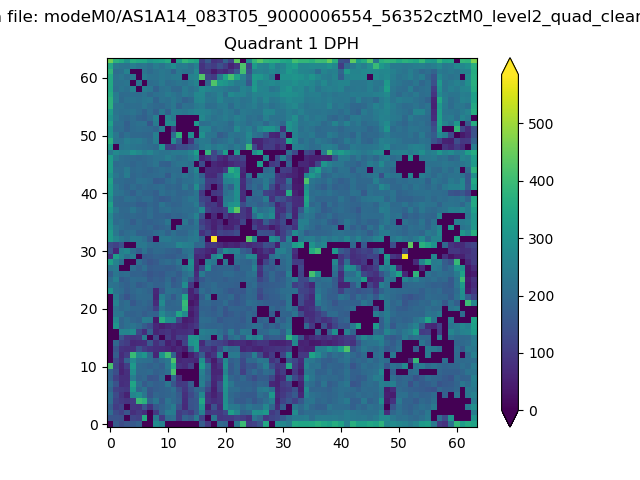
Top three noisy pixels from each quadrant. If the there are fewer than three noisy pixels in the level2.evt file, extra rows are filled as -1
| Pixel properties | Quadrant properties | ||||||
|---|---|---|---|---|---|---|---|
| Quadrant | DetID | PixID | Counts | Sigma | Mean | Median | Sigma |
| A | 4 | 249 | 526791 | 2709.55 | 771 | 751 | 194.1 |
| A | 0 | 8 | 502964 | 2586.82 | 771 | 751 | 194.1 |
| A | 7 | 64 | 310383 | 1594.87 | 771 | 751 | 194.1 |
| B | 4 | 206 | 359021 | 2153.22 | 780 | 750 | 166.4 |
| B | 5 | 185 | 295777 | 1773.12 | 780 | 750 | 166.4 |
| B | 10 | 247 | 108754 | 649.11 | 780 | 750 | 166.4 |
| C | 12 | 254 | 3545246 | 18078.32 | 708 | 702 | 196.1 |
| C | 12 | 252 | 657526 | 3350.01 | 708 | 702 | 196.1 |
| C | 15 | 230 | 376819 | 1918.32 | 708 | 702 | 196.1 |
| D | 8 | 129 | 3429550 | 19326.88 | 616 | 587 | 177.4 |
| D | 2 | 62 | 1935754 | 10907.3 | 616 | 587 | 177.4 |
| D | 6 | 239 | 714030 | 4021.22 | 616 | 587 | 177.4 |
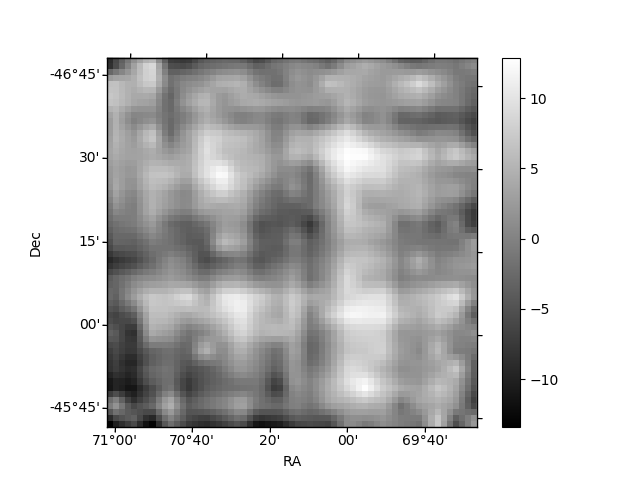
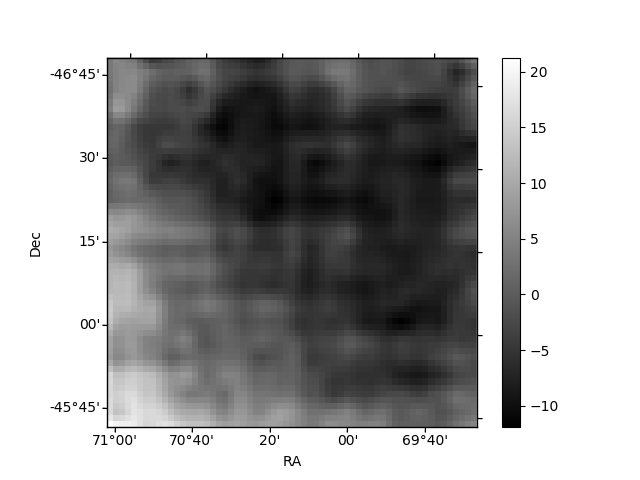
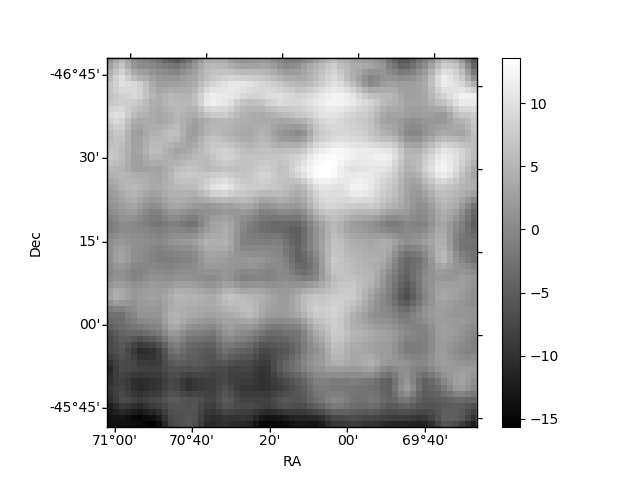
Histogram calculated using DETX and DETY for each event in the final _common_clean file
| Quadrant A | 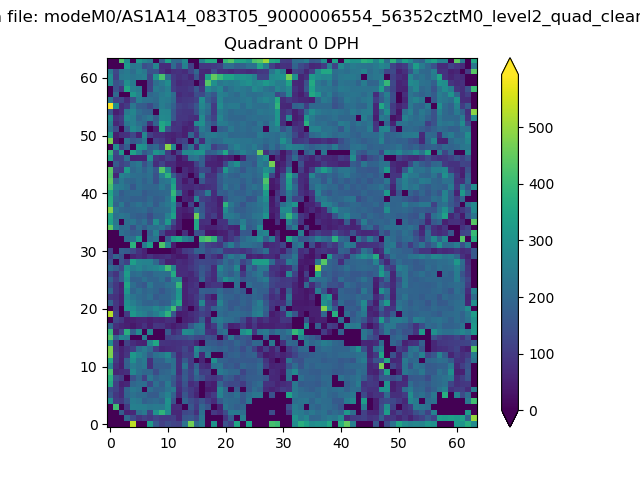 |
 |
Quadrant B |
|---|---|---|---|
| Quadrant D | 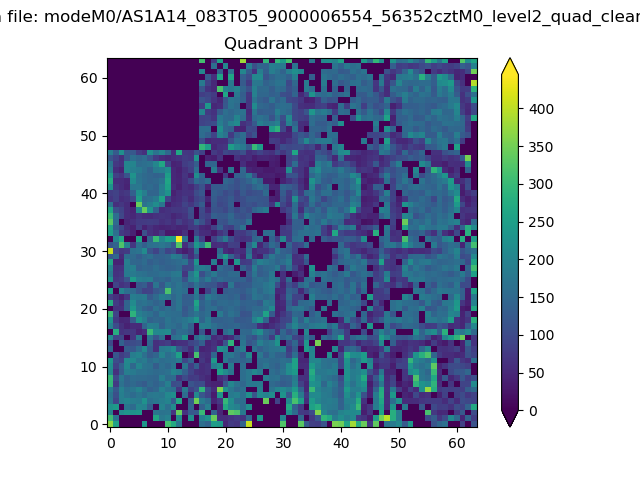 |
 |
Quadrant C |
| Plot type | Count rate plots | Images |
|---|---|---|
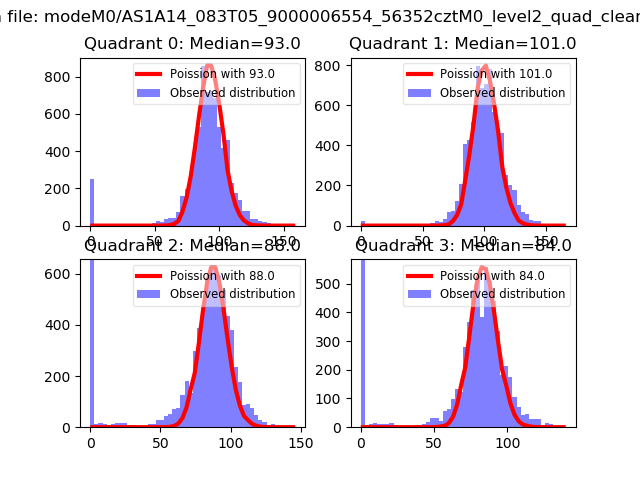
| Comparison with Poisson distribution Blue bars denote a histogram of data divided into 1 sec bins. Red curve is a Poisson curve with rate = median count rate of data. |
 |
 |
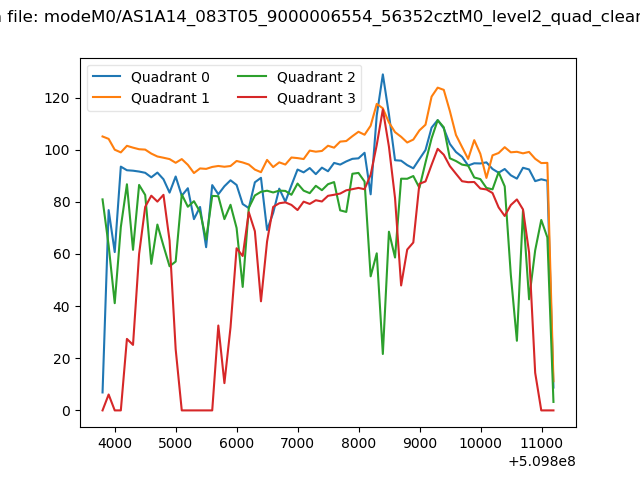
| Quadrant-wise count rates Data is divided into 100 sec bins |
 |
|
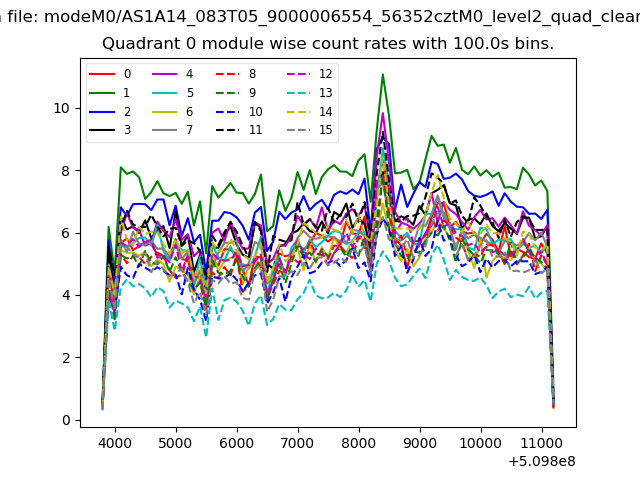
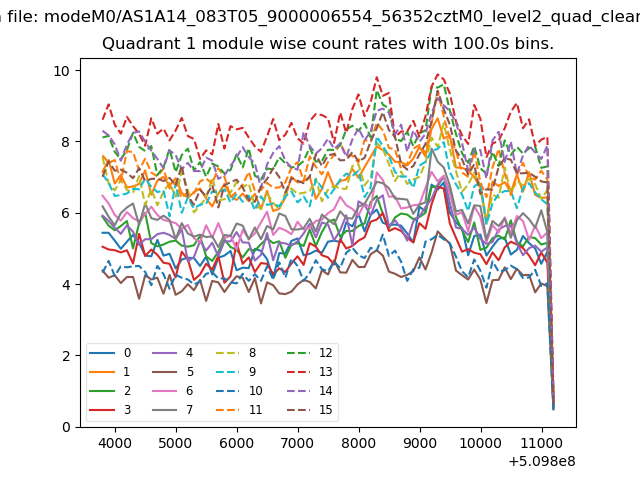
| Module-wise count rates for Quadrant A Data is divided into 100 sec bins |
 |
 |
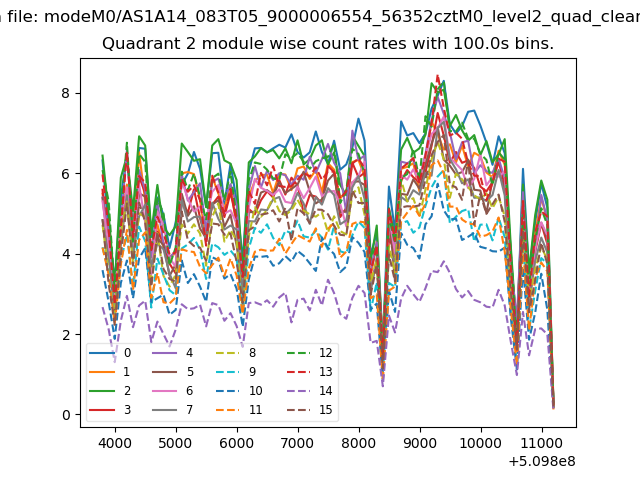
| Module-wise count rates for Quadrant B Data is divided into 100 sec bins |
 |
 |
| Module-wise count rates for Quadrant C Data is divided into 100 sec bins |
 |
 |
| Module-wise count rates for Quadrant D Data is divided into 100 sec bins |
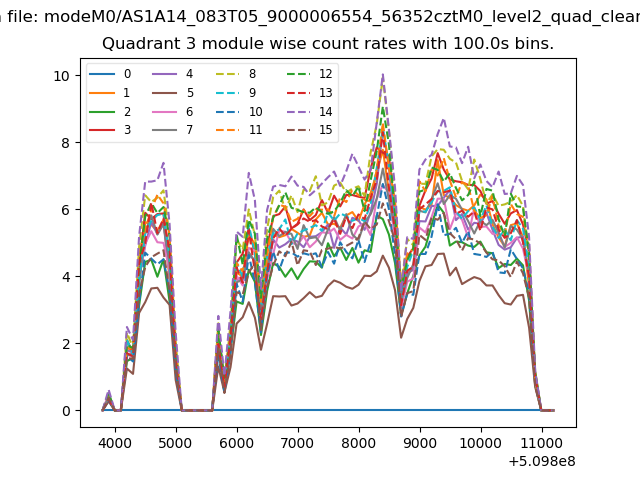 |
 |
| Parameter | Plot |
|---|---|
| CZT HV Monitor |  |
| D_VDD | 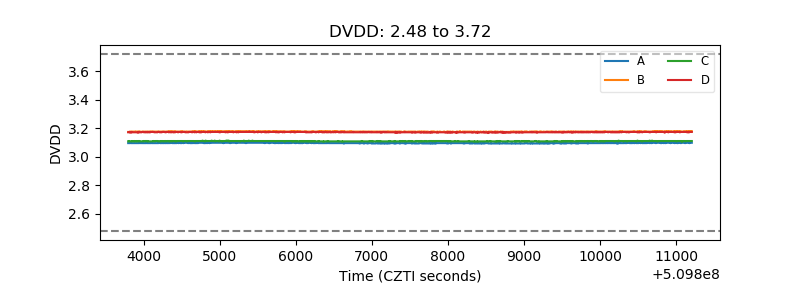 |
| Temperature 1 | 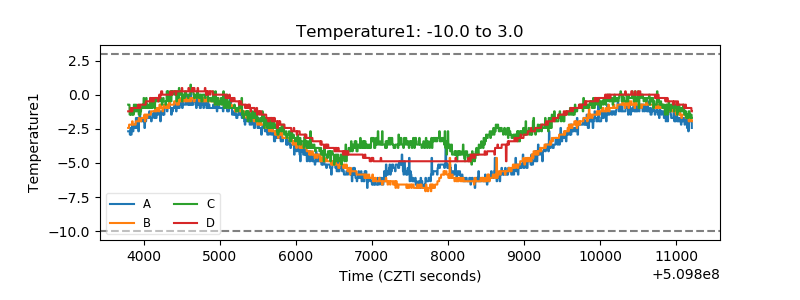 |
| Veto HV Monitor | 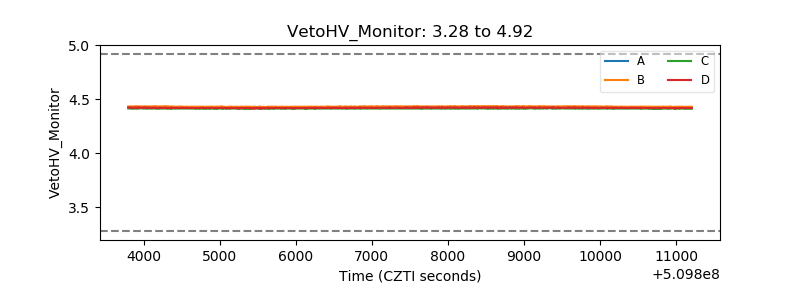 |
| Veto LLD | 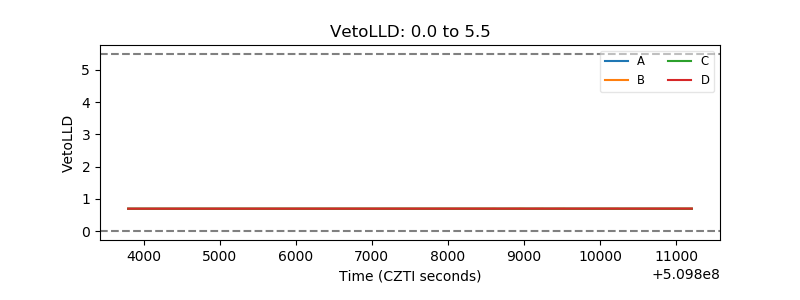 |
| Alpha Counter |  |
| _CPM_Rate |  |
| CZT Counter | 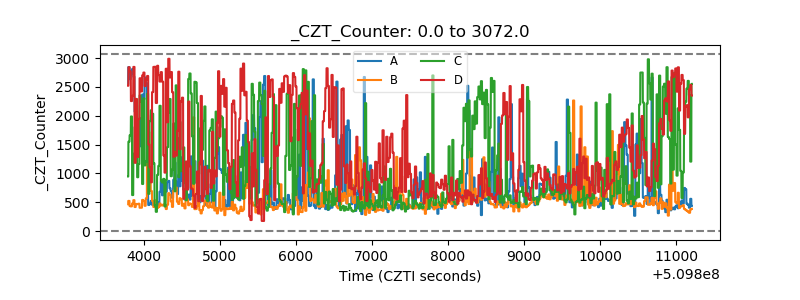 |
| +2.5 Volts monitor | 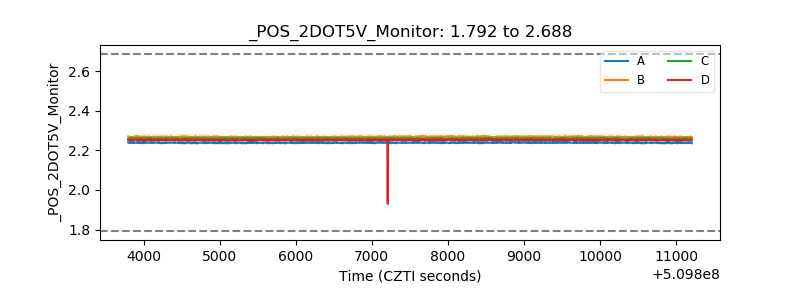 |
| +5 Volts monitor |  |
| _ROLL_ROT | 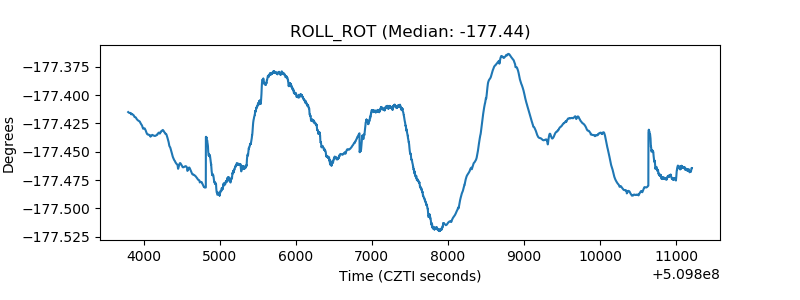 |
| _Roll_DEC | 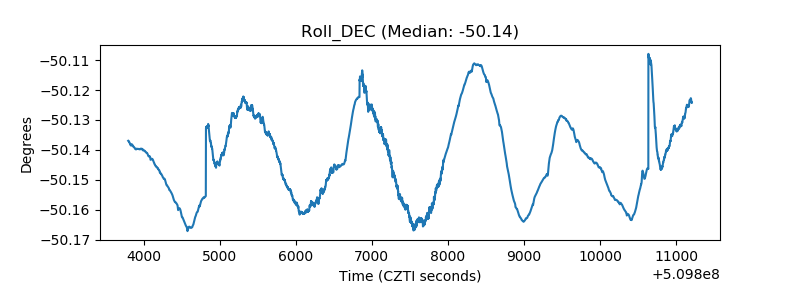 |
| _Roll_RA |  |
| Veto Counter | 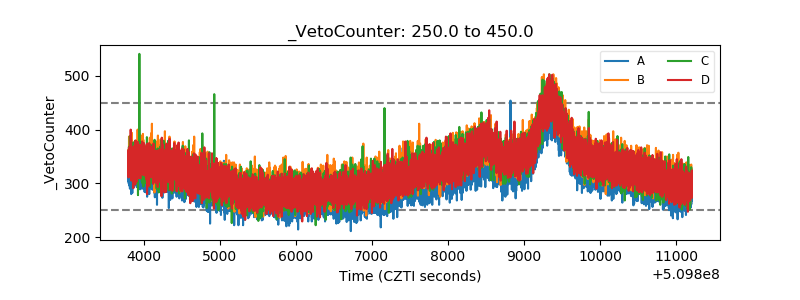 |