| Param | Original file | Final file |
|---|---|---|
| Filename | modeM0/AS1A14_083T05_9000006554_56356cztM0_level2.fits | modeM0/AS1A14_083T05_9000006554_56356cztM0_level2_quad_clean.evt |
| Size (bytes) | 3,360,375,360 | 252,472,320 |
| Size | 3.1 GB | 240.8 MB |
| Events in quadrant A | 22,023,878 | 1,918,397 |
| Events in quadrant B | 17,642,384 | 2,212,171 |
| Events in quadrant C | 24,817,924 | 1,806,761 |
| Events in quadrant D | 58,053,712 | 50,974 |
| Mode M9 | |||
|---|---|---|---|
| Quadrant | BADHDUFLAG | Total packets | Discarded packets |
| A | 0 | 15 | 0 |
| B | 0 | 15 | 0 |
| C | 0 | 15 | 0 |
| D | 0 | 15 | 0 |
| Mode SS | |||
|---|---|---|---|
| Quadrant | BADHDUFLAG | Total packets | Discarded packets |
| A | 0 | 492 | 0 |
| B | 0 | 492 | 0 |
| C | 0 | 492 | 0 |
| D | 0 | 492 | 0 |
| Mode M0 | |||
|---|---|---|---|
| Quadrant | BADHDUFLAG | Total packets | Discarded packets |
| A | 0 | 82430 | 3 |
| B | 0 | 69220 | 3 |
| C | 0 | 90514 | 3 |
| D | 0 | 188899 | 3 |
| Quadrant | Total seconds | Saturated seconds | Saturation percentage |
|---|---|---|---|
| A | 24018 | 3520 | 14.655675% |
| B | 24019 | 2303 | 9.588243% |
| C | 24019 | 4230 | 17.611058% |
| D | 24019 | 23487 | 97.785087% |
Noise dominated data is calculated using 1-second bins in cleaned event files. If a bin has >2000 counts, and if more than 50% of those come from <1% of pixels, then it is considered to be noise-dominated and hence unusable.
| Quadrant | # 1 sec bins | Bins with >0 counts | Bins with >2000 counts | High rate bins dominated by noise | Noise dominated (total time) | Noise dominated (detector-on time) | Marked lightcurve |
|---|---|---|---|---|---|---|---|
| A | 25992 | 24167 | 3085 | 3085 | 11.87% | 12.77% |  |
| B | 25993 | 24297 | 1537 | 1537 | 5.91% | 6.33% |  |
| C | 25993 | 24295 | 3861 | 3861 | 14.85% | 15.89% |  |
| D | 25992 | 24078 | 20618 | 20618 | 79.32% | 85.63% |  |
Top three noisy pixels from each quadrant. If the there are fewer than three noisy pixels in the level2.evt file, extra rows are filled as -1
| Pixel properties | Quadrant properties | ||||||
|---|---|---|---|---|---|---|---|
| Quadrant | DetID | PixID | Counts | Sigma | Mean | Median | Sigma |
| A | 12 | 3 | 4706722 | 7961.7 | 2380 | 2325 | 590.9 |
| A | 3 | 62 | 2333333 | 3944.99 | 2380 | 2325 | 590.9 |
| A | 0 | 8 | 1419880 | 2399.06 | 2380 | 2325 | 590.9 |
| B | 4 | 206 | 5071432 | 9886.79 | 2417 | 2327 | 512.7 |
| B | 5 | 185 | 785852 | 1528.19 | 2417 | 2327 | 512.7 |
| B | 4 | 171 | 513144 | 996.3 | 2417 | 2327 | 512.7 |
| C | 15 | 230 | 8687044 | 14069.39 | 2252 | 2231 | 617.3 |
| C | 12 | 254 | 3146910 | 5094.38 | 2252 | 2231 | 617.3 |
| C | 13 | 3 | 1711120 | 2768.4 | 2252 | 2231 | 617.3 |
| D | 8 | 129 | 51253378 | 364783.79 | 472 | 448 | 140.5 |
| D | 12 | 33 | 2096143 | 14915.74 | 472 | 448 | 140.5 |
| D | 8 | 113 | 662756 | 4713.86 | 472 | 448 | 140.5 |
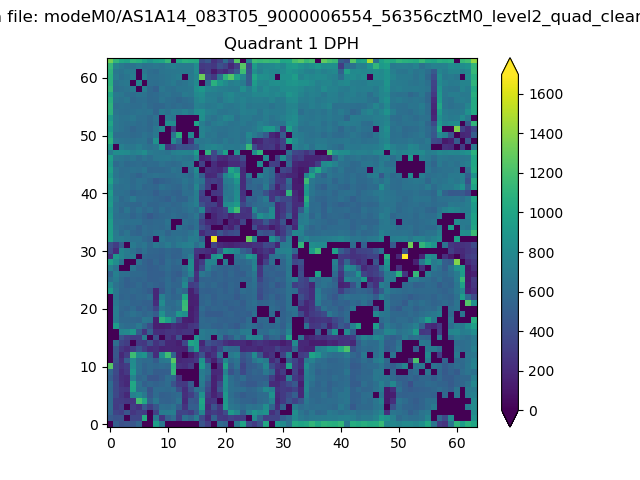
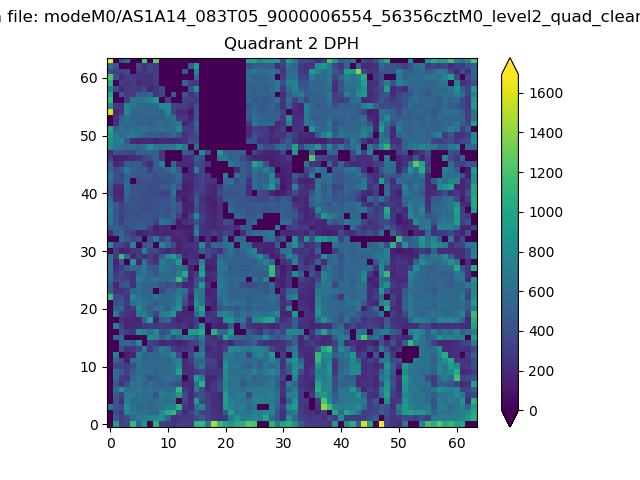
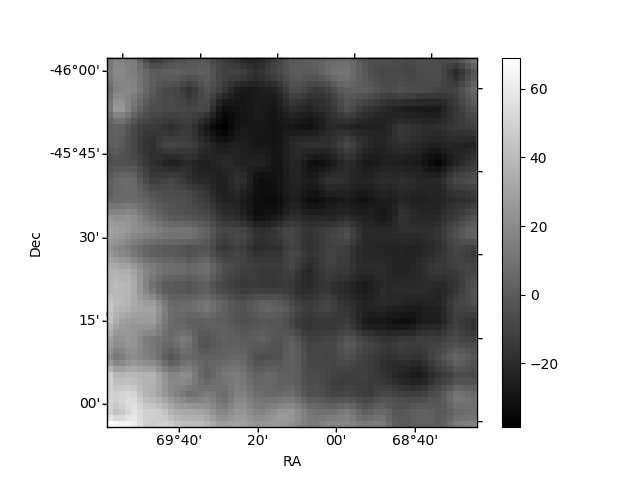
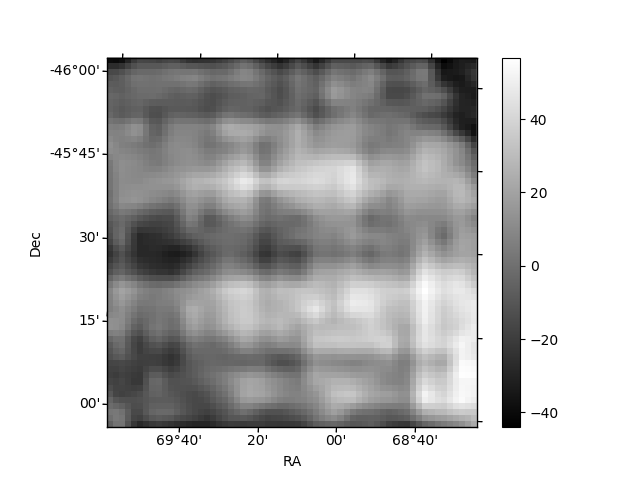
Histogram calculated using DETX and DETY for each event in the final _common_clean file
| Quadrant A |  |
 |
Quadrant B |
|---|---|---|---|
| Quadrant D |  |
 |
Quadrant C |
| Plot type | Count rate plots | Images |
|---|---|---|
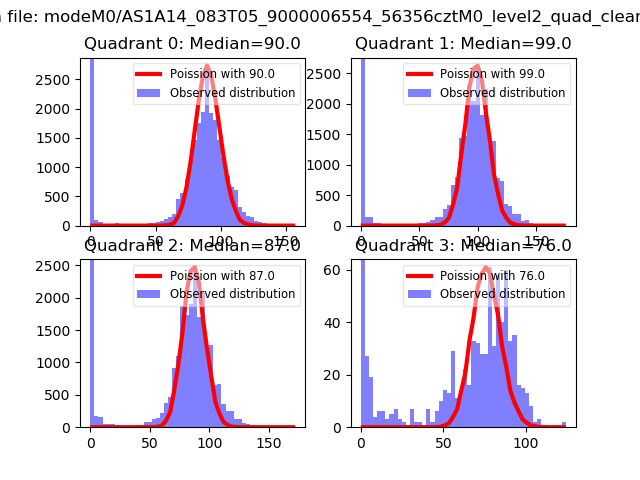
| Comparison with Poisson distribution Blue bars denote a histogram of data divided into 1 sec bins. Red curve is a Poisson curve with rate = median count rate of data. |
 |
 |
| Quadrant-wise count rates Data is divided into 100 sec bins |
 |
|
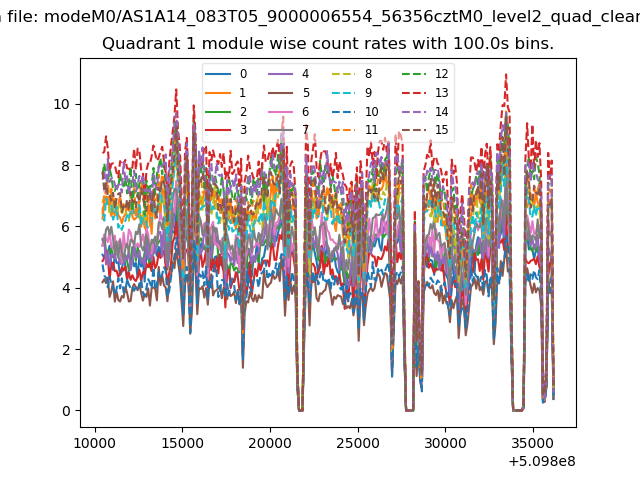
| Module-wise count rates for Quadrant A Data is divided into 100 sec bins |
 |
 |
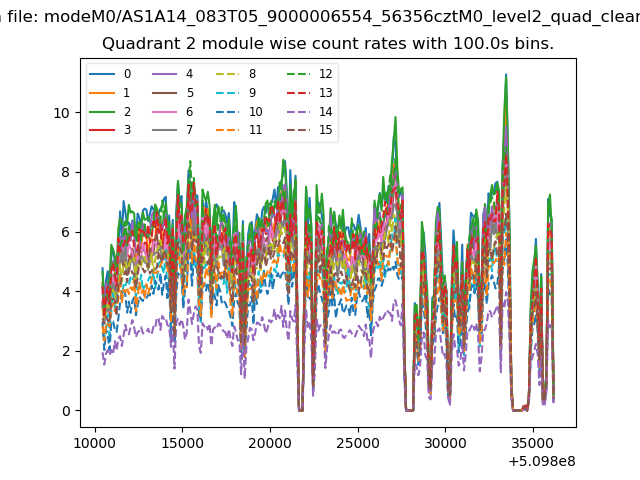
| Module-wise count rates for Quadrant B Data is divided into 100 sec bins |
 |
 |
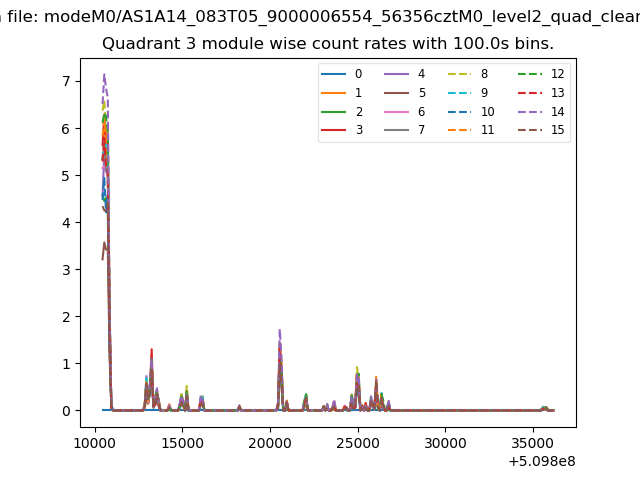
| Module-wise count rates for Quadrant C Data is divided into 100 sec bins |
 |
 |
| Module-wise count rates for Quadrant D Data is divided into 100 sec bins |
 |
 |
| Parameter | Plot |
|---|---|
| CZT HV Monitor | 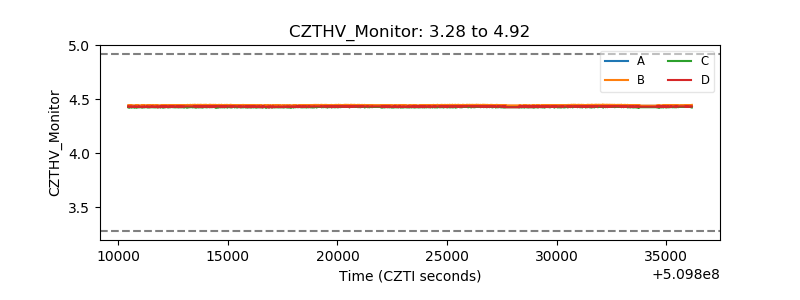 |
| D_VDD |  |
| Temperature 1 | 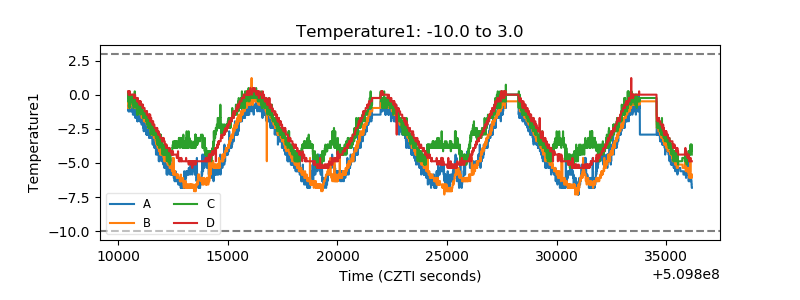 |
| Veto HV Monitor | 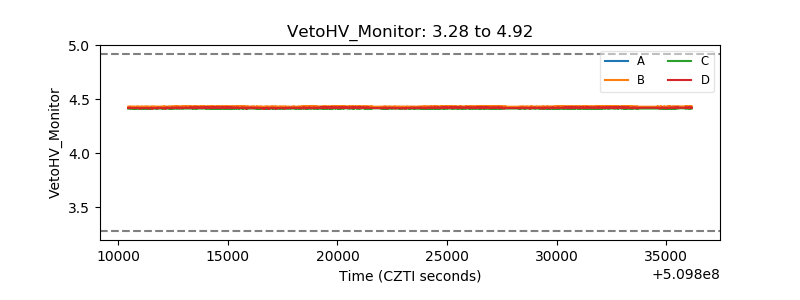 |
| Veto LLD |  |
| Alpha Counter | 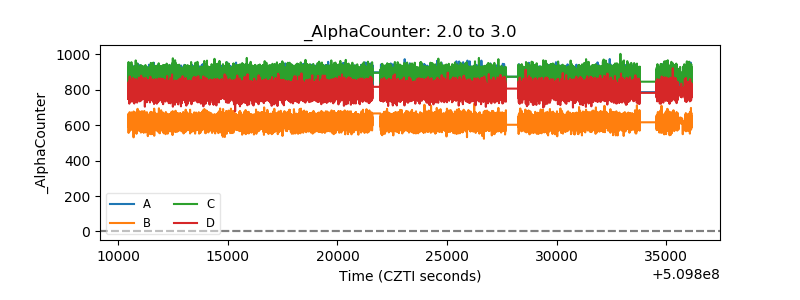 |
| _CPM_Rate | 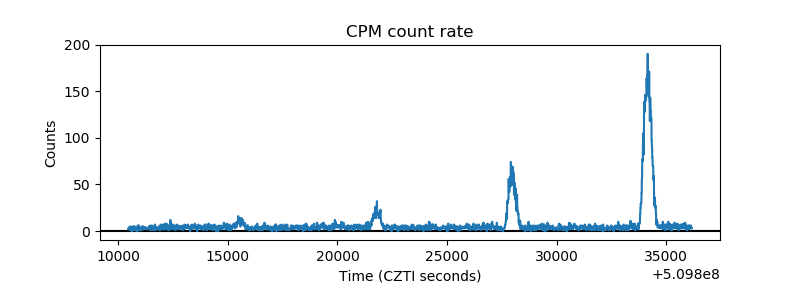 |
| CZT Counter | 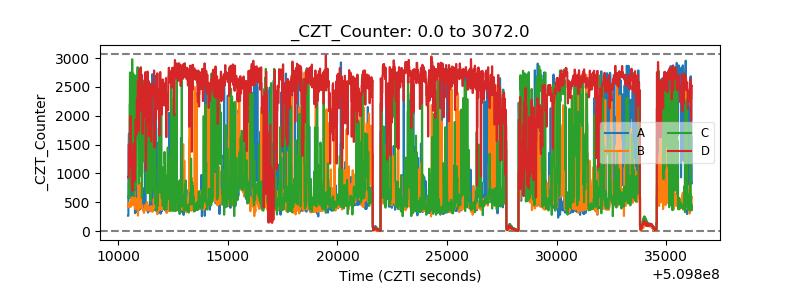 |
| +2.5 Volts monitor | 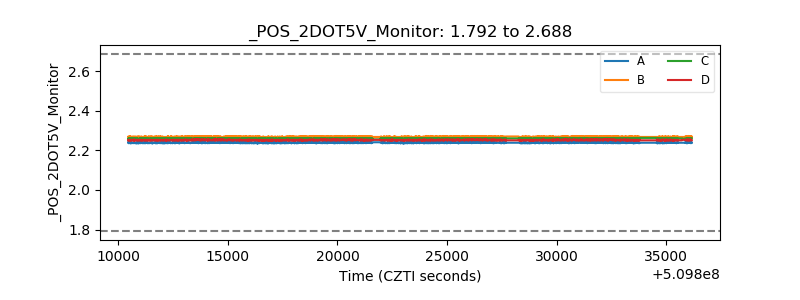 |
| +5 Volts monitor | 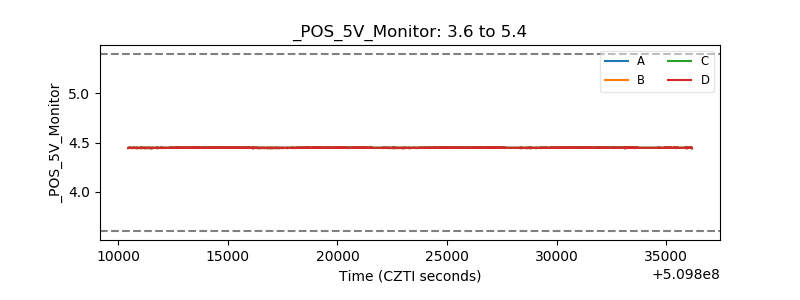 |
| _ROLL_ROT | 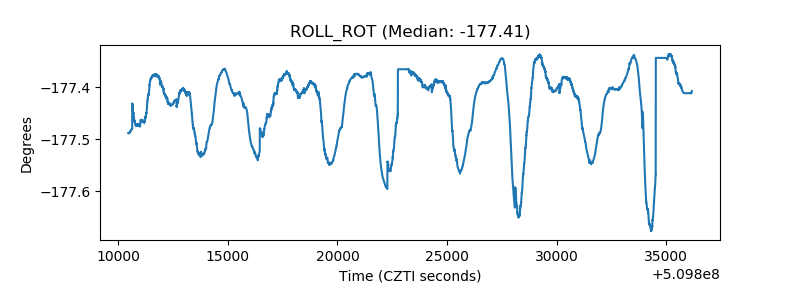 |
| _Roll_DEC | 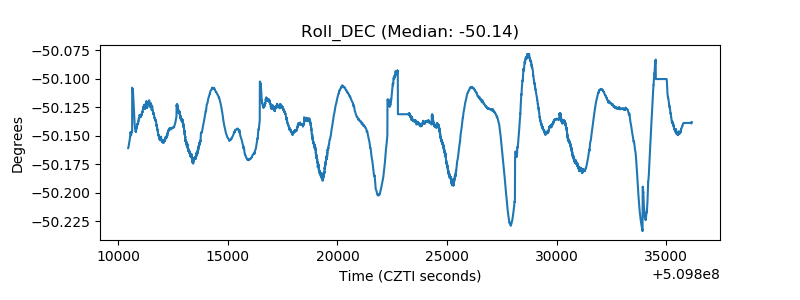 |
| _Roll_RA |  |
| Veto Counter | 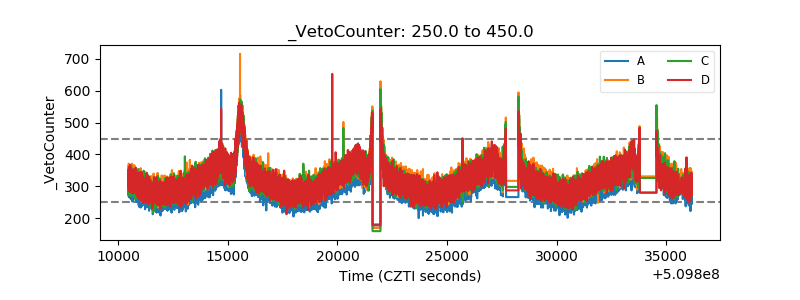 |