| Param | Original file | Final file |
|---|---|---|
| Filename | modeM0/AS1A14_083T05_9000006554_56357cztM0_level2.fits | modeM0/AS1A14_083T05_9000006554_56357cztM0_level2_quad_clean.evt |
| Size (bytes) | 1,105,807,680 | 51,243,840 |
| Size | 1.0 GB | 48.9 MB |
| Events in quadrant A | 13,454,371 | 168,748 |
| Events in quadrant B | 6,186,212 | 477,010 |
| Events in quadrant C | 4,407,915 | 465,379 |
| Events in quadrant D | 16,398,753 | 191 |
| Mode M9 | |||
|---|---|---|---|
| Quadrant | BADHDUFLAG | Total packets | Discarded packets |
| A | 0 | 9 | 0 |
| B | 0 | 9 | 0 |
| C | 0 | 9 | 0 |
| D | 0 | 9 | 0 |
| Mode SS | |||
|---|---|---|---|
| Quadrant | BADHDUFLAG | Total packets | Discarded packets |
| A | 0 | 128 | 0 |
| B | 0 | 128 | 0 |
| C | 0 | 128 | 0 |
| D | 0 | 128 | 0 |
| Mode M0 | |||
|---|---|---|---|
| Quadrant | BADHDUFLAG | Total packets | Discarded packets |
| A | 0 | 44274 | 1 |
| B | 0 | 22813 | 1 |
| C | 0 | 17656 | 2 |
| D | 0 | 52883 | 1 |
| Quadrant | Total seconds | Saturated seconds | Saturation percentage |
|---|---|---|---|
| A | 6299 | 4521 | 71.773297% |
| B | 6300 | 1181 | 18.746032% |
| C | 6299 | 486 | 7.715510% |
| D | 6299 | 6299 | 100.000000% |
Noise dominated data is calculated using 1-second bins in cleaned event files. If a bin has >2000 counts, and if more than 50% of those come from <1% of pixels, then it is considered to be noise-dominated and hence unusable.
| Quadrant | # 1 sec bins | Bins with >0 counts | Bins with >2000 counts | High rate bins dominated by noise | Noise dominated (total time) | Noise dominated (detector-on time) | Marked lightcurve |
|---|---|---|---|---|---|---|---|
| A | 7517 | 6446 | 4342 | 4342 | 57.76% | 67.36% | 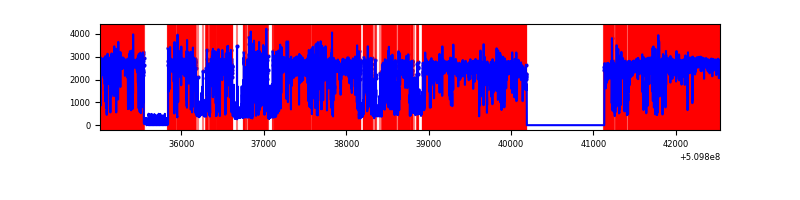 |
| B | 7519 | 6576 | 956 | 956 | 12.71% | 14.54% | 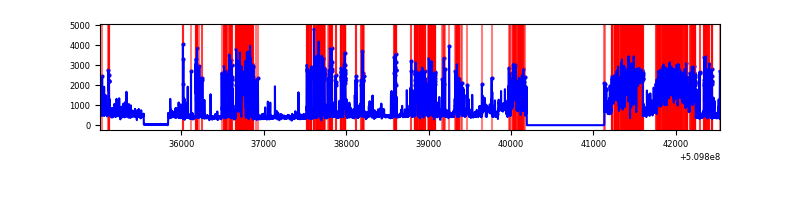 |
| C | 7518 | 6574 | 458 | 458 | 6.09% | 6.97% |  |
| D | 7517 | 6358 | 6172 | 6172 | 82.11% | 97.07% |  |
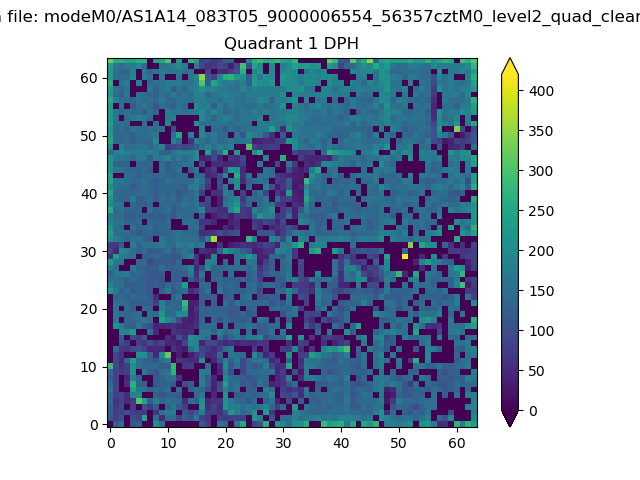
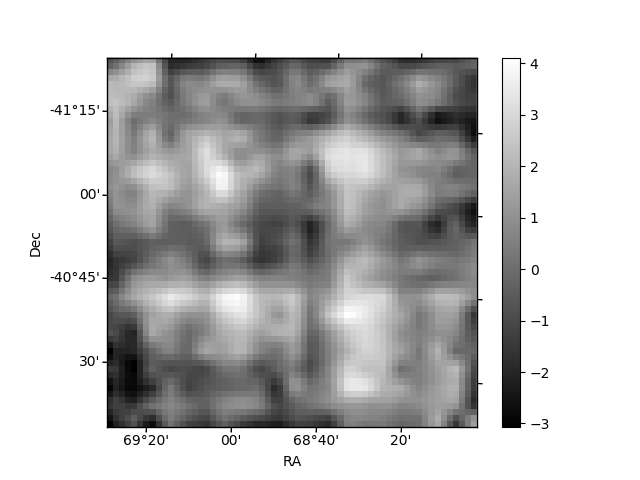
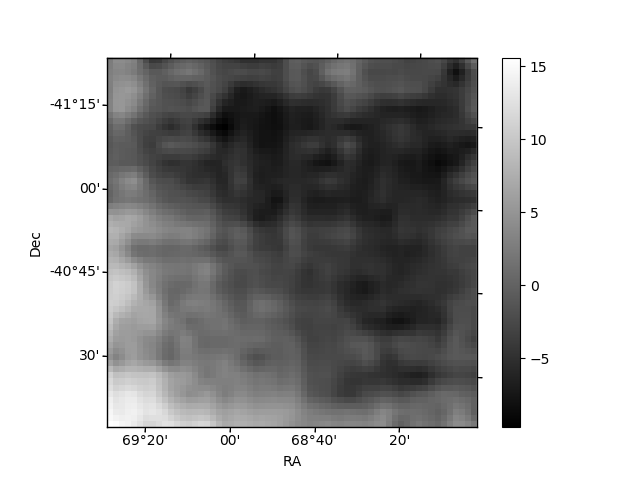
Top three noisy pixels from each quadrant. If the there are fewer than three noisy pixels in the level2.evt file, extra rows are filled as -1
| Pixel properties | Quadrant properties | ||||||
|---|---|---|---|---|---|---|---|
| Quadrant | DetID | PixID | Counts | Sigma | Mean | Median | Sigma |
| A | 12 | 3 | 10097100 | 92318.75 | 426 | 416 | 109.4 |
| A | 12 | 194 | 1195266 | 10925.08 | 426 | 416 | 109.4 |
| A | 4 | 95 | 120812 | 1100.84 | 426 | 416 | 109.4 |
| B | 4 | 206 | 1850317 | 14323.53 | 600 | 579 | 129.1 |
| B | 5 | 172 | 1509808 | 11686.78 | 600 | 579 | 129.1 |
| B | 4 | 171 | 99981 | 769.72 | 600 | 579 | 129.1 |
| C | 15 | 230 | 1251787 | 7361.7 | 614 | 609 | 170.0 |
| C | 12 | 252 | 331754 | 1948.39 | 614 | 609 | 170.0 |
| C | 13 | 3 | 149978 | 878.86 | 614 | 609 | 170.0 |
| D | 8 | 129 | 15851132 | 746232.05 | 66 | 62 | 21.2 |
| D | 8 | 113 | 125205 | 5891.45 | 66 | 62 | 21.2 |
| D | 6 | 239 | 64625 | 3039.48 | 66 | 62 | 21.2 |
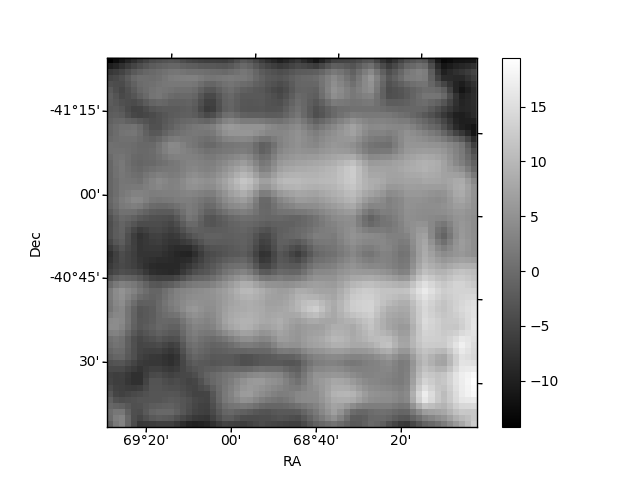
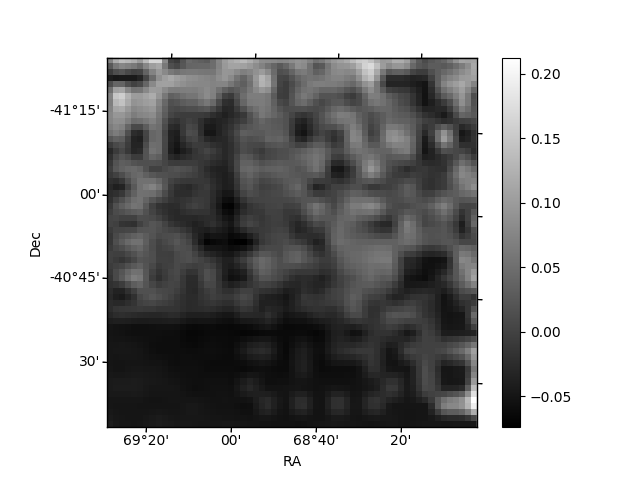
Histogram calculated using DETX and DETY for each event in the final _common_clean file
| Quadrant A | 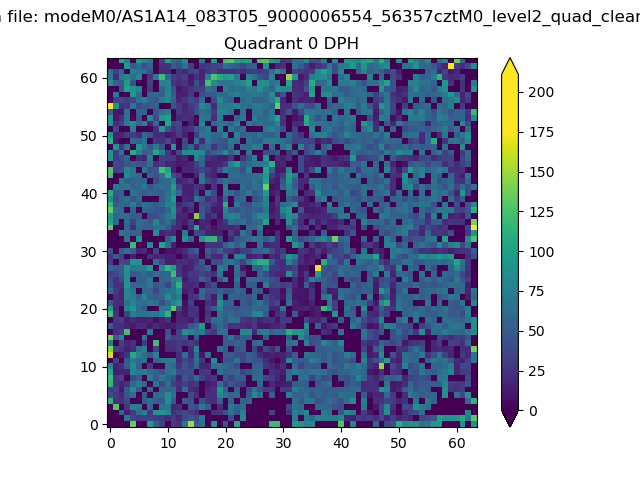 |
 |
Quadrant B |
|---|---|---|---|
| Quadrant D |  |
 |
Quadrant C |
| Plot type | Count rate plots | Images |
|---|---|---|
| Comparison with Poisson distribution Blue bars denote a histogram of data divided into 1 sec bins. Red curve is a Poisson curve with rate = median count rate of data. |
 |
 |
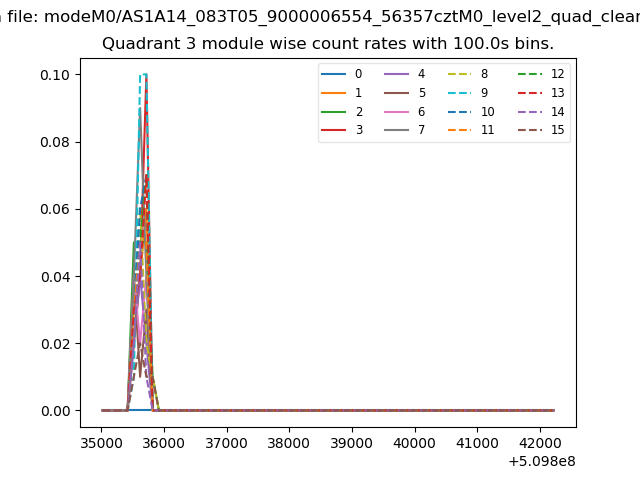
| Quadrant-wise count rates Data is divided into 100 sec bins |
 |
|
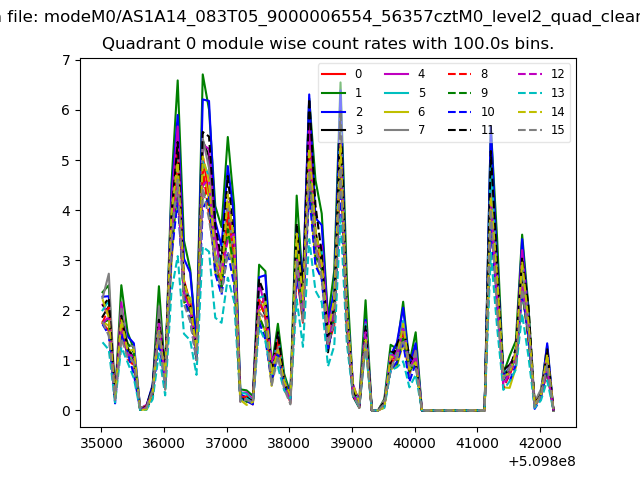
| Module-wise count rates for Quadrant A Data is divided into 100 sec bins |
 |
 |
| Module-wise count rates for Quadrant B Data is divided into 100 sec bins |
 |
 |
| Module-wise count rates for Quadrant C Data is divided into 100 sec bins |
 |
 |
| Module-wise count rates for Quadrant D Data is divided into 100 sec bins |
 |
 |
| Parameter | Plot |
|---|---|
| CZT HV Monitor |  |
| D_VDD |  |
| Temperature 1 | 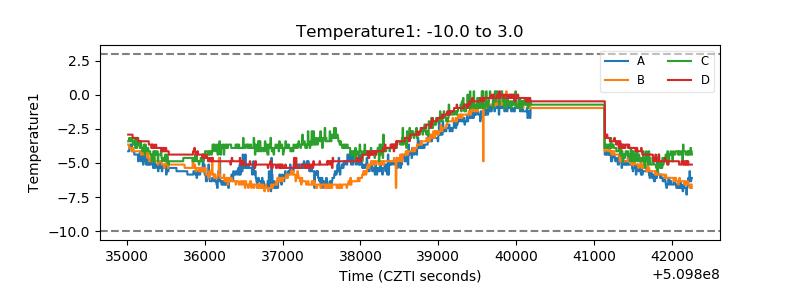 |
| Veto HV Monitor | 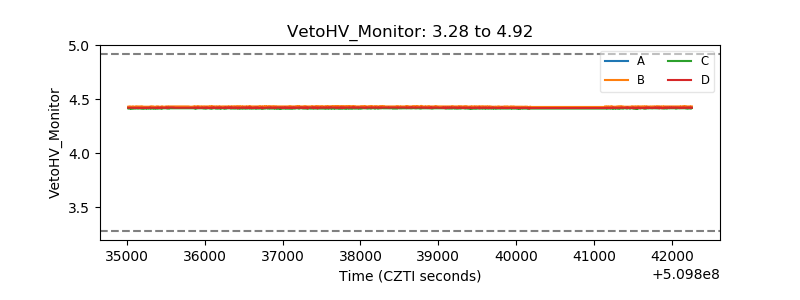 |
| Veto LLD |  |
| Alpha Counter |  |
| _CPM_Rate |  |
| CZT Counter | 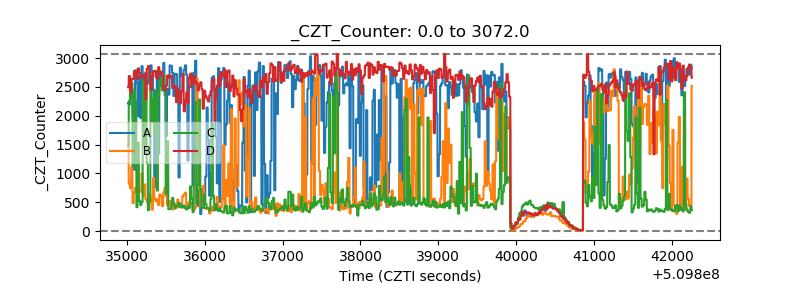 |
| +2.5 Volts monitor | 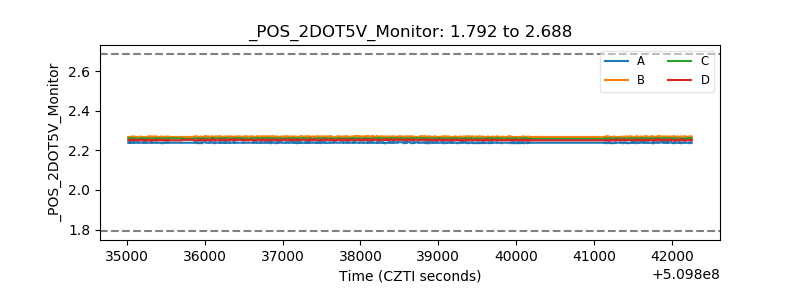 |
| +5 Volts monitor |  |
| _ROLL_ROT | 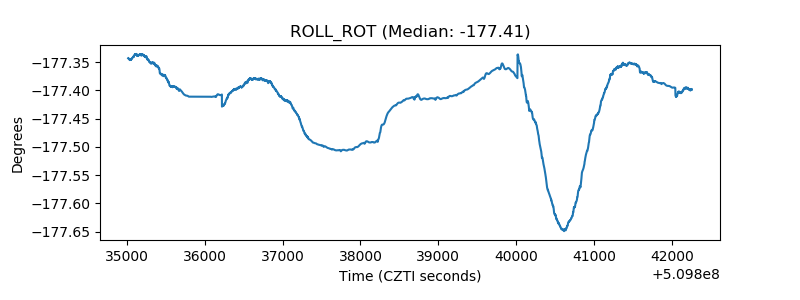 |
| _Roll_DEC | 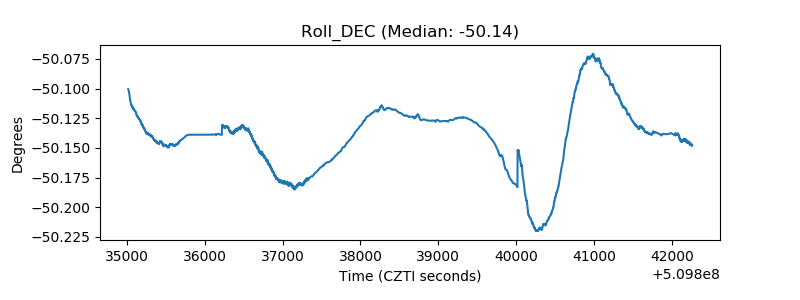 |
| _Roll_RA | 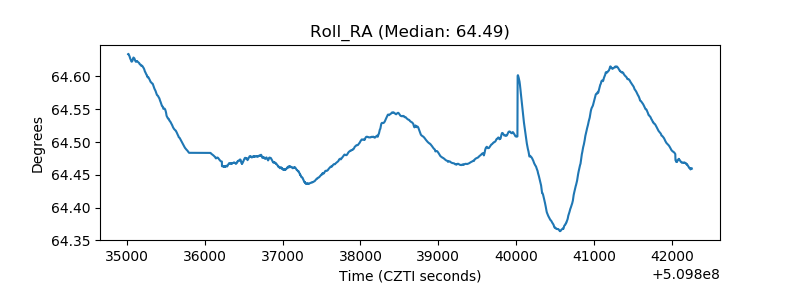 |
| Veto Counter | 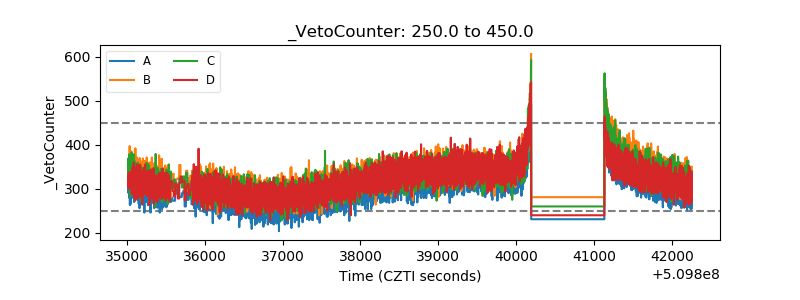 |