| Param | Original file | Final file |
|---|---|---|
| Filename | modeM0/AS1A14_083T05_9000006554_56359cztM0_level2.fits | modeM0/AS1A14_083T05_9000006554_56359cztM0_level2_quad_clean.evt |
| Size (bytes) | 1,142,208,000 | 57,375,360 |
| Size | 1.1 GB | 54.7 MB |
| Events in quadrant A | 15,254,986 | 121,818 |
| Events in quadrant B | 5,957,632 | 585,158 |
| Events in quadrant C | 3,990,778 | 562,694 |
| Events in quadrant D | 16,575,765 | 14,223 |
| Mode M9 | |||
|---|---|---|---|
| Quadrant | BADHDUFLAG | Total packets | Discarded packets |
| A | 0 | 11 | 0 |
| B | 0 | 11 | 0 |
| C | 0 | 11 | 0 |
| D | 0 | 11 | 0 |
| Mode SS | |||
|---|---|---|---|
| Quadrant | BADHDUFLAG | Total packets | Discarded packets |
| A | 0 | 130 | 0 |
| B | 0 | 130 | 0 |
| C | 0 | 130 | 0 |
| D | 0 | 130 | 0 |
| Mode M0 | |||
|---|---|---|---|
| Quadrant | BADHDUFLAG | Total packets | Discarded packets |
| A | 0 | 49726 | 1 |
| B | 0 | 22154 | 1 |
| C | 0 | 16678 | 1 |
| D | 0 | 53633 | 1 |
| Quadrant | Total seconds | Saturated seconds | Saturation percentage |
|---|---|---|---|
| A | 6502 | 5367 | 82.543833% |
| B | 6502 | 937 | 14.410950% |
| C | 6503 | 313 | 4.813163% |
| D | 6503 | 6344 | 97.554975% |
Noise dominated data is calculated using 1-second bins in cleaned event files. If a bin has >2000 counts, and if more than 50% of those come from <1% of pixels, then it is considered to be noise-dominated and hence unusable.
| Quadrant | # 1 sec bins | Bins with >0 counts | Bins with >2000 counts | High rate bins dominated by noise | Noise dominated (total time) | Noise dominated (detector-on time) | Marked lightcurve |
|---|---|---|---|---|---|---|---|
| A | 7541 | 6501 | 5240 | 5240 | 69.49% | 80.60% |  |
| B | 7542 | 6503 | 732 | 732 | 9.71% | 11.26% |  |
| C | 7543 | 6504 | 291 | 291 | 3.86% | 4.47% |  |
| D | 7542 | 6502 | 6182 | 6182 | 81.97% | 95.08% |  |
Top three noisy pixels from each quadrant. If the there are fewer than three noisy pixels in the level2.evt file, extra rows are filled as -1
| Pixel properties | Quadrant properties | ||||||
|---|---|---|---|---|---|---|---|
| Quadrant | DetID | PixID | Counts | Sigma | Mean | Median | Sigma |
| A | 12 | 3 | 11080952 | 110731.23 | 386 | 375 | 100.1 |
| A | 12 | 194 | 1297884 | 12966.36 | 386 | 375 | 100.1 |
| A | 1 | 191 | 464620 | 4639.33 | 386 | 375 | 100.1 |
| B | 4 | 206 | 1635336 | 11949.42 | 638 | 616 | 136.8 |
| B | 5 | 172 | 1085761 | 7932.16 | 638 | 616 | 136.8 |
| B | 5 | 185 | 285730 | 2084.12 | 638 | 616 | 136.8 |
| C | 15 | 230 | 978587 | 5420.2 | 652 | 646 | 180.4 |
| C | 12 | 252 | 130642 | 720.5 | 652 | 646 | 180.4 |
| C | 13 | 3 | 123441 | 680.59 | 652 | 646 | 180.4 |
| D | 8 | 129 | 15543704 | 498894.53 | 97 | 92 | 31.2 |
| D | 8 | 113 | 414395 | 13297.65 | 97 | 92 | 31.2 |
| D | 3 | 12 | 61266 | 1963.47 | 97 | 92 | 31.2 |
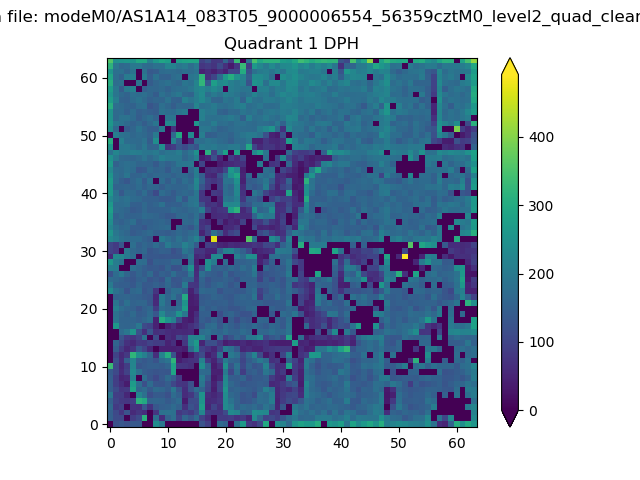
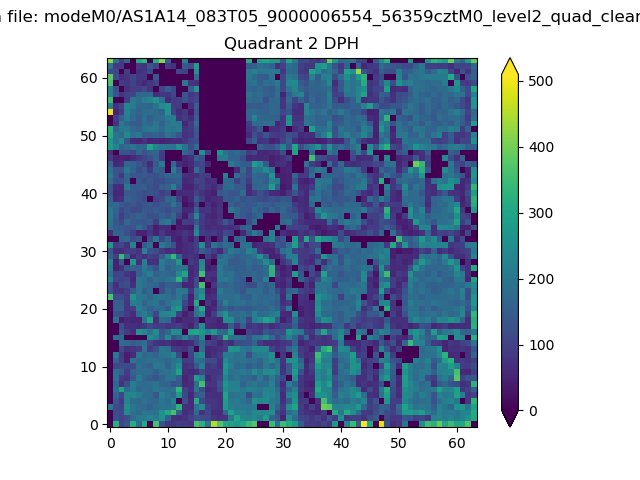
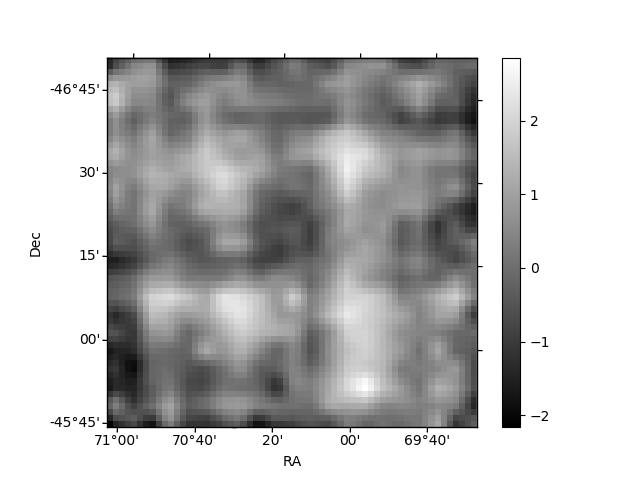
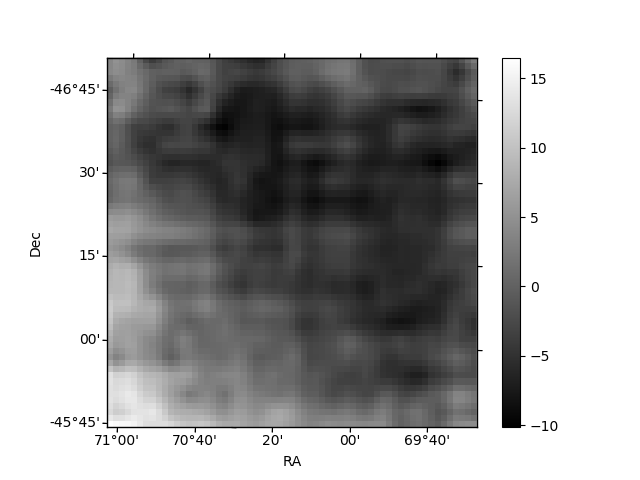
Histogram calculated using DETX and DETY for each event in the final _common_clean file
| Quadrant A |  |
 |
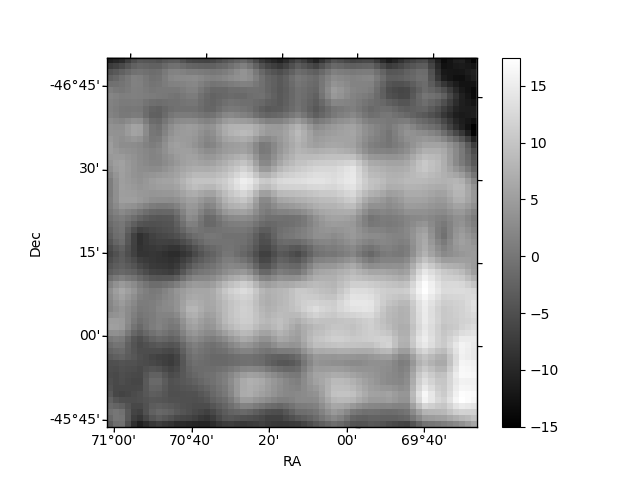
Quadrant B |
|---|---|---|---|
| Quadrant D |  |
 |
Quadrant C |
| Plot type | Count rate plots | Images |
|---|---|---|
| Comparison with Poisson distribution Blue bars denote a histogram of data divided into 1 sec bins. Red curve is a Poisson curve with rate = median count rate of data. |
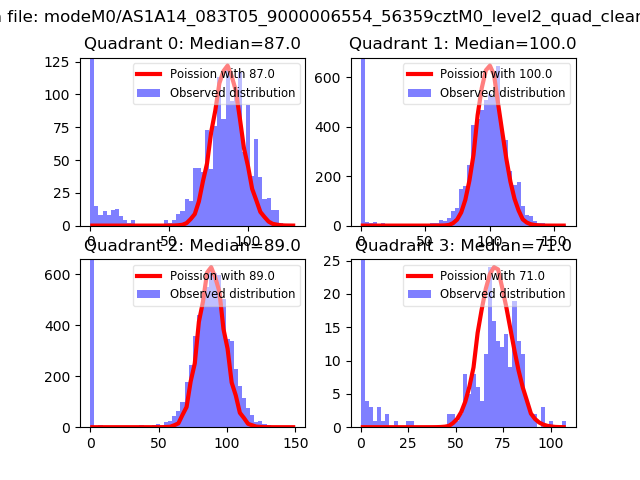 |
 |
| Quadrant-wise count rates Data is divided into 100 sec bins |
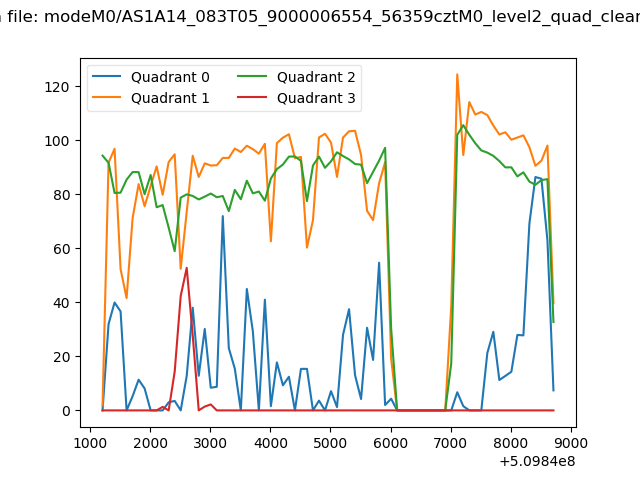 |
|
| Module-wise count rates for Quadrant A Data is divided into 100 sec bins |
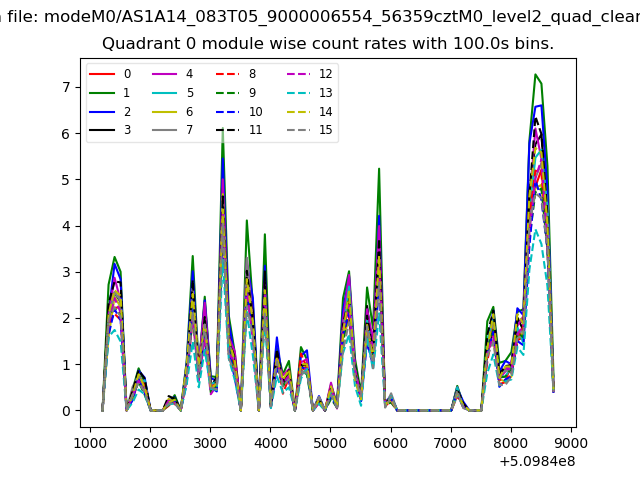 |
 |
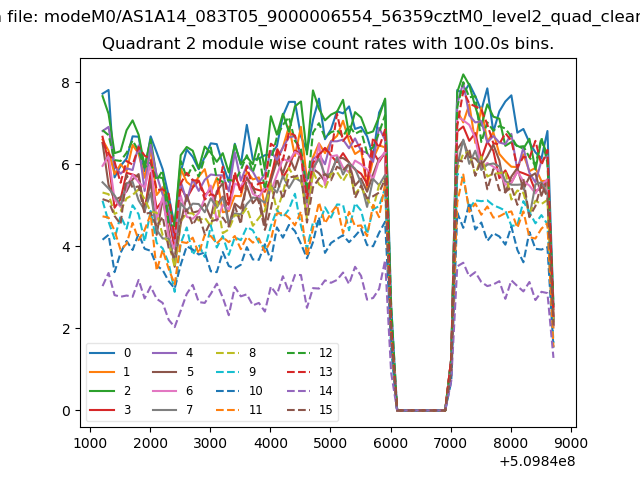
| Module-wise count rates for Quadrant B Data is divided into 100 sec bins |
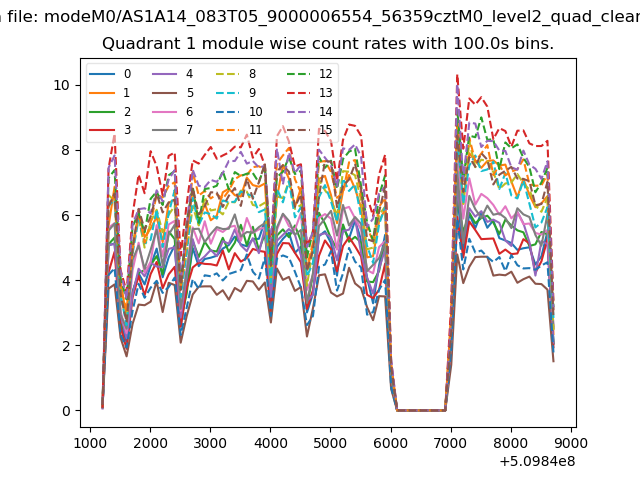 |
 |
| Module-wise count rates for Quadrant C Data is divided into 100 sec bins |
 |
 |
| Module-wise count rates for Quadrant D Data is divided into 100 sec bins |
 |
 |
| Parameter | Plot |
|---|---|
| CZT HV Monitor | 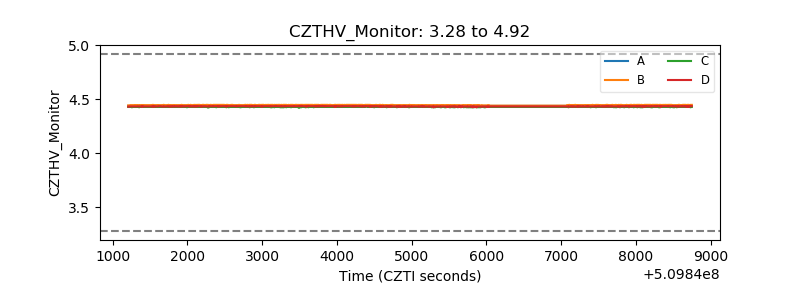 |
| D_VDD |  |
| Temperature 1 | 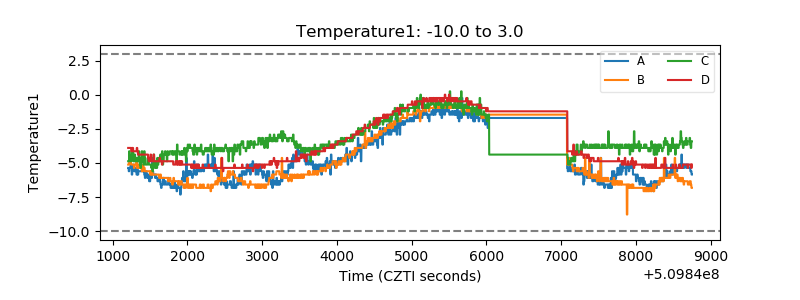 |
| Veto HV Monitor |  |
| Veto LLD |  |
| Alpha Counter |  |
| _CPM_Rate | 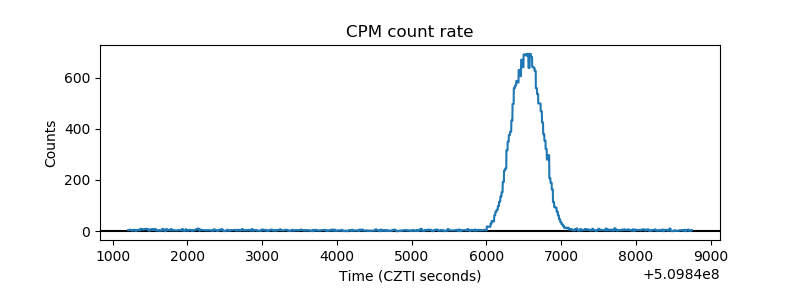 |
| CZT Counter | 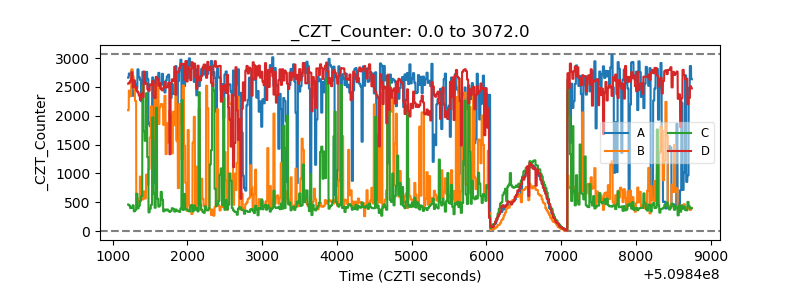 |
| +2.5 Volts monitor | 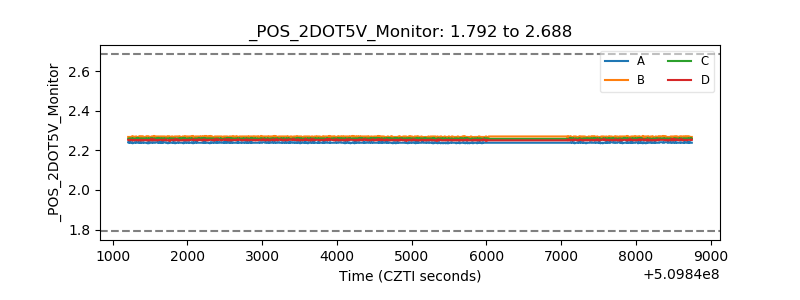 |
| +5 Volts monitor | 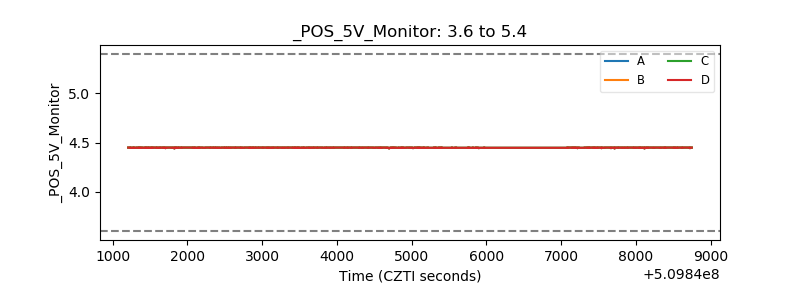 |
| _ROLL_ROT |  |
| _Roll_DEC |  |
| _Roll_RA |  |
| Veto Counter |  |