| Param | Original file | Final file |
|---|---|---|
| Filename | modeM0/AS1A14_083T05_9000006554_56362cztM0_level2.fits | modeM0/AS1A14_083T05_9000006554_56362cztM0_level2_quad_clean.evt |
| Size (bytes) | 1,114,208,640 | 61,951,680 |
| Size | 1.0 GB | 59.1 MB |
| Events in quadrant A | 13,487,060 | 337,107 |
| Events in quadrant B | 6,012,135 | 544,932 |
| Events in quadrant C | 5,801,120 | 489,602 |
| Events in quadrant D | 15,501,910 | 96,735 |
| Mode M9 | |||
|---|---|---|---|
| Quadrant | BADHDUFLAG | Total packets | Discarded packets |
| A | 0 | 11 | 0 |
| B | 0 | 11 | 0 |
| C | 0 | 11 | 0 |
| D | 0 | 11 | 0 |
| Mode SS | |||
|---|---|---|---|
| Quadrant | BADHDUFLAG | Total packets | Discarded packets |
| A | 0 | 116 | 0 |
| B | 0 | 116 | 0 |
| C | 0 | 116 | 0 |
| D | 0 | 116 | 0 |
| Mode M0 | |||
|---|---|---|---|
| Quadrant | BADHDUFLAG | Total packets | Discarded packets |
| A | 0 | 44002 | 1 |
| B | 0 | 21769 | 2 |
| C | 0 | 21276 | 1 |
| D | 0 | 49883 | 1 |
| Quadrant | Total seconds | Saturated seconds | Saturation percentage |
|---|---|---|---|
| A | 5741 | 4903 | 85.403240% |
| B | 5740 | 1345 | 23.432056% |
| C | 5741 | 1125 | 19.595889% |
| D | 5741 | 5741 | 100.000000% |
Noise dominated data is calculated using 1-second bins in cleaned event files. If a bin has >2000 counts, and if more than 50% of those come from <1% of pixels, then it is considered to be noise-dominated and hence unusable.
| Quadrant | # 1 sec bins | Bins with >0 counts | Bins with >2000 counts | High rate bins dominated by noise | Noise dominated (total time) | Noise dominated (detector-on time) | Marked lightcurve |
|---|---|---|---|---|---|---|---|
| A | 6885 | 5740 | 4738 | 4738 | 68.82% | 82.54% | 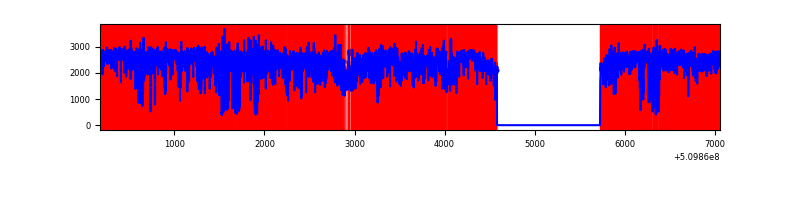 |
| B | 6885 | 5740 | 970 | 970 | 14.09% | 16.90% | 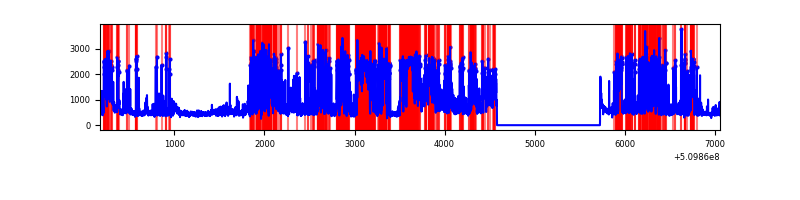 |
| C | 6886 | 5741 | 993 | 993 | 14.42% | 17.30% |  |
| D | 6885 | 5740 | 5693 | 5693 | 82.69% | 99.18% | 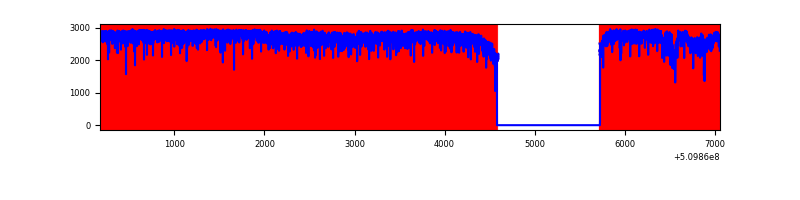 |
Top three noisy pixels from each quadrant. If the there are fewer than three noisy pixels in the level2.evt file, extra rows are filled as -1
| Pixel properties | Quadrant properties | ||||||
|---|---|---|---|---|---|---|---|
| Quadrant | DetID | PixID | Counts | Sigma | Mean | Median | Sigma |
| A | 12 | 3 | 9151054 | 94854.16 | 381 | 371 | 96.5 |
| A | 12 | 194 | 1044145 | 10819.55 | 381 | 371 | 96.5 |
| A | 8 | 26 | 518922 | 5375.19 | 381 | 371 | 96.5 |
| B | 4 | 206 | 3197990 | 27227.69 | 555 | 536 | 117.4 |
| B | 5 | 185 | 295084 | 2508.2 | 555 | 536 | 117.4 |
| B | 0 | 63 | 57647 | 486.32 | 555 | 536 | 117.4 |
| C | 15 | 230 | 2685074 | 17308.74 | 561 | 553 | 155.1 |
| C | 13 | 3 | 373128 | 2402.21 | 561 | 553 | 155.1 |
| C | 12 | 254 | 275623 | 1773.54 | 561 | 553 | 155.1 |
| D | 8 | 129 | 14442901 | 373580.2 | 131 | 125 | 38.7 |
| D | 6 | 239 | 243543 | 6296.31 | 131 | 125 | 38.7 |
| D | 2 | 249 | 133470 | 3449.13 | 131 | 125 | 38.7 |
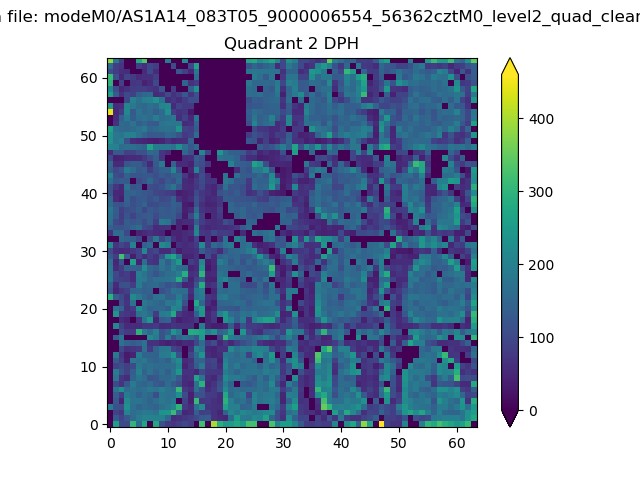
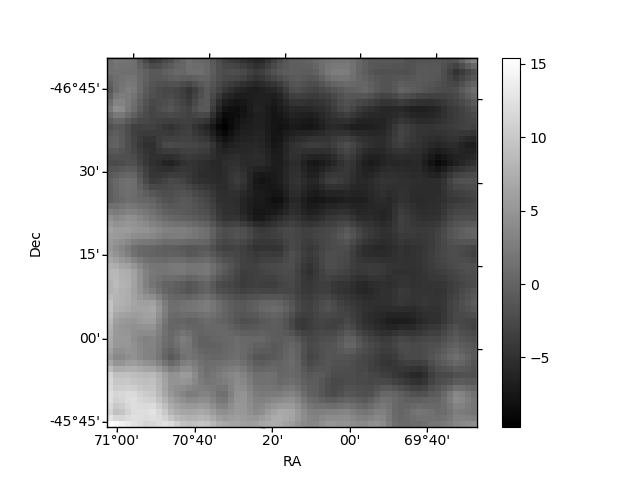
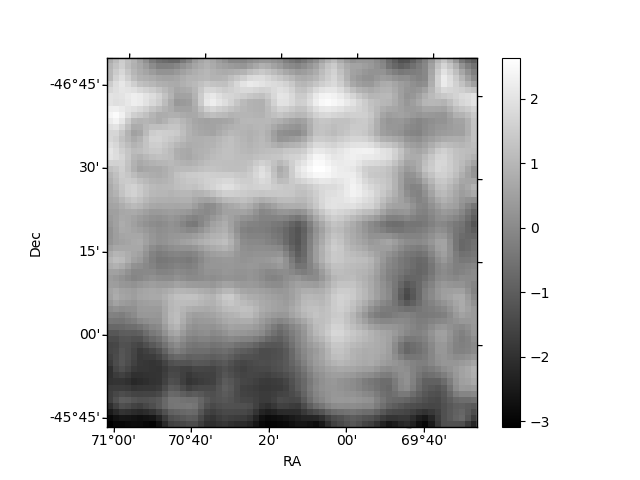
Histogram calculated using DETX and DETY for each event in the final _common_clean file
| Quadrant A | 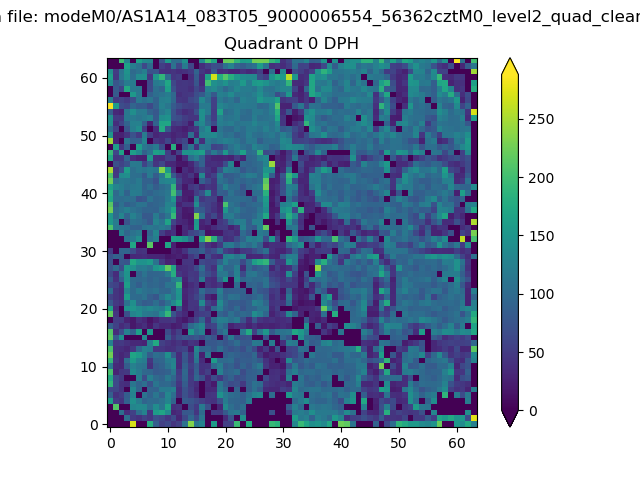 |
 |
Quadrant B |
|---|---|---|---|
| Quadrant D | 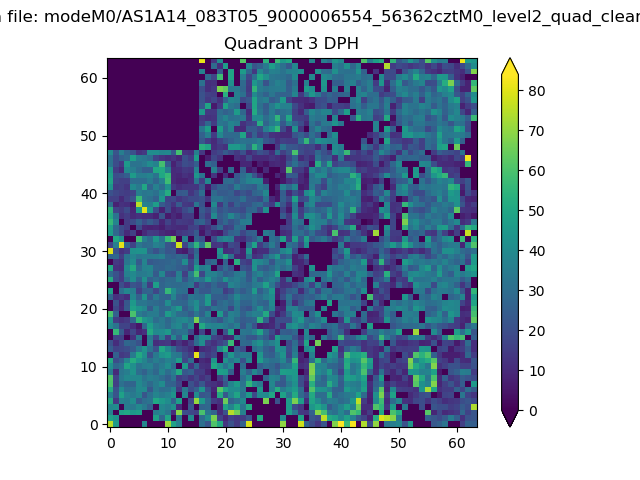 |
 |
Quadrant C |
| Plot type | Count rate plots | Images |
|---|---|---|
| Comparison with Poisson distribution Blue bars denote a histogram of data divided into 1 sec bins. Red curve is a Poisson curve with rate = median count rate of data. |
 |
 |
| Quadrant-wise count rates Data is divided into 100 sec bins |
 |
|
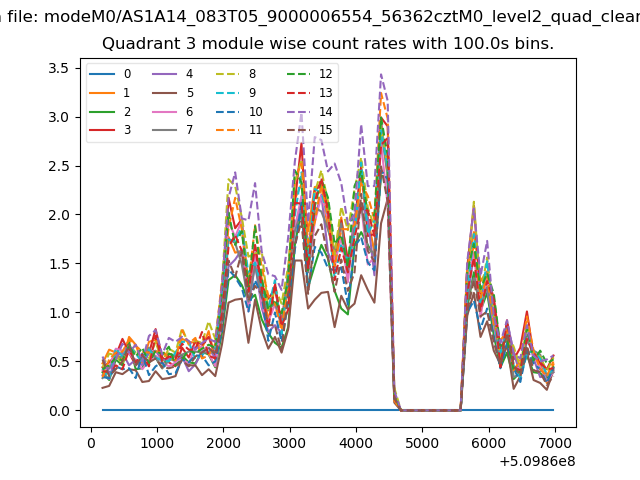
| Module-wise count rates for Quadrant A Data is divided into 100 sec bins |
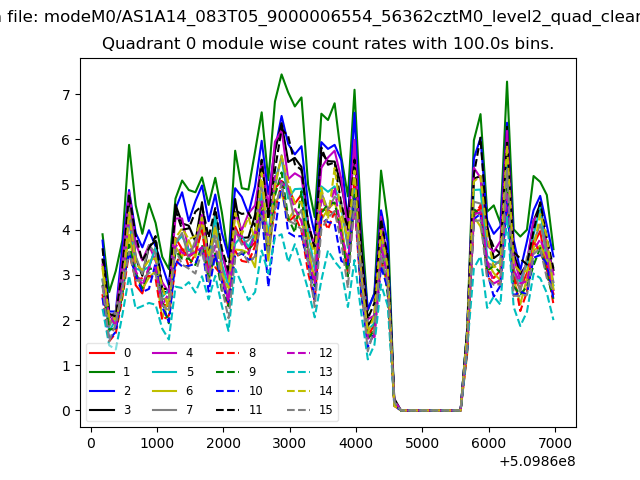 |
 |
| Module-wise count rates for Quadrant B Data is divided into 100 sec bins |
 |
 |
| Module-wise count rates for Quadrant C Data is divided into 100 sec bins |
 |
 |
| Module-wise count rates for Quadrant D Data is divided into 100 sec bins |
 |
 |
| Parameter | Plot |
|---|---|
| CZT HV Monitor | 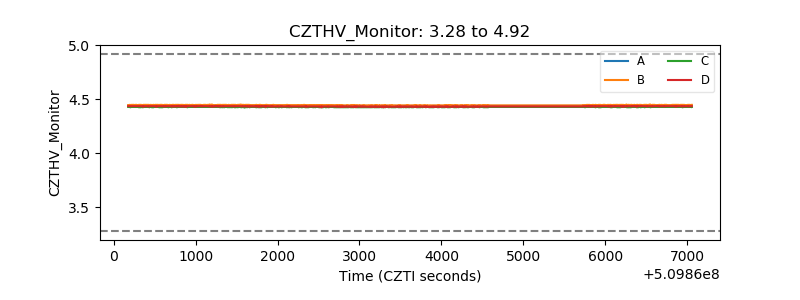 |
| D_VDD |  |
| Temperature 1 | 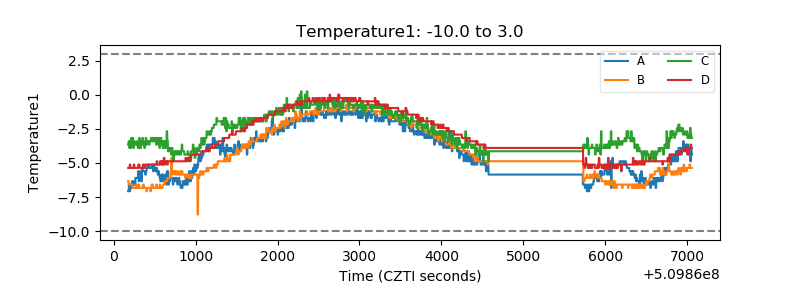 |
| Veto HV Monitor | 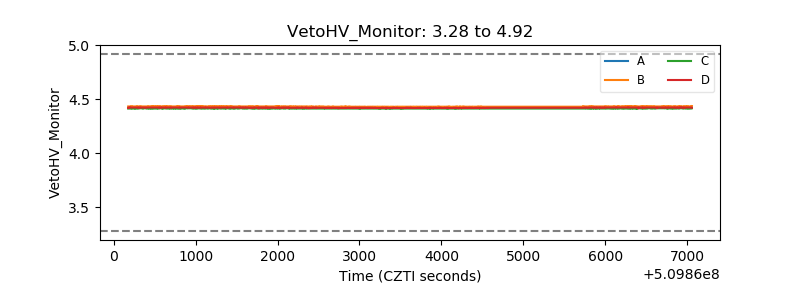 |
| Veto LLD |  |
| Alpha Counter |  |
| _CPM_Rate |  |
| CZT Counter | 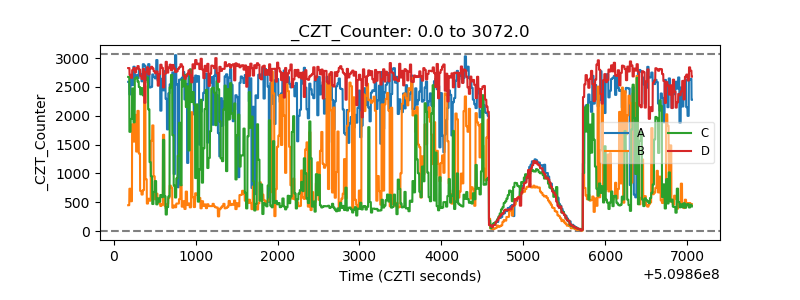 |
| +2.5 Volts monitor | 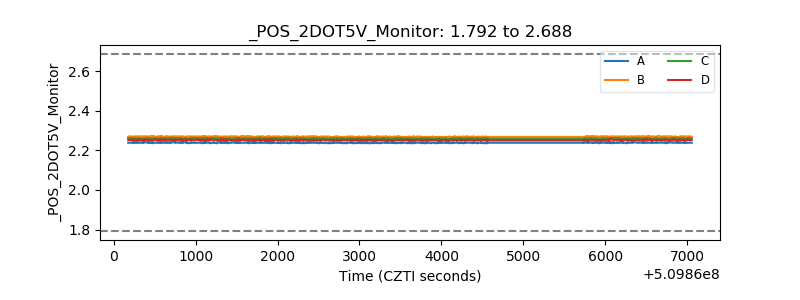 |
| +5 Volts monitor | 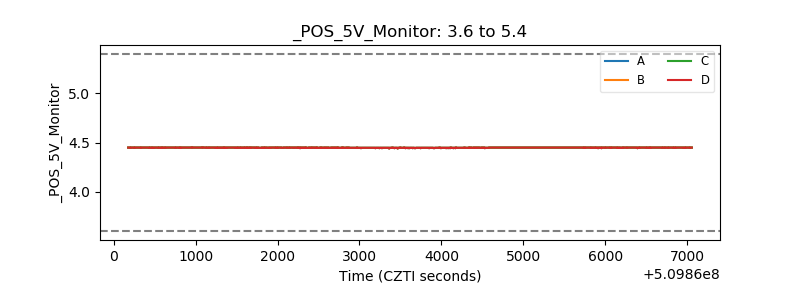 |
| _ROLL_ROT | 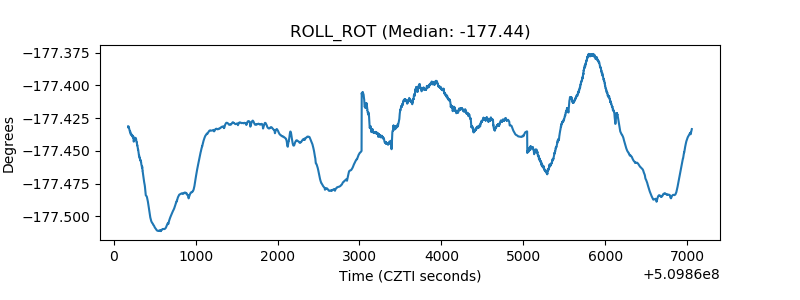 |
| _Roll_DEC | 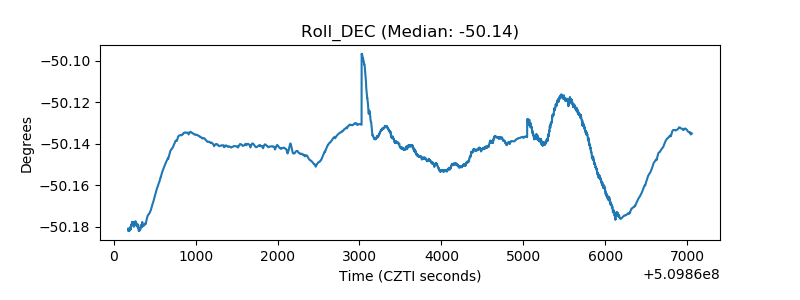 |
| _Roll_RA | 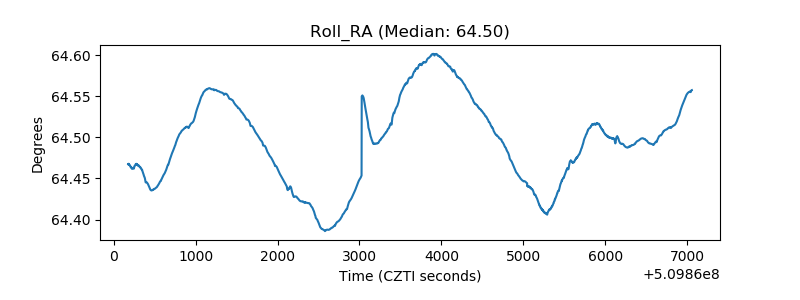 |
| Veto Counter | 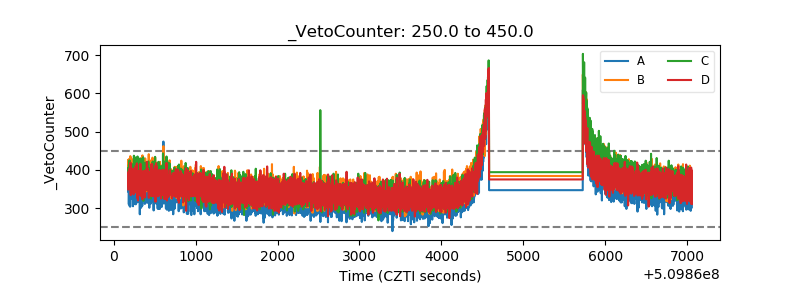 |