| Param | Original file | Final file |
|---|---|---|
| Filename | modeM0/AS1A14_083T05_9000006554_56366cztM0_level2.fits | modeM0/AS1A14_083T05_9000006554_56366cztM0_level2_quad_clean.evt |
| Size (bytes) | 1,223,657,280 | 68,529,600 |
| Size | 1.1 GB | 65.4 MB |
| Events in quadrant A | 12,729,973 | 345,816 |
| Events in quadrant B | 6,133,069 | 662,211 |
| Events in quadrant C | 7,367,542 | 549,963 |
| Events in quadrant D | 18,499,108 | 5,815 |
| Mode SS | |||
|---|---|---|---|
| Quadrant | BADHDUFLAG | Total packets | Discarded packets |
| A | 0 | 148 | 0 |
| B | 0 | 148 | 0 |
| C | 0 | 148 | 0 |
| D | 0 | 148 | 0 |
| Mode M0 | |||
|---|---|---|---|
| Quadrant | BADHDUFLAG | Total packets | Discarded packets |
| A | 0 | 42695 | 0 |
| B | 0 | 23199 | 0 |
| C | 0 | 27003 | 0 |
| D | 0 | 60057 | 8 |
| Quadrant | Total seconds | Saturated seconds | Saturation percentage |
|---|---|---|---|
| A | 7334 | 3893 | 53.081538% |
| B | 7335 | 972 | 13.251534% |
| C | 7335 | 1393 | 18.991138% |
| D | 7334 | 7275 | 99.195528% |
Noise dominated data is calculated using 1-second bins in cleaned event files. If a bin has >2000 counts, and if more than 50% of those come from <1% of pixels, then it is considered to be noise-dominated and hence unusable.
| Quadrant | # 1 sec bins | Bins with >0 counts | Bins with >2000 counts | High rate bins dominated by noise | Noise dominated (total time) | Noise dominated (detector-on time) | Marked lightcurve |
|---|---|---|---|---|---|---|---|
| A | 7334 | 7334 | 3850 | 3850 | 52.50% | 52.50% | 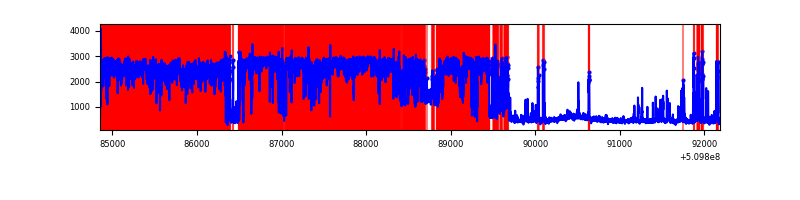 |
| B | 7335 | 7335 | 761 | 761 | 10.37% | 10.37% |  |
| C | 7335 | 7335 | 1312 | 1312 | 17.89% | 17.89% | 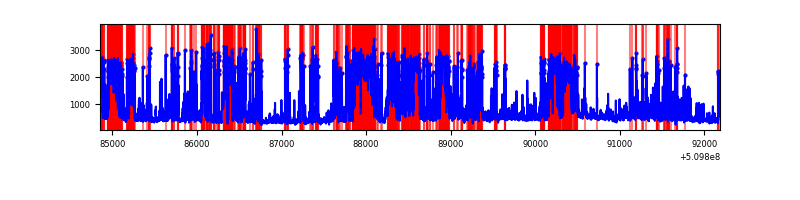 |
| D | 7333 | 7333 | 6715 | 6715 | 91.57% | 91.57% | 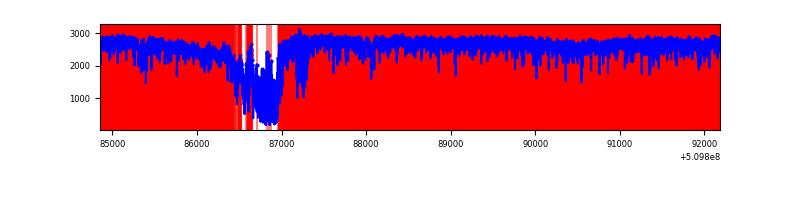 |
Top three noisy pixels from each quadrant. If the there are fewer than three noisy pixels in the level2.evt file, extra rows are filled as -1
| Pixel properties | Quadrant properties | ||||||
|---|---|---|---|---|---|---|---|
| Quadrant | DetID | PixID | Counts | Sigma | Mean | Median | Sigma |
| A | 12 | 3 | 8266498 | 56904.88 | 582 | 567 | 145.3 |
| A | 12 | 194 | 959583 | 6602.12 | 582 | 567 | 145.3 |
| A | 4 | 95 | 409857 | 2817.66 | 582 | 567 | 145.3 |
| B | 4 | 206 | 2605026 | 16503.51 | 734 | 709 | 157.8 |
| B | 5 | 185 | 257611 | 1627.98 | 734 | 709 | 157.8 |
| B | 8 | 128 | 80003 | 502.48 | 734 | 709 | 157.8 |
| C | 15 | 230 | 2819296 | 14790.09 | 690 | 683 | 190.6 |
| C | 5 | 250 | 540634 | 2833.28 | 690 | 683 | 190.6 |
| C | 13 | 3 | 506386 | 2653.57 | 690 | 683 | 190.6 |
| D | 8 | 129 | 17570972 | 359487.9 | 164 | 156 | 48.9 |
| D | 6 | 239 | 80668 | 1647.23 | 164 | 156 | 48.9 |
| D | 2 | 249 | 74769 | 1526.54 | 164 | 156 | 48.9 |
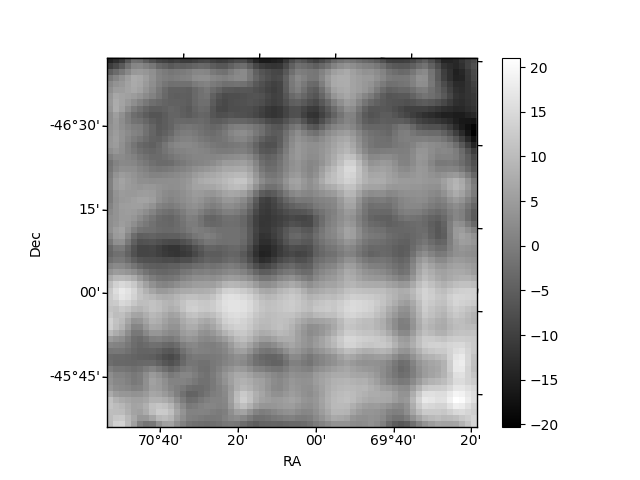
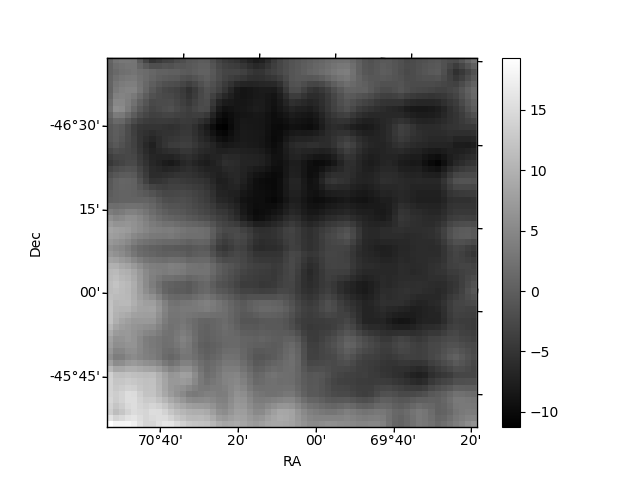
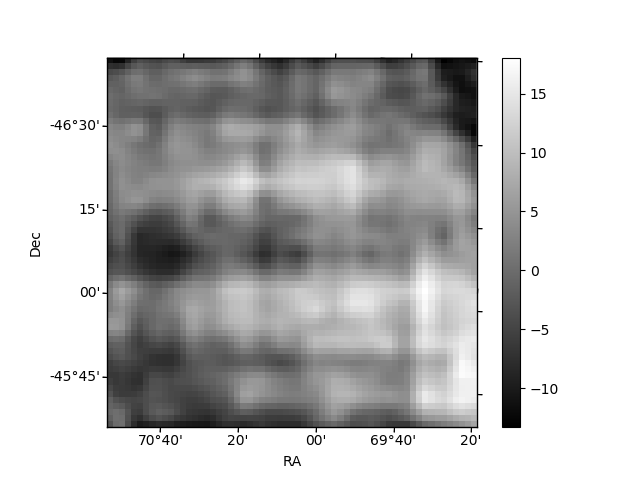
Histogram calculated using DETX and DETY for each event in the final _common_clean file
| Quadrant A | 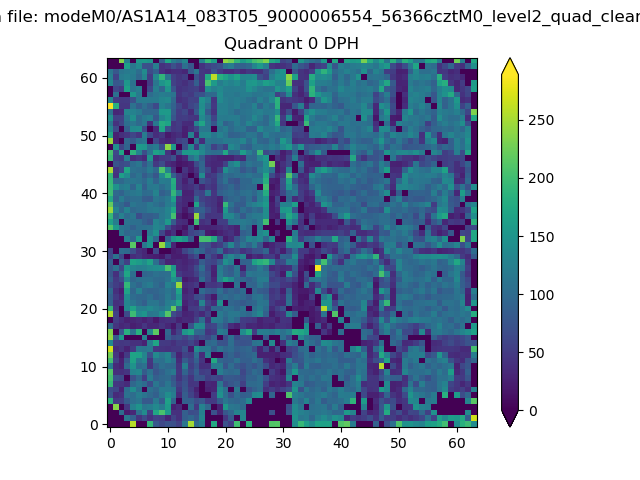 |
 |
Quadrant B |
|---|---|---|---|
| Quadrant D |  |
 |
Quadrant C |
| Plot type | Count rate plots | Images |
|---|---|---|
| Comparison with Poisson distribution Blue bars denote a histogram of data divided into 1 sec bins. Red curve is a Poisson curve with rate = median count rate of data. |
 |
 |
| Quadrant-wise count rates Data is divided into 100 sec bins |
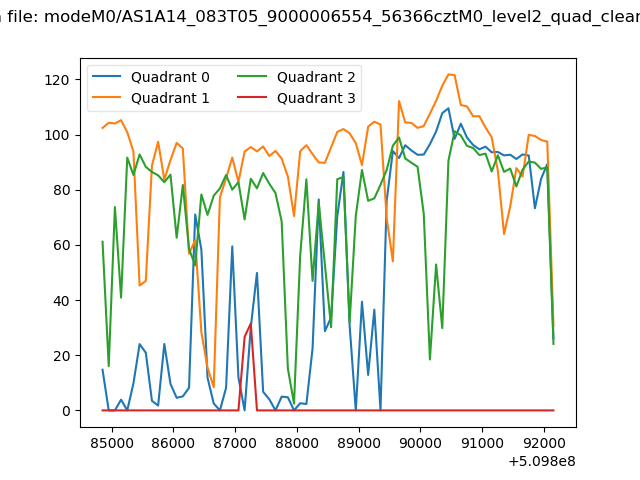 |
|
| Module-wise count rates for Quadrant A Data is divided into 100 sec bins |
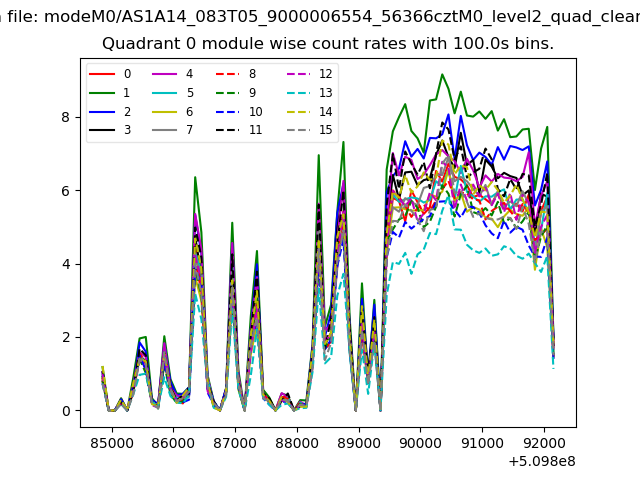 |
 |
| Module-wise count rates for Quadrant B Data is divided into 100 sec bins |
 |
 |
| Module-wise count rates for Quadrant C Data is divided into 100 sec bins |
 |
 |
| Module-wise count rates for Quadrant D Data is divided into 100 sec bins |
 |
 |
| Parameter | Plot |
|---|---|
| CZT HV Monitor |  |
| D_VDD |  |
| Temperature 1 | 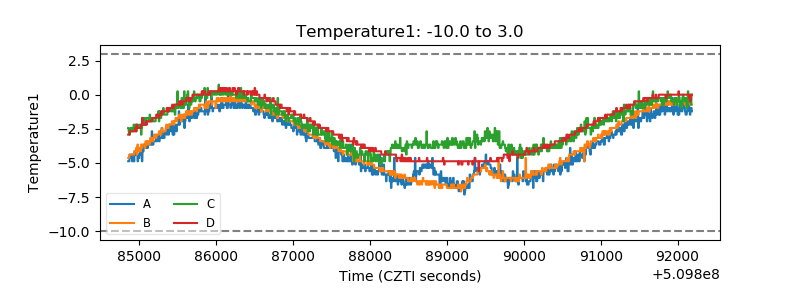 |
| Veto HV Monitor | 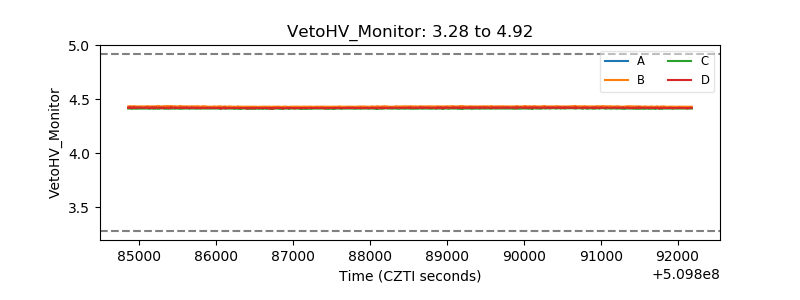 |
| Veto LLD | 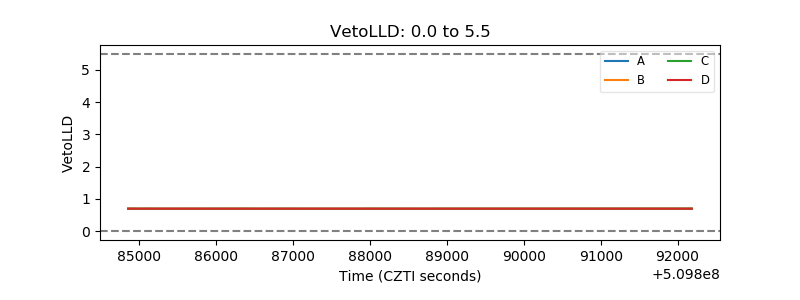 |
| Alpha Counter | 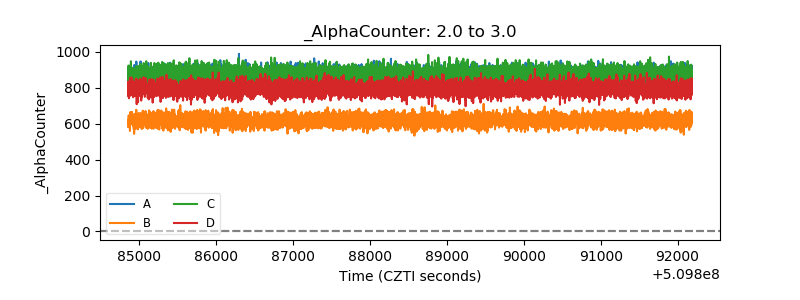 |
| _CPM_Rate |  |
| CZT Counter |  |
| +2.5 Volts monitor | 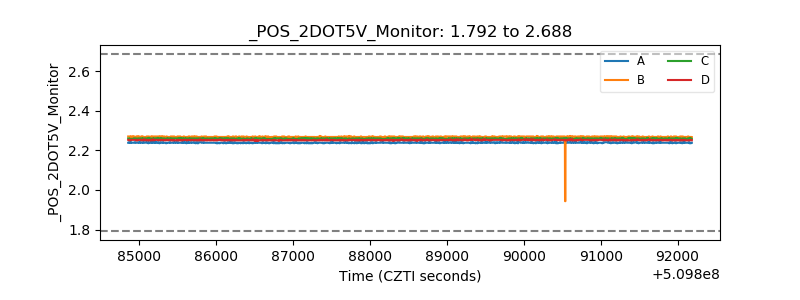 |
| +5 Volts monitor | 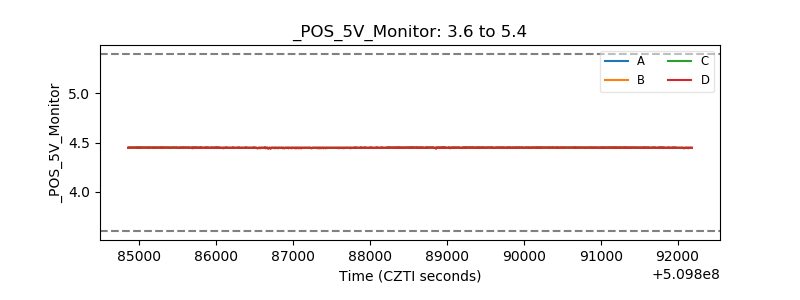 |
| _ROLL_ROT | 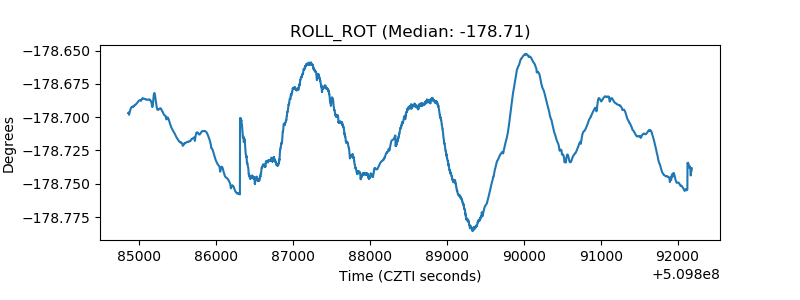 |
| _Roll_DEC |  |
| _Roll_RA |  |
| Veto Counter |  |