| Param | Original file | Final file |
|---|---|---|
| Filename | modeM0/AS1A14_083T05_9000006554_56367cztM0_level2.fits | modeM0/AS1A14_083T05_9000006554_56367cztM0_level2_quad_clean.evt |
| Size (bytes) | 1,301,590,080 | 67,881,600 |
| Size | 1.2 GB | 64.7 MB |
| Events in quadrant A | 15,307,453 | 237,776 |
| Events in quadrant B | 6,802,166 | 661,703 |
| Events in quadrant C | 6,278,485 | 632,398 |
| Events in quadrant D | 19,216,118 | 2,581 |
| Mode SS | |||
|---|---|---|---|
| Quadrant | BADHDUFLAG | Total packets | Discarded packets |
| A | 0 | 150 | 0 |
| B | 0 | 150 | 0 |
| C | 0 | 150 | 0 |
| D | 0 | 150 | 0 |
| Mode M0 | |||
|---|---|---|---|
| Quadrant | BADHDUFLAG | Total packets | Discarded packets |
| A | 0 | 50520 | 0 |
| B | 0 | 25365 | 0 |
| C | 0 | 23900 | 0 |
| D | 0 | 62378 | 2 |
| Quadrant | Total seconds | Saturated seconds | Saturation percentage |
|---|---|---|---|
| A | 7477 | 5169 | 69.132005% |
| B | 7478 | 1200 | 16.047071% |
| C | 7478 | 612 | 8.184006% |
| D | 7477 | 7453 | 99.679016% |
Noise dominated data is calculated using 1-second bins in cleaned event files. If a bin has >2000 counts, and if more than 50% of those come from <1% of pixels, then it is considered to be noise-dominated and hence unusable.
| Quadrant | # 1 sec bins | Bins with >0 counts | Bins with >2000 counts | High rate bins dominated by noise | Noise dominated (total time) | Noise dominated (detector-on time) | Marked lightcurve |
|---|---|---|---|---|---|---|---|
| A | 7477 | 7476 | 4960 | 4960 | 66.34% | 66.35% |  |
| B | 7479 | 7479 | 889 | 889 | 11.89% | 11.89% |  |
| C | 7479 | 7479 | 593 | 593 | 7.93% | 7.93% | 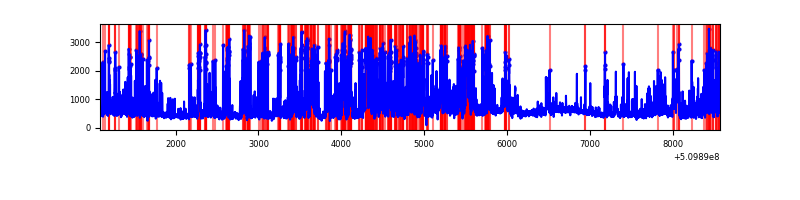 |
| D | 7477 | 7476 | 7178 | 7178 | 96.00% | 96.01% | 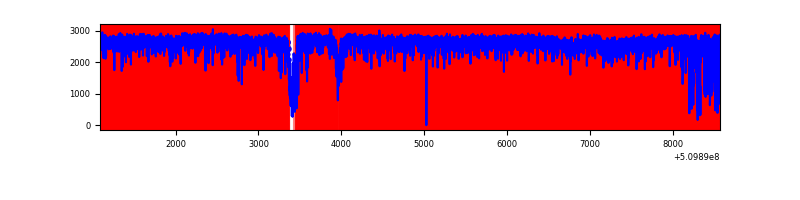 |
Top three noisy pixels from each quadrant. If the there are fewer than three noisy pixels in the level2.evt file, extra rows are filled as -1
| Pixel properties | Quadrant properties | ||||||
|---|---|---|---|---|---|---|---|
| Quadrant | DetID | PixID | Counts | Sigma | Mean | Median | Sigma |
| A | 12 | 3 | 10707550 | 79177.53 | 537 | 524 | 135.2 |
| A | 12 | 194 | 1244710 | 9200.65 | 537 | 524 | 135.2 |
| A | 3 | 62 | 362558 | 2677.21 | 537 | 524 | 135.2 |
| B | 4 | 206 | 3139290 | 19750.2 | 739 | 714 | 158.9 |
| B | 5 | 185 | 136375 | 853.68 | 739 | 714 | 158.9 |
| B | 4 | 21 | 118167 | 739.1 | 739 | 714 | 158.9 |
| C | 15 | 230 | 1053748 | 5103.07 | 750 | 744 | 206.3 |
| C | 13 | 3 | 935686 | 4530.92 | 750 | 744 | 206.3 |
| C | 12 | 252 | 751591 | 3638.76 | 750 | 744 | 206.3 |
| D | 8 | 129 | 17172819 | 222098.04 | 265 | 252 | 77.3 |
| D | 13 | 153 | 264572 | 3418.53 | 265 | 252 | 77.3 |
| D | 2 | 249 | 173063 | 2235.02 | 265 | 252 | 77.3 |
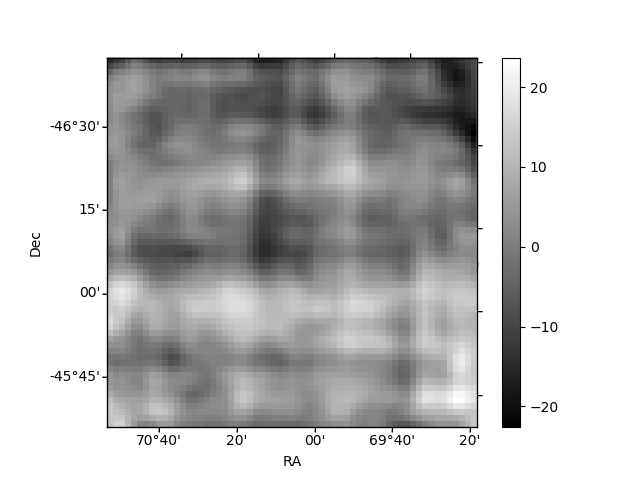
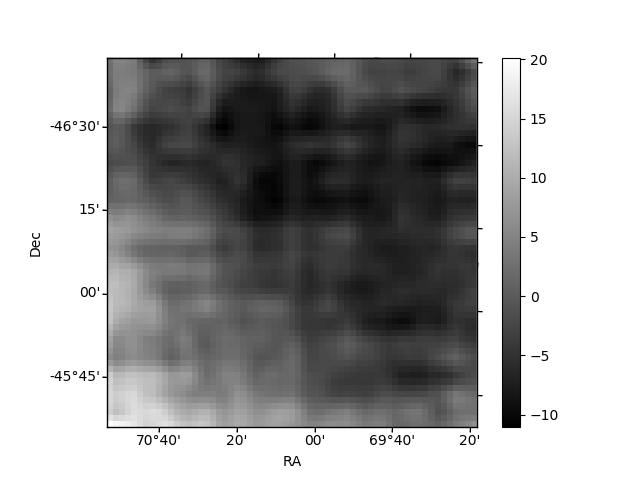
Histogram calculated using DETX and DETY for each event in the final _common_clean file
| Quadrant A | 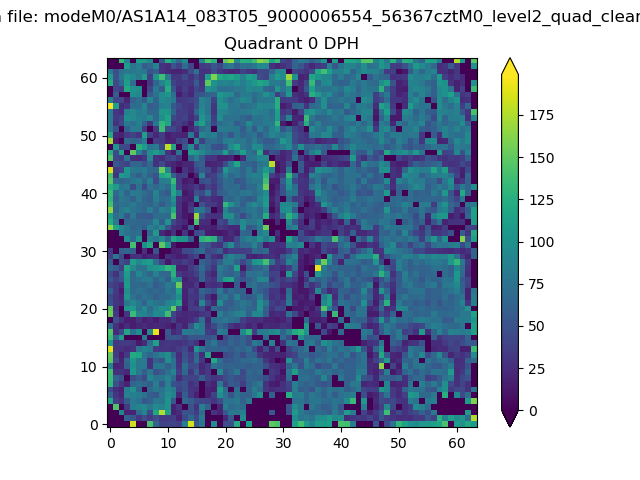 |
 |
Quadrant B |
|---|---|---|---|
| Quadrant D |  |
 |
Quadrant C |
| Plot type | Count rate plots | Images |
|---|---|---|
| Comparison with Poisson distribution Blue bars denote a histogram of data divided into 1 sec bins. Red curve is a Poisson curve with rate = median count rate of data. |
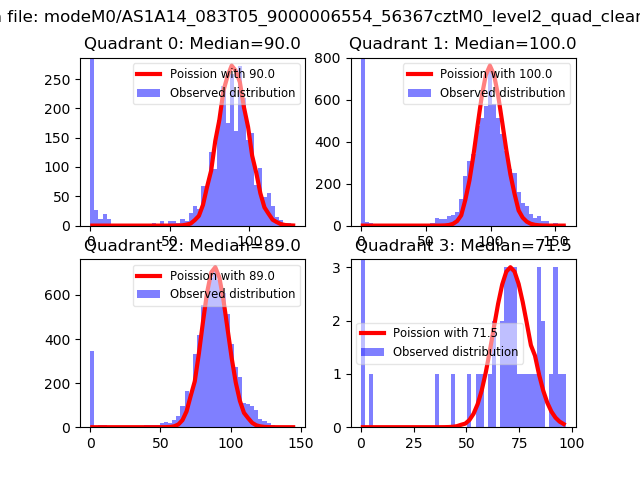 |
 |
| Quadrant-wise count rates Data is divided into 100 sec bins |
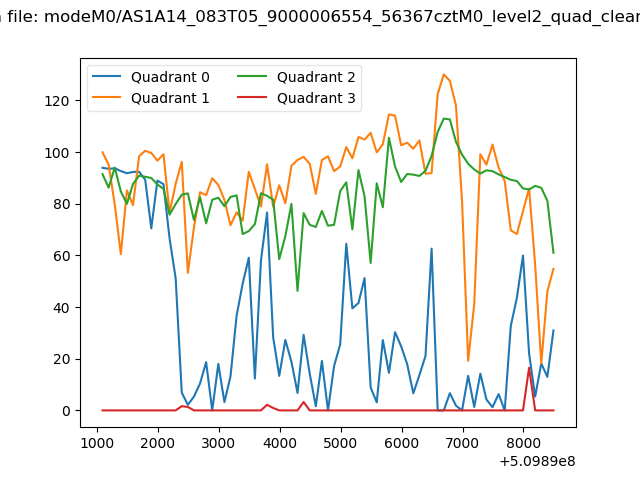 |
|
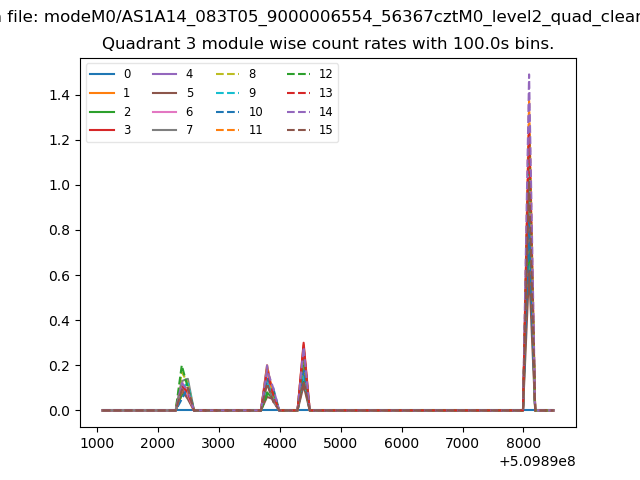
| Module-wise count rates for Quadrant A Data is divided into 100 sec bins |
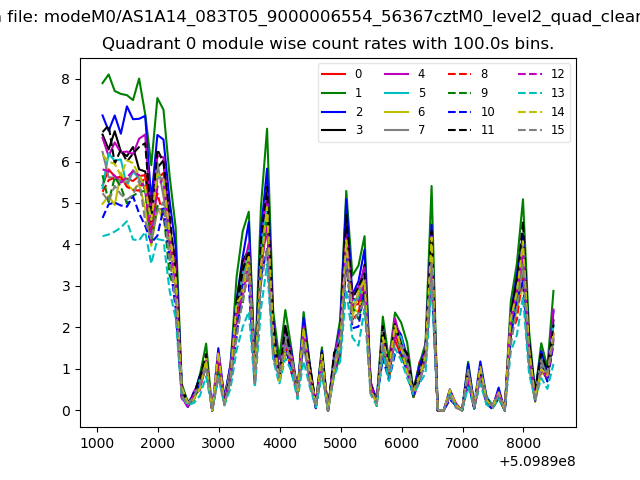 |
 |
| Module-wise count rates for Quadrant B Data is divided into 100 sec bins |
 |
 |
| Module-wise count rates for Quadrant C Data is divided into 100 sec bins |
 |
 |
| Module-wise count rates for Quadrant D Data is divided into 100 sec bins |
 |
 |
| Parameter | Plot |
|---|---|
| CZT HV Monitor | 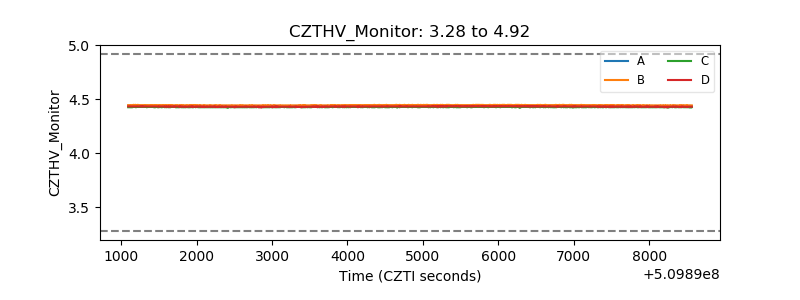 |
| D_VDD |  |
| Temperature 1 | 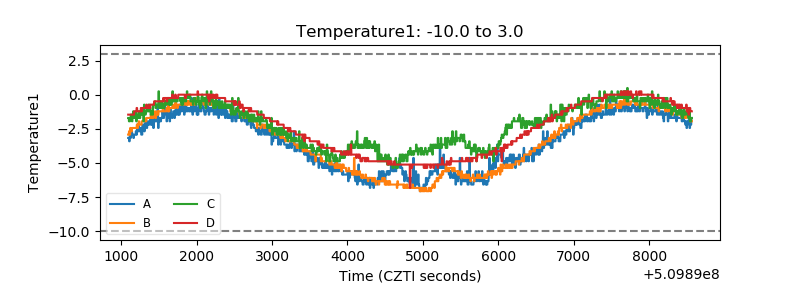 |
| Veto HV Monitor | 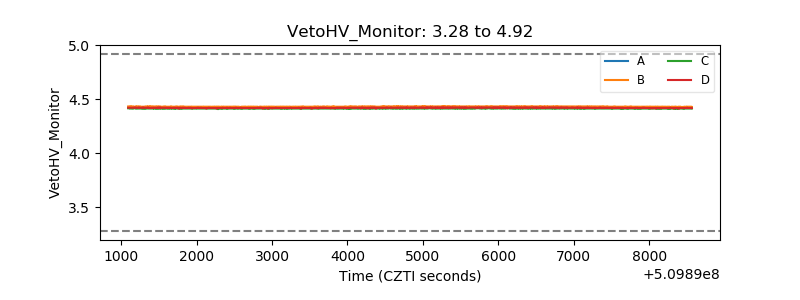 |
| Veto LLD | 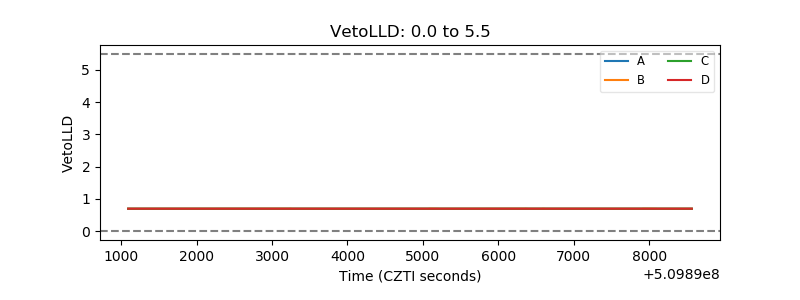 |
| Alpha Counter | 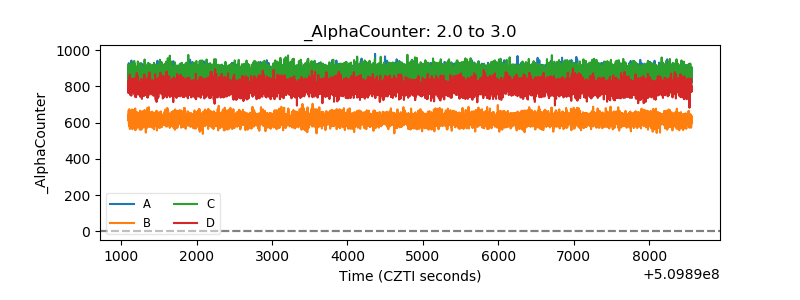 |
| _CPM_Rate | 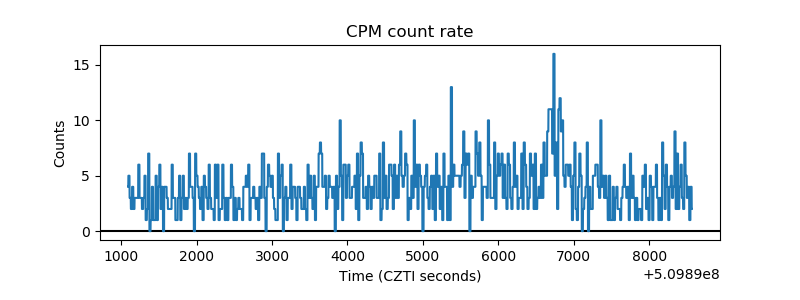 |
| CZT Counter |  |
| +2.5 Volts monitor | 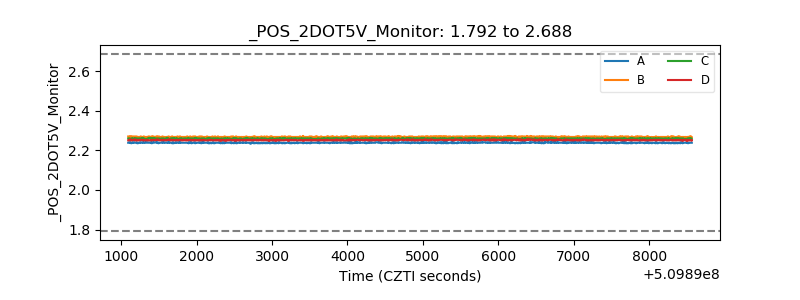 |
| +5 Volts monitor | 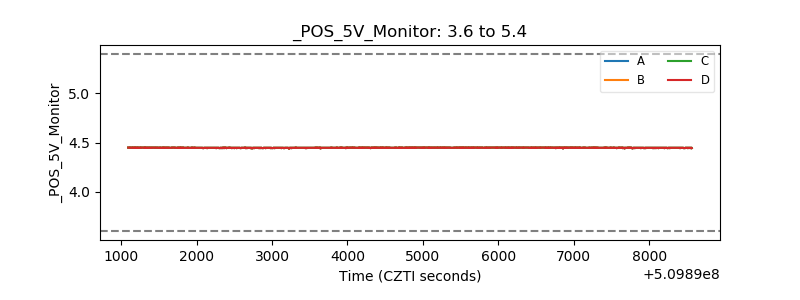 |
| _ROLL_ROT | 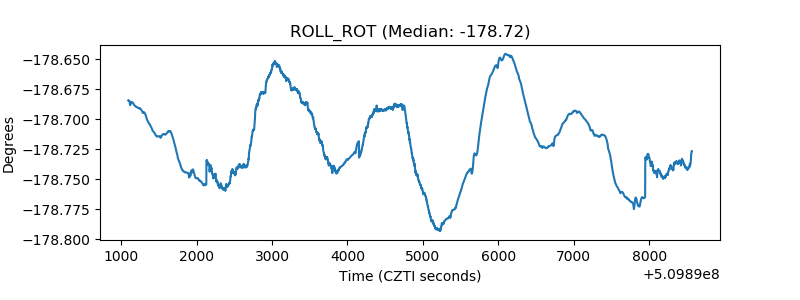 |
| _Roll_DEC |  |
| _Roll_RA |  |
| Veto Counter |  |