| Param | Original file | Final file |
|---|---|---|
| Filename | modeM0/AS1A14_083T05_9000006554_56370cztM0_level2.fits | modeM0/AS1A14_083T05_9000006554_56370cztM0_level2_quad_clean.evt |
| Size (bytes) | 2,832,143,040 | 165,657,600 |
| Size | 2.6 GB | 158.0 MB |
| Events in quadrant A | 37,278,379 | 595,006 |
| Events in quadrant B | 16,830,262 | 1,492,662 |
| Events in quadrant C | 14,455,516 | 1,458,079 |
| Events in quadrant D | 34,875,985 | 218,989 |
| Mode M9 | |||
|---|---|---|---|
| Quadrant | BADHDUFLAG | Total packets | Discarded packets |
| A | 0 | 12 | 0 |
| B | 0 | 12 | 0 |
| C | 0 | 12 | 0 |
| D | 0 | 12 | 0 |
| Mode SS | |||
|---|---|---|---|
| Quadrant | BADHDUFLAG | Total packets | Discarded packets |
| A | 0 | 366 | 0 |
| B | 0 | 366 | 0 |
| C | 0 | 366 | 0 |
| D | 0 | 366 | 0 |
| Mode M0 | |||
|---|---|---|---|
| Quadrant | BADHDUFLAG | Total packets | Discarded packets |
| A | 0 | 122644 | 3 |
| B | 0 | 62388 | 3 |
| C | 0 | 55910 | 3 |
| D | 0 | 115981 | 3 |
| Quadrant | Total seconds | Saturated seconds | Saturation percentage |
|---|---|---|---|
| A | 18128 | 12262 | 67.641218% |
| B | 18128 | 3204 | 17.674316% |
| C | 18128 | 1570 | 8.660635% |
| D | 18128 | 15698 | 86.595322% |
Noise dominated data is calculated using 1-second bins in cleaned event files. If a bin has >2000 counts, and if more than 50% of those come from <1% of pixels, then it is considered to be noise-dominated and hence unusable.
| Quadrant | # 1 sec bins | Bins with >0 counts | Bins with >2000 counts | High rate bins dominated by noise | Noise dominated (total time) | Noise dominated (detector-on time) | Marked lightcurve |
|---|---|---|---|---|---|---|---|
| A | 19357 | 18128 | 11988 | 11988 | 61.93% | 66.13% |  |
| B | 19358 | 18129 | 2253 | 2253 | 11.64% | 12.43% |  |
| C | 19358 | 18130 | 1504 | 1504 | 7.77% | 8.30% | 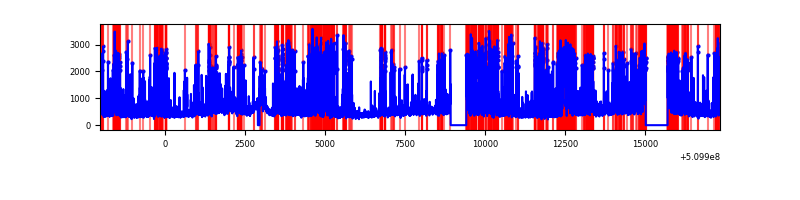 |
| D | 19357 | 18128 | 9850 | 9850 | 50.89% | 54.34% | 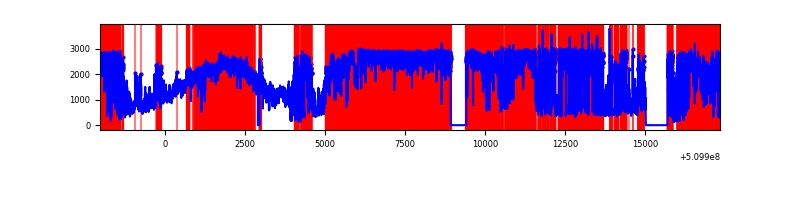 |
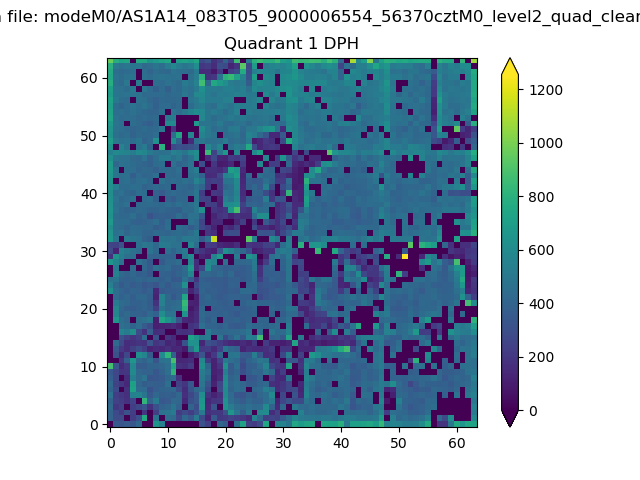
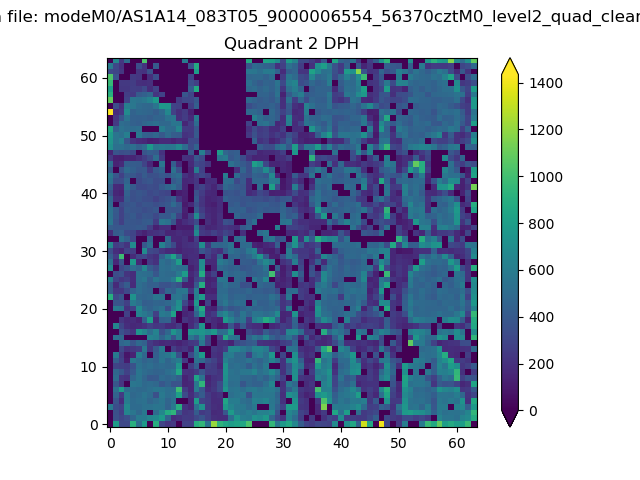
Top three noisy pixels from each quadrant. If the there are fewer than three noisy pixels in the level2.evt file, extra rows are filled as -1
| Pixel properties | Quadrant properties | ||||||
|---|---|---|---|---|---|---|---|
| Quadrant | DetID | PixID | Counts | Sigma | Mean | Median | Sigma |
| A | 12 | 3 | 26757691 | 91883.99 | 1161 | 1133 | 291.2 |
| A | 12 | 194 | 3184429 | 10931.67 | 1161 | 1133 | 291.2 |
| A | 3 | 79 | 813999 | 2791.44 | 1161 | 1133 | 291.2 |
| B | 4 | 206 | 7282461 | 19839.48 | 1734 | 1671 | 367.0 |
| B | 4 | 21 | 779486 | 2119.47 | 1734 | 1671 | 367.0 |
| B | 5 | 185 | 435168 | 1181.24 | 1734 | 1671 | 367.0 |
| C | 12 | 254 | 2865050 | 5819.02 | 1790 | 1769 | 492.1 |
| C | 15 | 230 | 2383399 | 4840.17 | 1790 | 1769 | 492.1 |
| C | 12 | 252 | 1188766 | 2412.32 | 1790 | 1769 | 492.1 |
| D | 8 | 129 | 31739672 | 200125.11 | 546 | 519 | 158.6 |
| D | 2 | 249 | 231051 | 1453.58 | 546 | 519 | 158.6 |
| D | 8 | 240 | 225814 | 1420.55 | 546 | 519 | 158.6 |
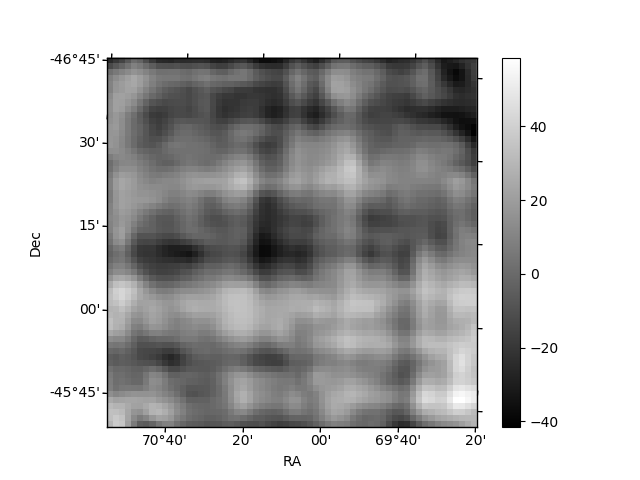
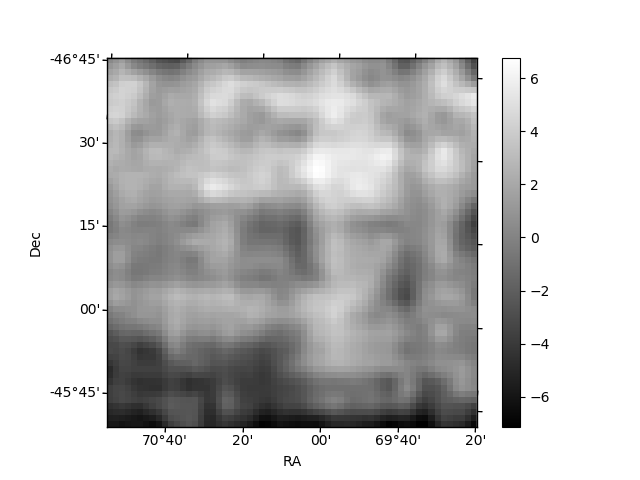
Histogram calculated using DETX and DETY for each event in the final _common_clean file
| Quadrant A |  |
 |
Quadrant B |
|---|---|---|---|
| Quadrant D |  |
 |
Quadrant C |
| Plot type | Count rate plots | Images |
|---|---|---|
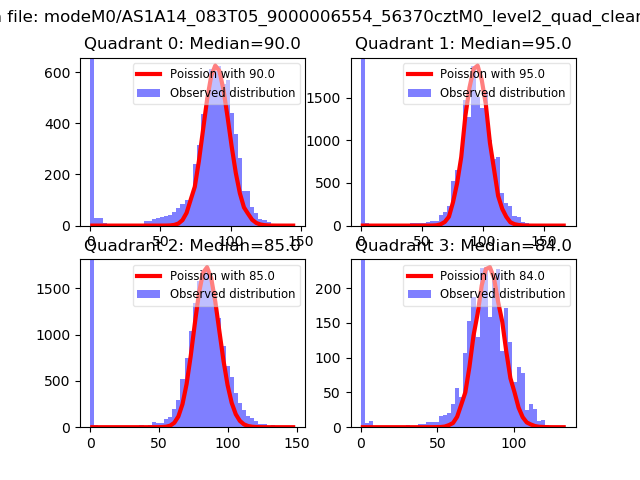
| Comparison with Poisson distribution Blue bars denote a histogram of data divided into 1 sec bins. Red curve is a Poisson curve with rate = median count rate of data. |
 |
 |
| Quadrant-wise count rates Data is divided into 100 sec bins |
 |
|
| Module-wise count rates for Quadrant A Data is divided into 100 sec bins |
 |
 |
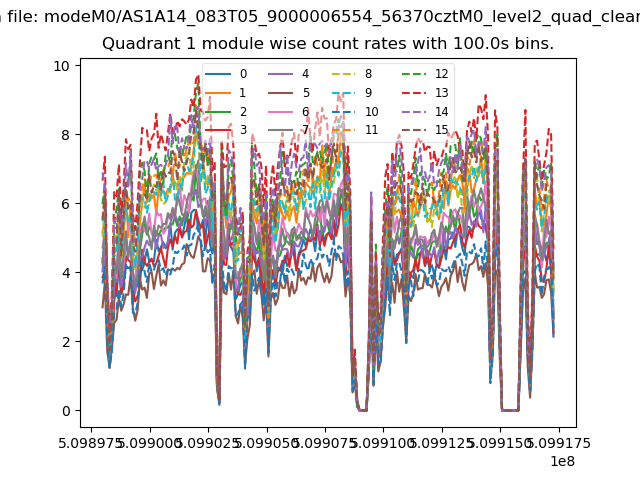
| Module-wise count rates for Quadrant B Data is divided into 100 sec bins |
 |
 |
| Module-wise count rates for Quadrant C Data is divided into 100 sec bins |
 |
 |
| Module-wise count rates for Quadrant D Data is divided into 100 sec bins |
 |
 |
| Parameter | Plot |
|---|---|
| CZT HV Monitor | 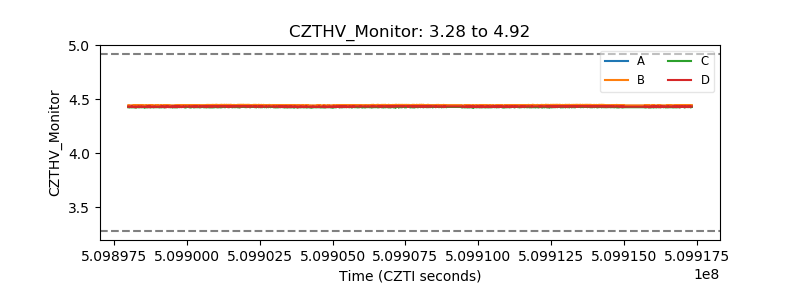 |
| D_VDD |  |
| Temperature 1 | 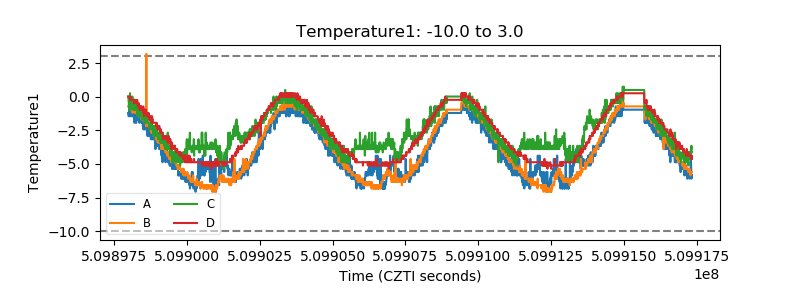 |
| Veto HV Monitor | 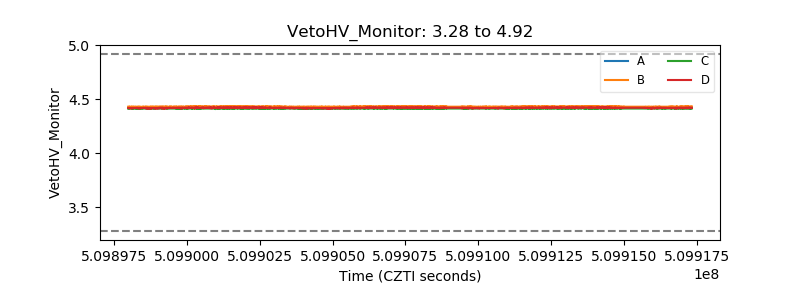 |
| Veto LLD |  |
| Alpha Counter |  |
| _CPM_Rate | 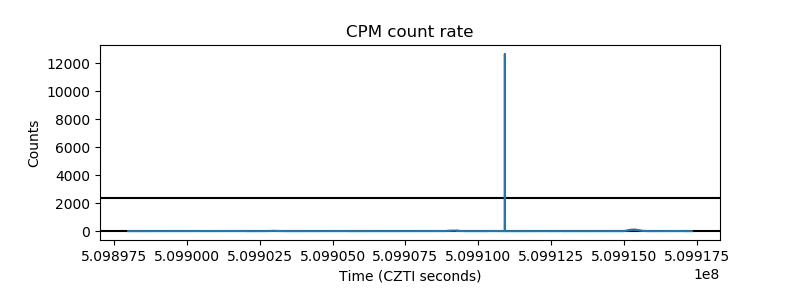 |
| CZT Counter | 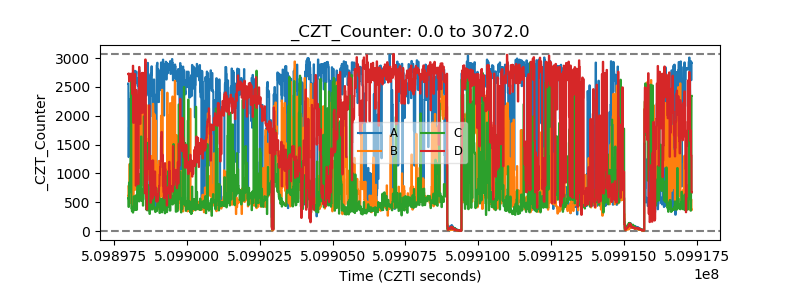 |
| +2.5 Volts monitor | 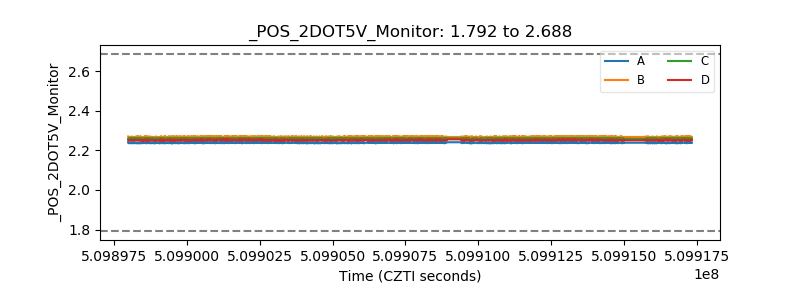 |
| +5 Volts monitor | 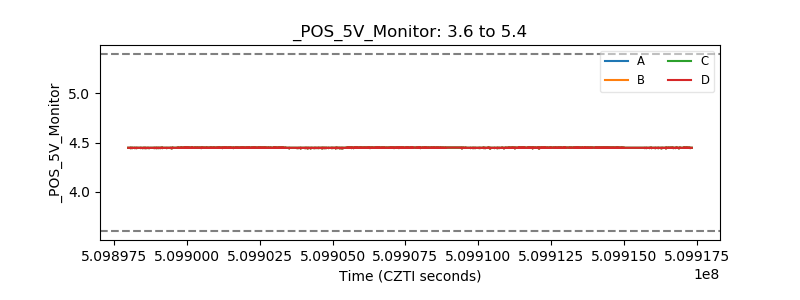 |
| _ROLL_ROT | 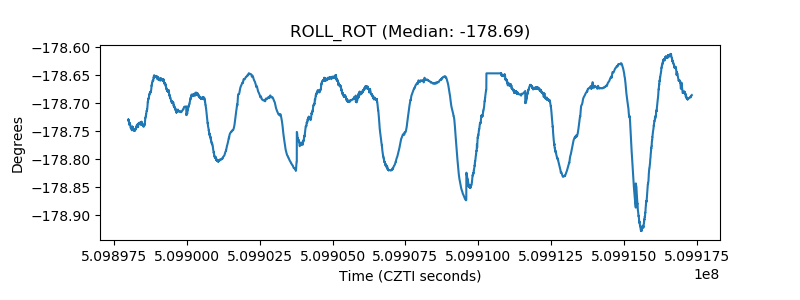 |
| _Roll_DEC | 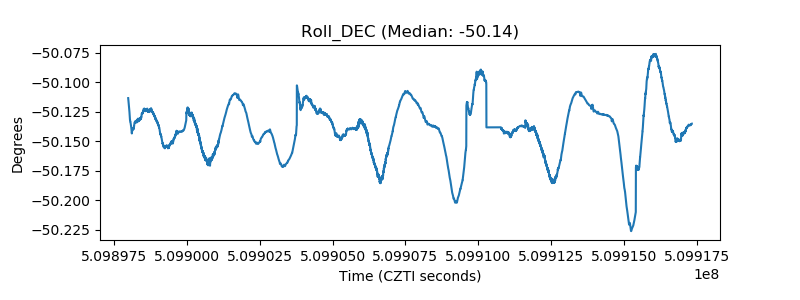 |
| _Roll_RA |  |
| Veto Counter | 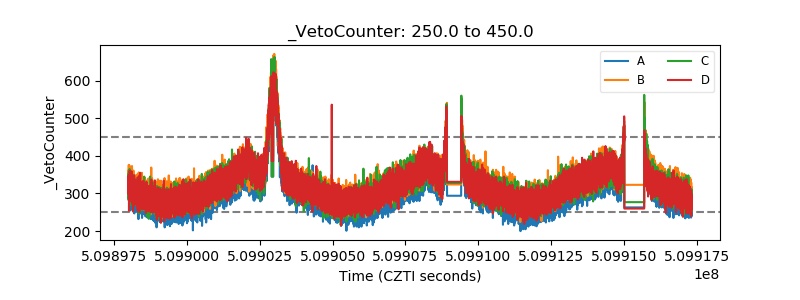 |