| Param | Original file | Final file |
|---|---|---|
| Filename | modeM0/AS1A14_083T05_9000006554_56371cztM0_level2.fits | modeM0/AS1A14_083T05_9000006554_56371cztM0_level2_quad_clean.evt |
| Size (bytes) | 1,036,258,560 | 61,053,120 |
| Size | 988.3 MB | 58.2 MB |
| Events in quadrant A | 14,308,319 | 205,860 |
| Events in quadrant B | 4,500,516 | 631,344 |
| Events in quadrant C | 5,206,614 | 542,240 |
| Events in quadrant D | 13,827,325 | 4,546 |
| Mode M9 | |||
|---|---|---|---|
| Quadrant | BADHDUFLAG | Total packets | Discarded packets |
| A | 0 | 9 | 0 |
| B | 0 | 9 | 0 |
| C | 0 | 9 | 0 |
| D | 0 | 9 | 0 |
| Mode SS | |||
|---|---|---|---|
| Quadrant | BADHDUFLAG | Total packets | Discarded packets |
| A | 0 | 134 | 0 |
| B | 0 | 134 | 0 |
| C | 0 | 134 | 0 |
| D | 0 | 134 | 0 |
| Mode M0 | |||
|---|---|---|---|
| Quadrant | BADHDUFLAG | Total packets | Discarded packets |
| A | 0 | 46847 | 1 |
| B | 0 | 18031 | 1 |
| C | 0 | 20224 | 1 |
| D | 0 | 45685 | 1 |
| Quadrant | Total seconds | Saturated seconds | Saturation percentage |
|---|---|---|---|
| A | 6661 | 4689 | 70.394836% |
| B | 6661 | 432 | 6.485513% |
| C | 6661 | 653 | 9.803333% |
| D | 6662 | 6603 | 99.114380% |
Noise dominated data is calculated using 1-second bins in cleaned event files. If a bin has >2000 counts, and if more than 50% of those come from <1% of pixels, then it is considered to be noise-dominated and hence unusable.
| Quadrant | # 1 sec bins | Bins with >0 counts | Bins with >2000 counts | High rate bins dominated by noise | Noise dominated (total time) | Noise dominated (detector-on time) | Marked lightcurve |
|---|---|---|---|---|---|---|---|
| A | 7505 | 6660 | 4672 | 4672 | 62.25% | 70.15% |  |
| B | 7506 | 6662 | 371 | 371 | 4.94% | 5.57% |  |
| C | 7506 | 6662 | 645 | 645 | 8.59% | 9.68% |  |
| D | 7506 | 6661 | 3897 | 3897 | 51.92% | 58.50% |  |
Top three noisy pixels from each quadrant. If the there are fewer than three noisy pixels in the level2.evt file, extra rows are filled as -1
| Pixel properties | Quadrant properties | ||||||
|---|---|---|---|---|---|---|---|
| Quadrant | DetID | PixID | Counts | Sigma | Mean | Median | Sigma |
| A | 12 | 3 | 10136940 | 96913.25 | 407 | 398 | 104.6 |
| A | 12 | 194 | 1209472 | 11559.69 | 407 | 398 | 104.6 |
| A | 4 | 95 | 681794 | 6514.68 | 407 | 398 | 104.6 |
| B | 4 | 206 | 784013 | 5509.9 | 672 | 649 | 142.2 |
| B | 5 | 185 | 261484 | 1834.62 | 672 | 649 | 142.2 |
| B | 10 | 247 | 170008 | 1191.21 | 672 | 649 | 142.2 |
| C | 15 | 230 | 1698392 | 9688.38 | 635 | 629 | 175.2 |
| C | 12 | 252 | 339756 | 1935.25 | 635 | 629 | 175.2 |
| C | 13 | 3 | 269185 | 1532.53 | 635 | 629 | 175.2 |
| D | 8 | 129 | 13537677 | 969825.81 | 41 | 39 | 14.0 |
| D | 6 | 239 | 35088 | 2510.88 | 41 | 39 | 14.0 |
| D | 7 | 96 | 25784 | 1844.35 | 41 | 39 | 14.0 |
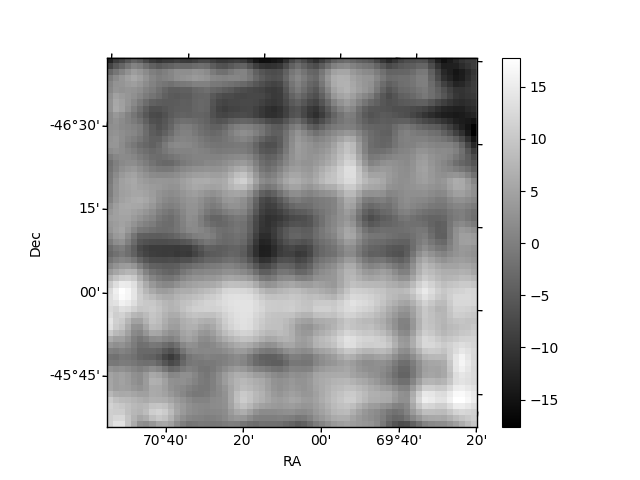
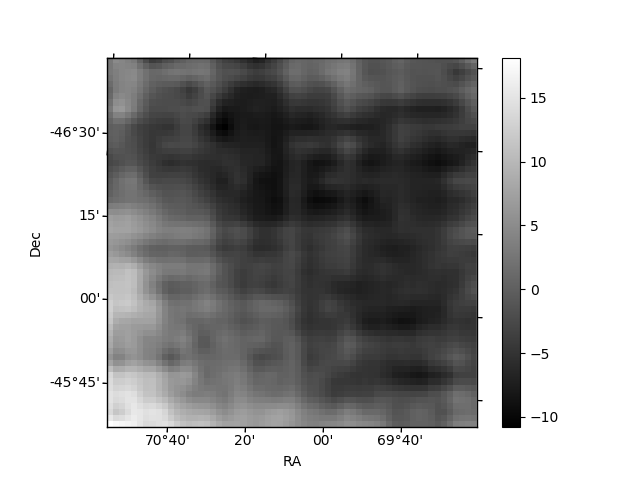
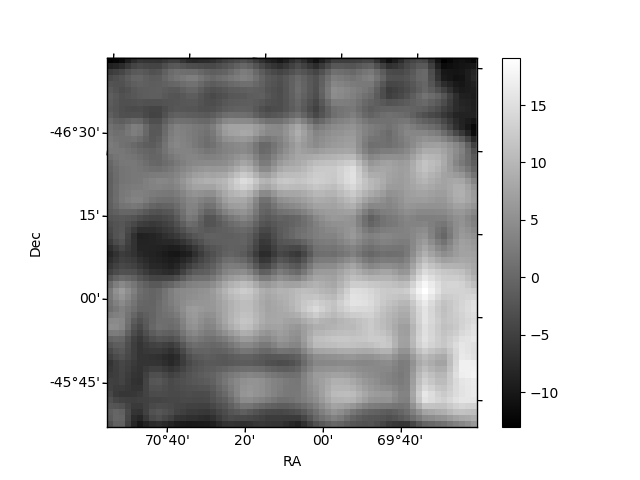
Histogram calculated using DETX and DETY for each event in the final _common_clean file
| Quadrant A | 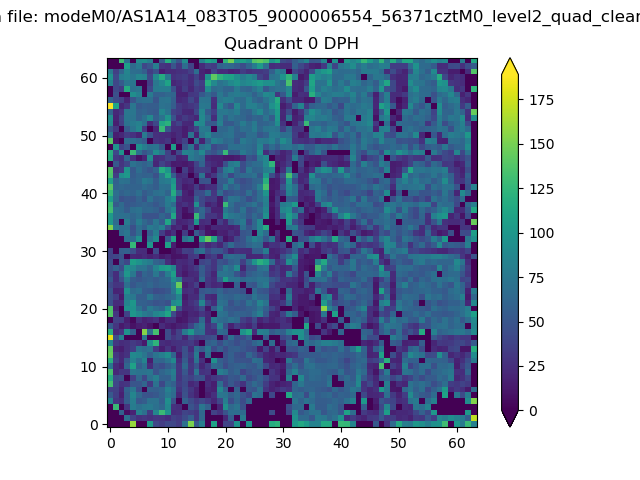 |
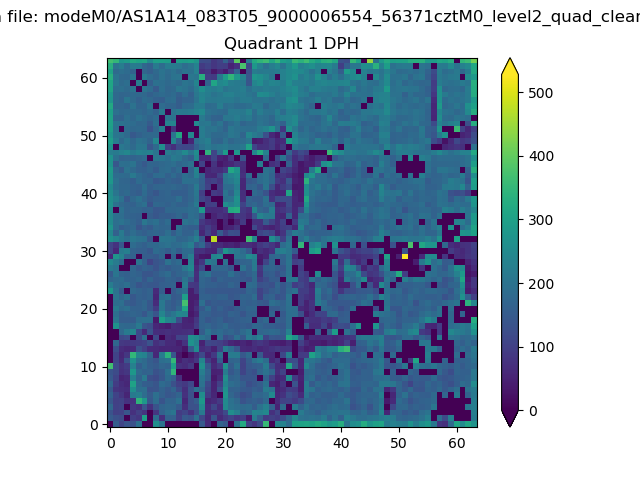 |
Quadrant B |
|---|---|---|---|
| Quadrant D |  |
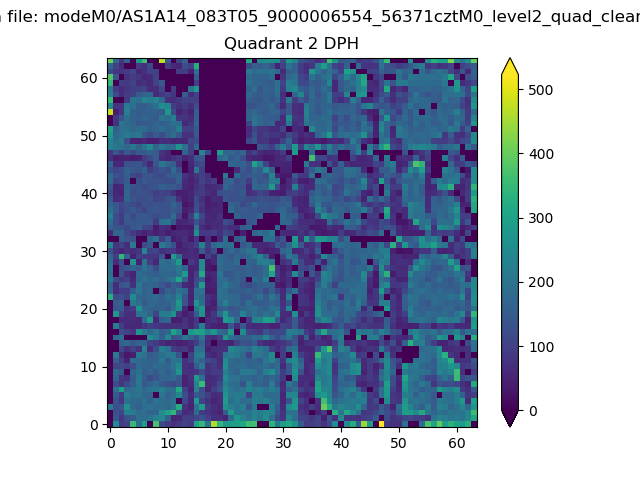 |
Quadrant C |
| Plot type | Count rate plots | Images |
|---|---|---|
| Comparison with Poisson distribution Blue bars denote a histogram of data divided into 1 sec bins. Red curve is a Poisson curve with rate = median count rate of data. |
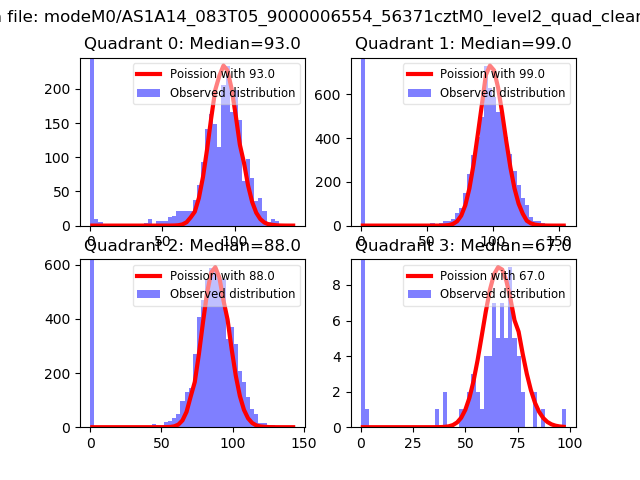 |
 |
| Quadrant-wise count rates Data is divided into 100 sec bins |
 |
|
| Module-wise count rates for Quadrant A Data is divided into 100 sec bins |
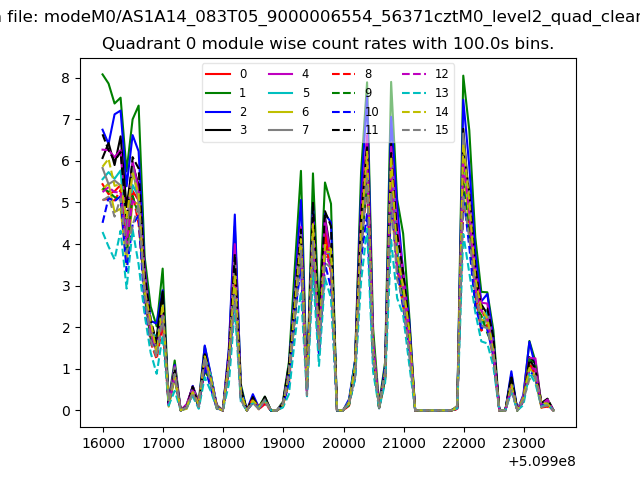 |
 |
| Module-wise count rates for Quadrant B Data is divided into 100 sec bins |
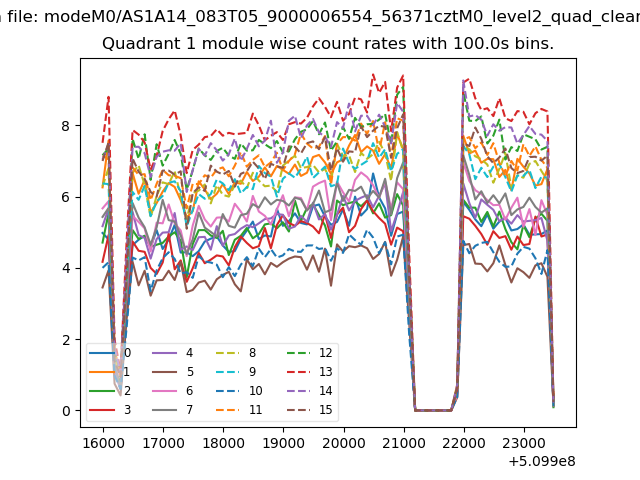 |
 |
| Module-wise count rates for Quadrant C Data is divided into 100 sec bins |
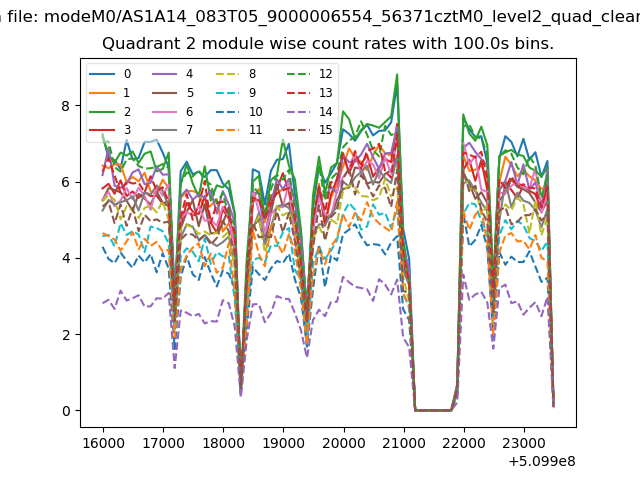 |
 |
| Module-wise count rates for Quadrant D Data is divided into 100 sec bins |
 |
 |
| Parameter | Plot |
|---|---|
| CZT HV Monitor | 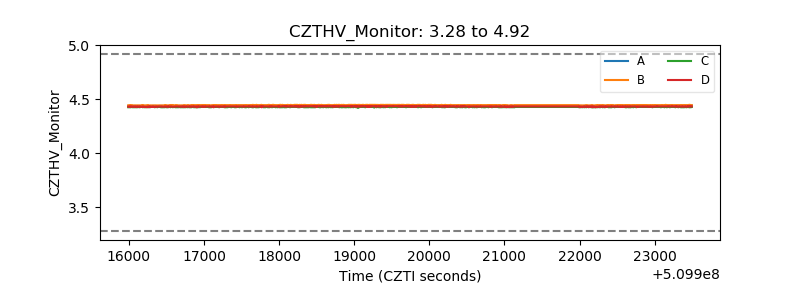 |
| D_VDD |  |
| Temperature 1 | 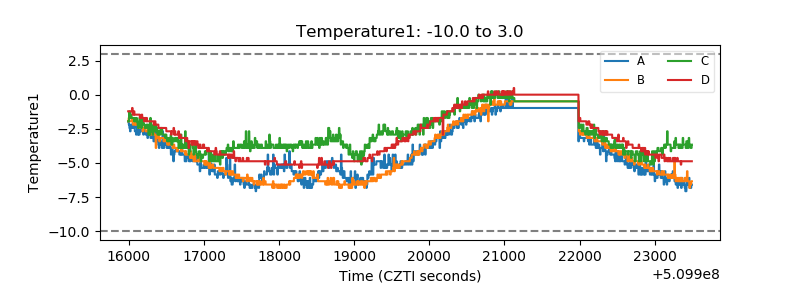 |
| Veto HV Monitor |  |
| Veto LLD | 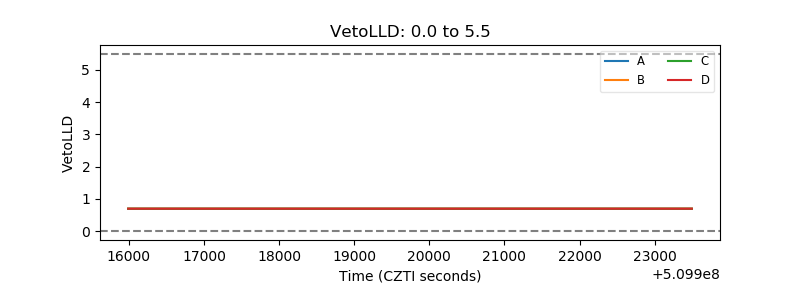 |
| Alpha Counter |  |
| _CPM_Rate | 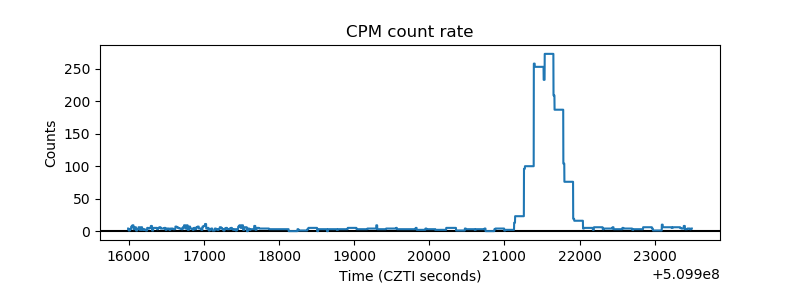 |
| CZT Counter | 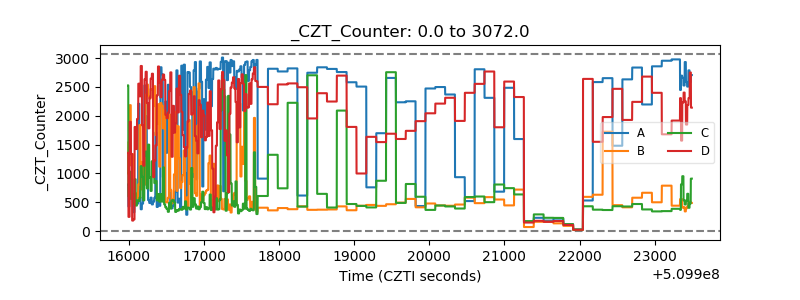 |
| +2.5 Volts monitor | 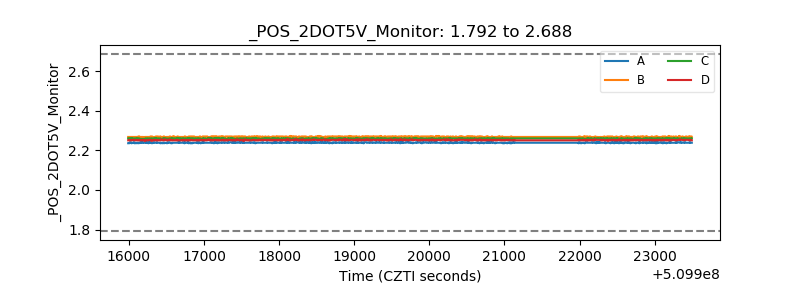 |
| +5 Volts monitor | 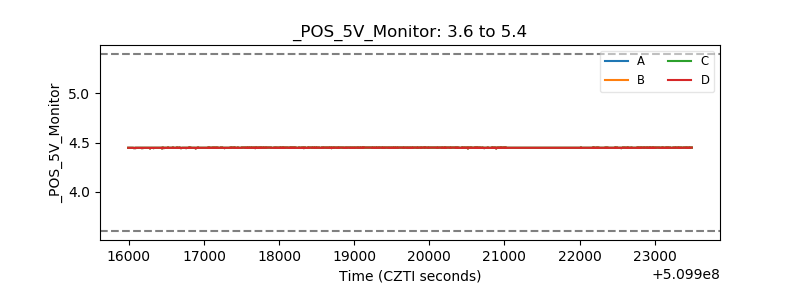 |
| _ROLL_ROT |  |
| _Roll_DEC |  |
| _Roll_RA |  |
| Veto Counter |  |