| Param | Original file | Final file |
|---|---|---|
| Filename | modeM0/AS1A14_083T05_9000006554_56374cztM0_level2.fits | modeM0/AS1A14_083T05_9000006554_56374cztM0_level2_quad_clean.evt |
| Size (bytes) | 822,369,600 | 79,767,360 |
| Size | 784.3 MB | 76.1 MB |
| Events in quadrant A | 15,505,744 | 156,082 |
| Events in quadrant B | 3,539,616 | 700,326 |
| Events in quadrant C | 4,694,216 | 596,052 |
| Events in quadrant D | 6,178,804 | 492,377 |
| Mode M9 | |||
|---|---|---|---|
| Quadrant | BADHDUFLAG | Total packets | Discarded packets |
| A | 0 | 17 | 0 |
| B | 0 | 17 | 0 |
| C | 0 | 18 | 0 |
| D | 0 | 18 | 0 |
| Mode SS | |||
|---|---|---|---|
| Quadrant | BADHDUFLAG | Total packets | Discarded packets |
| A | 0 | 138 | 0 |
| B | 0 | 138 | 0 |
| C | 0 | 138 | 0 |
| D | 0 | 138 | 0 |
| Mode M0 | |||
|---|---|---|---|
| Quadrant | BADHDUFLAG | Total packets | Discarded packets |
| A | 0 | 50545 | 2 |
| B | 0 | 15216 | 2 |
| C | 0 | 18807 | 2 |
| D | 0 | 23089 | 2 |
| Quadrant | Total seconds | Saturated seconds | Saturation percentage |
|---|---|---|---|
| A | 6745 | 5325 | 78.947368% |
| B | 6745 | 85 | 1.260193% |
| C | 6745 | 322 | 4.773907% |
| D | 6745 | 994 | 14.736842% |
Noise dominated data is calculated using 1-second bins in cleaned event files. If a bin has >2000 counts, and if more than 50% of those come from <1% of pixels, then it is considered to be noise-dominated and hence unusable.
| Quadrant | # 1 sec bins | Bins with >0 counts | Bins with >2000 counts | High rate bins dominated by noise | Noise dominated (total time) | Noise dominated (detector-on time) | Marked lightcurve |
|---|---|---|---|---|---|---|---|
| A | 7844 | 6745 | 5295 | 5295 | 67.50% | 78.50% |  |
| B | 7845 | 6746 | 45 | 45 | 0.57% | 0.67% |  |
| C | 7845 | 6746 | 307 | 307 | 3.91% | 4.55% |  |
| D | 7845 | 6746 | 1002 | 1002 | 12.77% | 14.85% |  |
Top three noisy pixels from each quadrant. If the there are fewer than three noisy pixels in the level2.evt file, extra rows are filled as -1
| Pixel properties | Quadrant properties | ||||||
|---|---|---|---|---|---|---|---|
| Quadrant | DetID | PixID | Counts | Sigma | Mean | Median | Sigma |
| A | 12 | 3 | 10363903 | 109547.56 | 373 | 363 | 94.6 |
| A | 7 | 64 | 1304920 | 13789.79 | 373 | 363 | 94.6 |
| A | 12 | 194 | 1241179 | 13116.02 | 373 | 363 | 94.6 |
| B | 0 | 213 | 123433 | 799.56 | 714 | 690 | 153.5 |
| B | 10 | 247 | 119219 | 772.11 | 714 | 690 | 153.5 |
| B | 8 | 128 | 77630 | 501.19 | 714 | 690 | 153.5 |
| C | 15 | 230 | 567095 | 3035.04 | 684 | 678 | 186.6 |
| C | 5 | 250 | 450169 | 2408.51 | 684 | 678 | 186.6 |
| C | 12 | 254 | 338661 | 1811.02 | 684 | 678 | 186.6 |
| D | 8 | 129 | 2829918 | 15739.1 | 637 | 607 | 179.8 |
| D | 2 | 249 | 506556 | 2814.53 | 637 | 607 | 179.8 |
| D | 6 | 239 | 98963 | 547.14 | 637 | 607 | 179.8 |
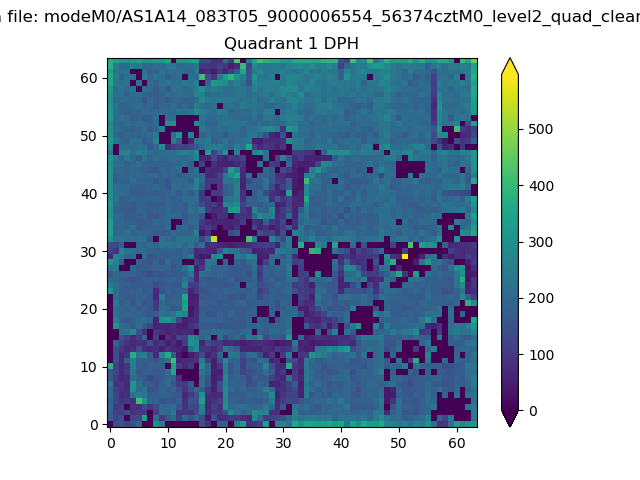
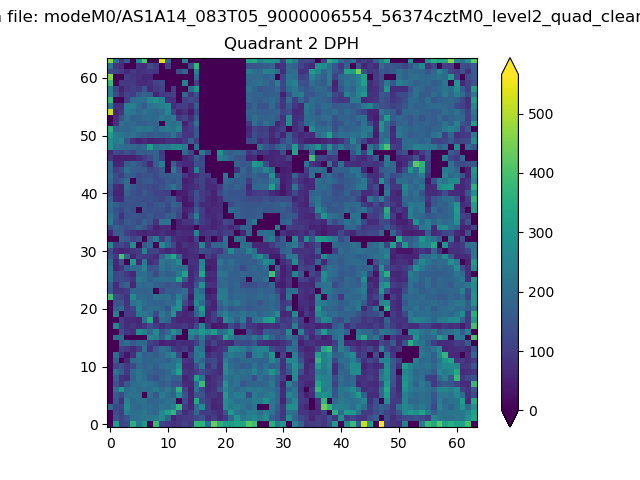
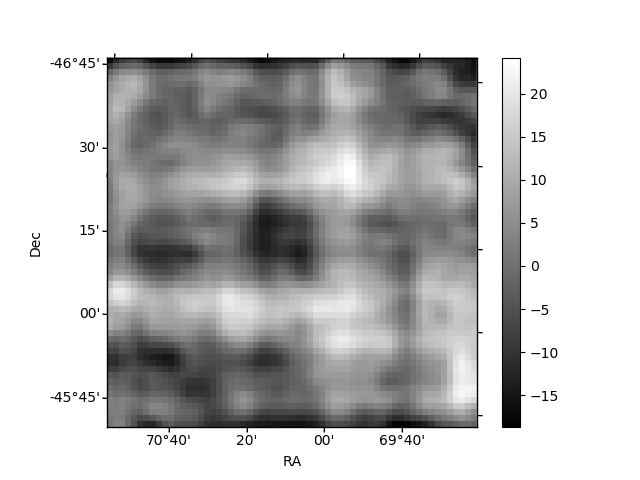
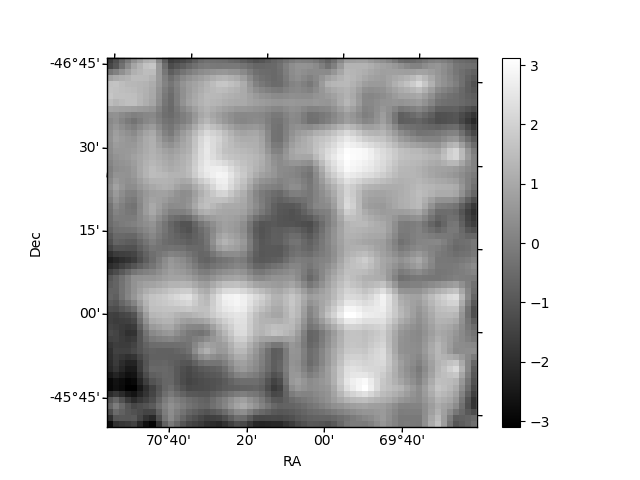
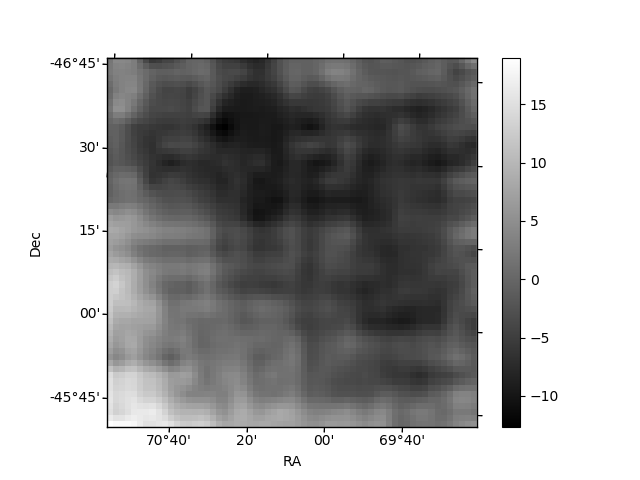
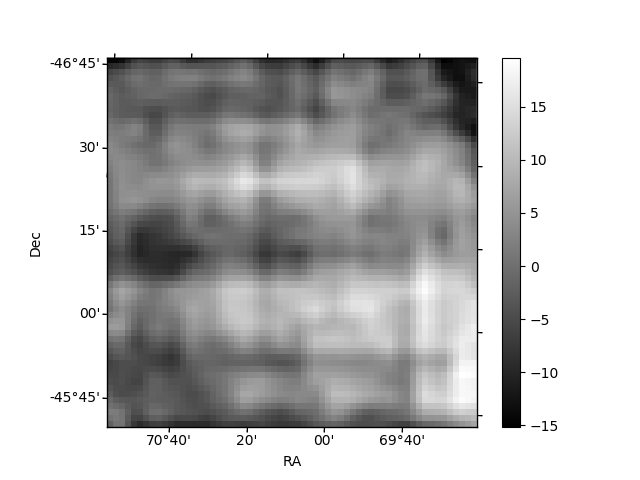
Histogram calculated using DETX and DETY for each event in the final _common_clean file
| Quadrant A | 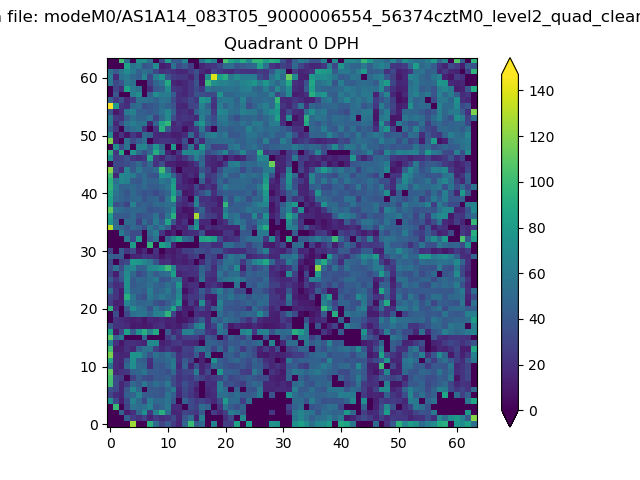 |
 |
Quadrant B |
|---|---|---|---|
| Quadrant D |  |
 |
Quadrant C |
| Plot type | Count rate plots | Images |
|---|---|---|
| Comparison with Poisson distribution Blue bars denote a histogram of data divided into 1 sec bins. Red curve is a Poisson curve with rate = median count rate of data. |
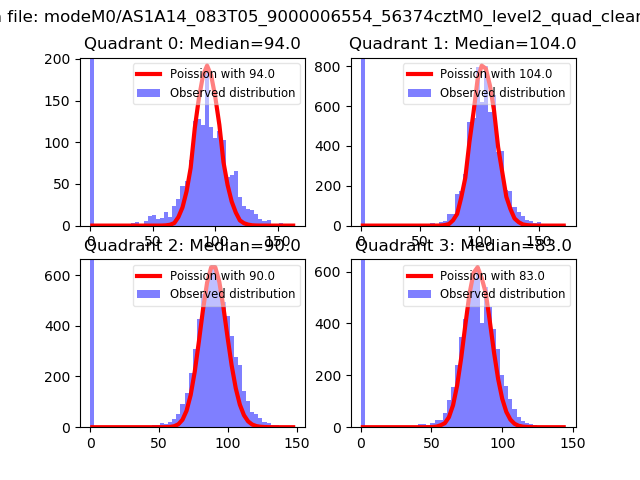 |
 |
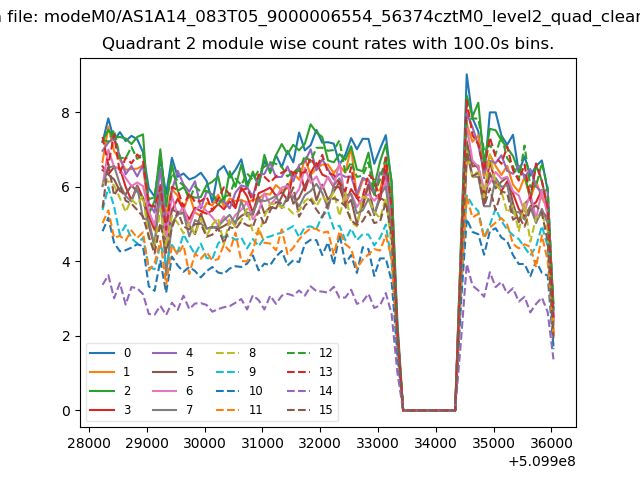
| Quadrant-wise count rates Data is divided into 100 sec bins |
 |
|
| Module-wise count rates for Quadrant A Data is divided into 100 sec bins |
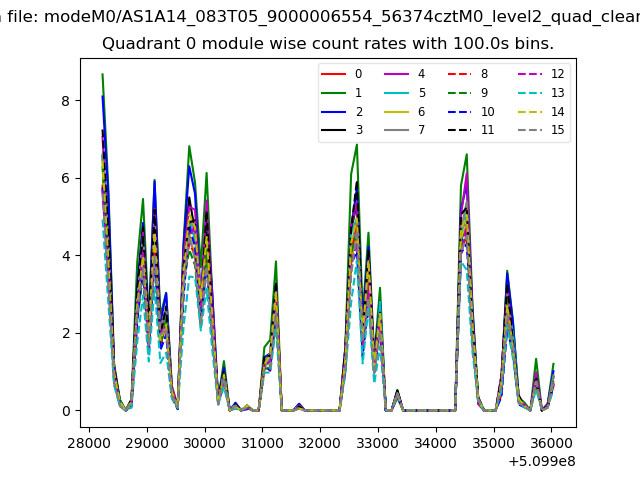 |
 |
| Module-wise count rates for Quadrant B Data is divided into 100 sec bins |
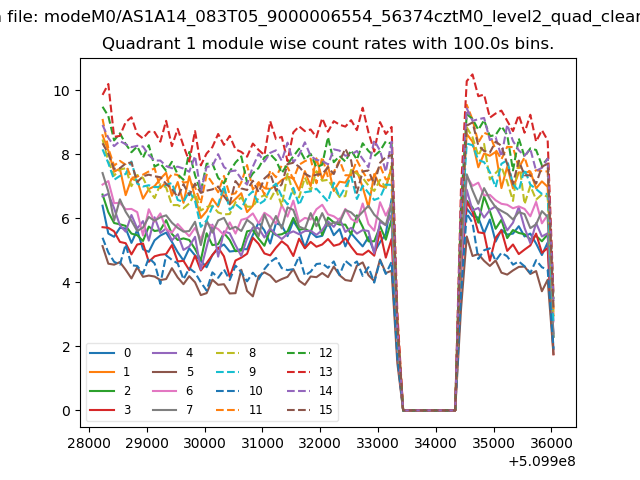 |
 |
| Module-wise count rates for Quadrant C Data is divided into 100 sec bins |
 |
 |
| Module-wise count rates for Quadrant D Data is divided into 100 sec bins |
 |
 |
| Parameter | Plot |
|---|---|
| CZT HV Monitor | 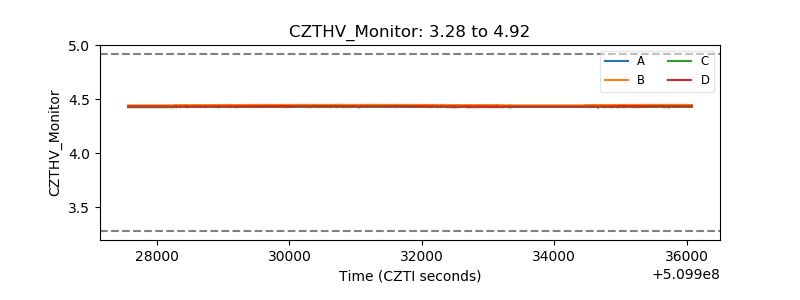 |
| D_VDD |  |
| Temperature 1 | 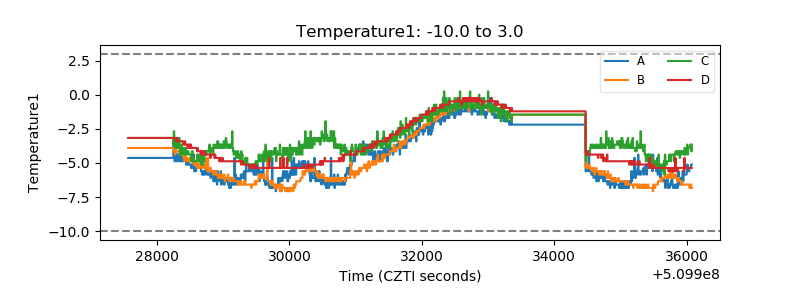 |
| Veto HV Monitor |  |
| Veto LLD |  |
| Alpha Counter |  |
| _CPM_Rate | 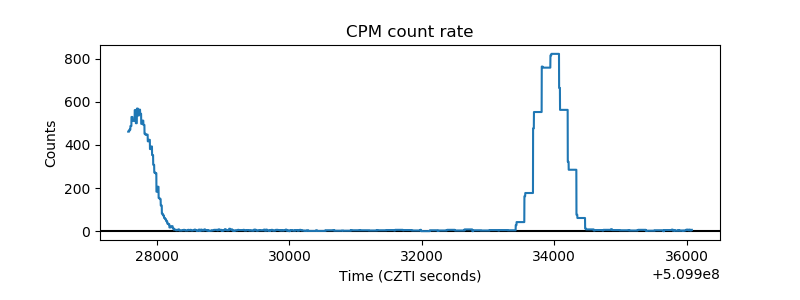 |
| CZT Counter | 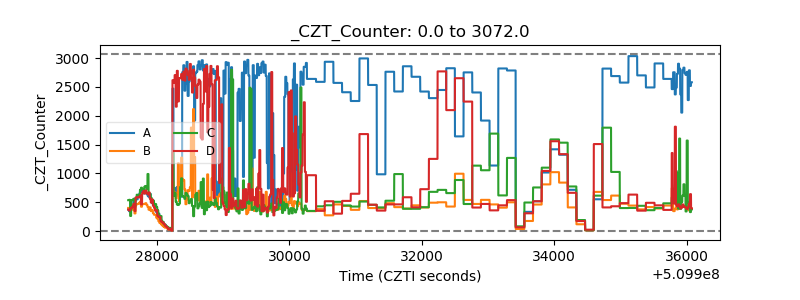 |
| +2.5 Volts monitor | 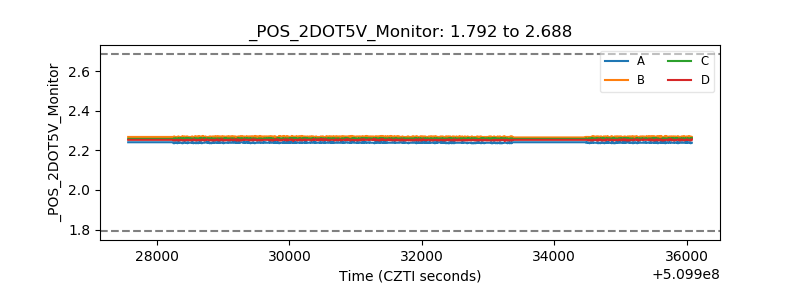 |
| +5 Volts monitor | 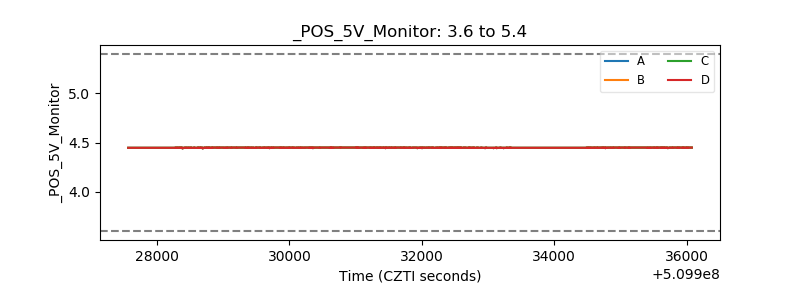 |
| _ROLL_ROT |  |
| _Roll_DEC |  |
| _Roll_RA |  |
| Veto Counter |  |