| Param | Original file | Final file |
|---|---|---|
| Filename | modeM0/AS1A14_083T05_9000006554_56375cztM0_level2.fits | modeM0/AS1A14_083T05_9000006554_56375cztM0_level2_quad_clean.evt |
| Size (bytes) | 696,752,640 | 74,439,360 |
| Size | 664.5 MB | 71.0 MB |
| Events in quadrant A | 14,072,962 | 146,433 |
| Events in quadrant B | 3,059,615 | 638,042 |
| Events in quadrant C | 4,160,953 | 534,263 |
| Events in quadrant D | 4,029,722 | 514,571 |
| Mode M9 | |||
|---|---|---|---|
| Quadrant | BADHDUFLAG | Total packets | Discarded packets |
| A | 0 | 12 | 0 |
| B | 0 | 12 | 0 |
| C | 0 | 12 | 0 |
| D | 0 | 12 | 0 |
| Mode SS | |||
|---|---|---|---|
| Quadrant | BADHDUFLAG | Total packets | Discarded packets |
| A | 0 | 120 | 0 |
| B | 0 | 120 | 0 |
| C | 0 | 120 | 0 |
| D | 0 | 120 | 0 |
| Mode M0 | |||
|---|---|---|---|
| Quadrant | BADHDUFLAG | Total packets | Discarded packets |
| A | 0 | 45817 | 1 |
| B | 0 | 13188 | 1 |
| C | 0 | 16635 | 1 |
| D | 0 | 16276 | 1 |
| Quadrant | Total seconds | Saturated seconds | Saturation percentage |
|---|---|---|---|
| A | 6030 | 4764 | 79.004975% |
| B | 6030 | 78 | 1.293532% |
| C | 6031 | 394 | 6.532913% |
| D | 6031 | 182 | 3.017742% |
Noise dominated data is calculated using 1-second bins in cleaned event files. If a bin has >2000 counts, and if more than 50% of those come from <1% of pixels, then it is considered to be noise-dominated and hence unusable.
| Quadrant | # 1 sec bins | Bins with >0 counts | Bins with >2000 counts | High rate bins dominated by noise | Noise dominated (total time) | Noise dominated (detector-on time) | Marked lightcurve |
|---|---|---|---|---|---|---|---|
| A | 7169 | 6029 | 4698 | 4698 | 65.53% | 77.92% |  |
| B | 7169 | 6029 | 20 | 20 | 0.28% | 0.33% |  |
| C | 7170 | 6030 | 348 | 348 | 4.85% | 5.77% |  |
| D | 7170 | 6030 | 160 | 160 | 2.23% | 2.65% |  |
Top three noisy pixels from each quadrant. If the there are fewer than three noisy pixels in the level2.evt file, extra rows are filled as -1
| Pixel properties | Quadrant properties | ||||||
|---|---|---|---|---|---|---|---|
| Quadrant | DetID | PixID | Counts | Sigma | Mean | Median | Sigma |
| A | 7 | 64 | 5644082 | 61091.55 | 364 | 354 | 92.4 |
| A | 12 | 3 | 4544836 | 49192.56 | 364 | 354 | 92.4 |
| A | 4 | 95 | 1557807 | 16858.93 | 364 | 354 | 92.4 |
| B | 5 | 172 | 163280 | 1181.46 | 647 | 625 | 137.7 |
| B | 3 | 145 | 54210 | 389.22 | 647 | 625 | 137.7 |
| B | 4 | 21 | 53281 | 382.47 | 647 | 625 | 137.7 |
| C | 15 | 230 | 940604 | 5547.44 | 618 | 614 | 169.4 |
| C | 12 | 254 | 276627 | 1628.92 | 618 | 614 | 169.4 |
| C | 13 | 3 | 232934 | 1371.06 | 618 | 614 | 169.4 |
| D | 8 | 129 | 698223 | 3887.48 | 626 | 596 | 179.5 |
| D | 2 | 249 | 565481 | 3147.78 | 626 | 596 | 179.5 |
| D | 2 | 31 | 116279 | 644.64 | 626 | 596 | 179.5 |
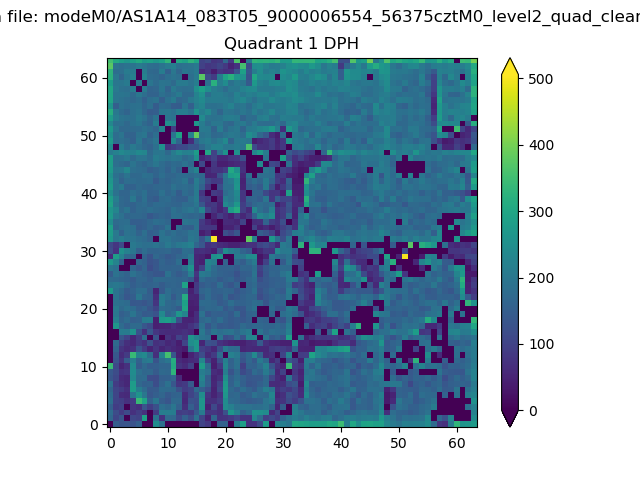
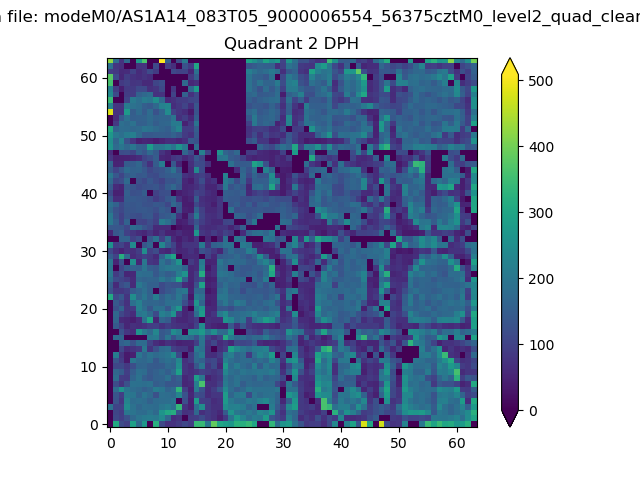
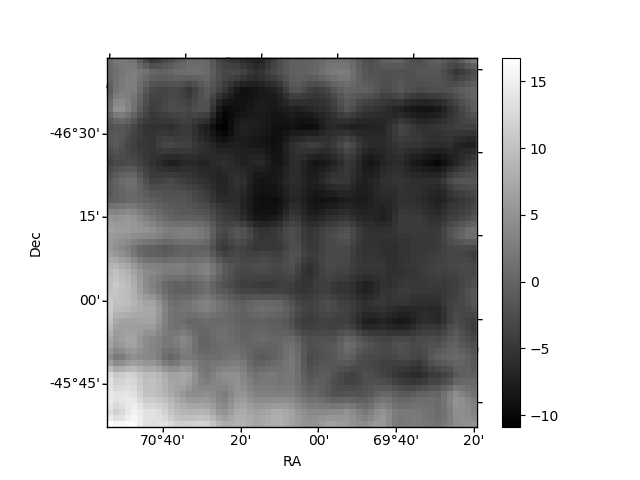
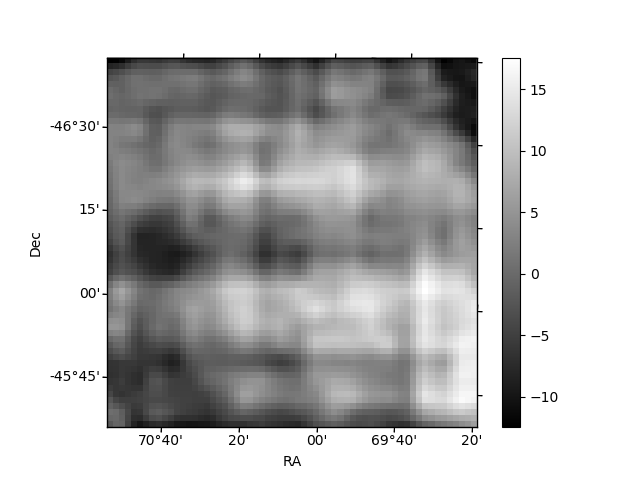
Histogram calculated using DETX and DETY for each event in the final _common_clean file
| Quadrant A |  |
 |
Quadrant B |
|---|---|---|---|
| Quadrant D |  |
 |
Quadrant C |
| Plot type | Count rate plots | Images |
|---|---|---|
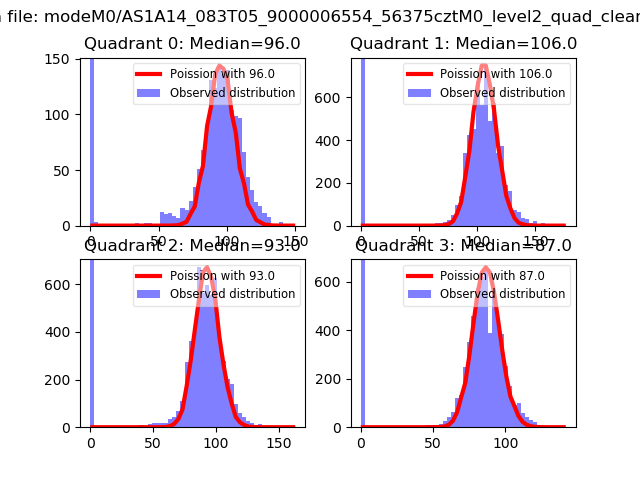
| Comparison with Poisson distribution Blue bars denote a histogram of data divided into 1 sec bins. Red curve is a Poisson curve with rate = median count rate of data. |
 |
 |
| Quadrant-wise count rates Data is divided into 100 sec bins |
 |
|
| Module-wise count rates for Quadrant A Data is divided into 100 sec bins |
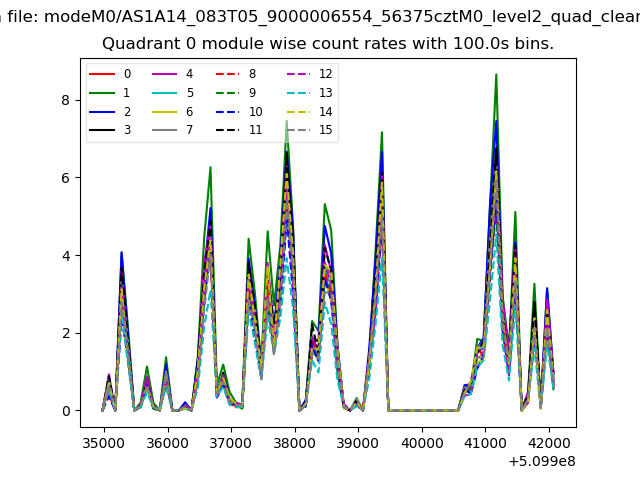 |
 |
| Module-wise count rates for Quadrant B Data is divided into 100 sec bins |
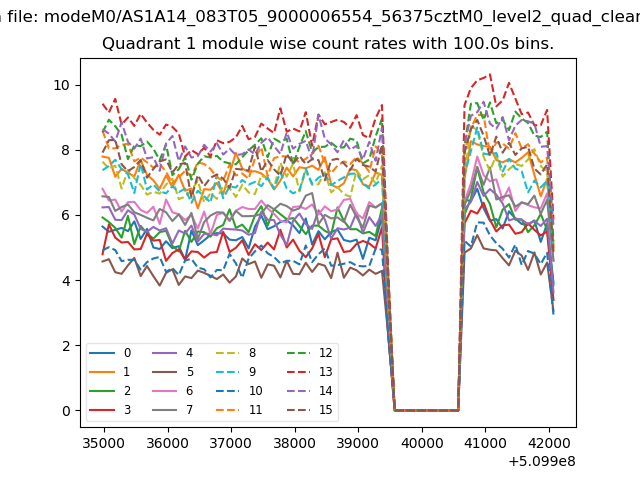 |
 |
| Module-wise count rates for Quadrant C Data is divided into 100 sec bins |
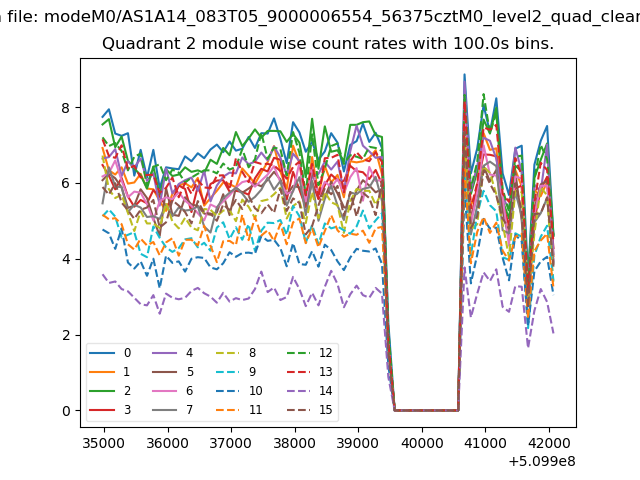 |
 |
| Module-wise count rates for Quadrant D Data is divided into 100 sec bins |
 |
 |
| Parameter | Plot |
|---|---|
| CZT HV Monitor | 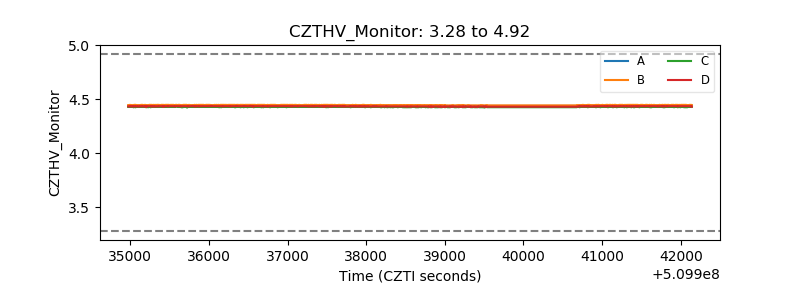 |
| D_VDD |  |
| Temperature 1 | 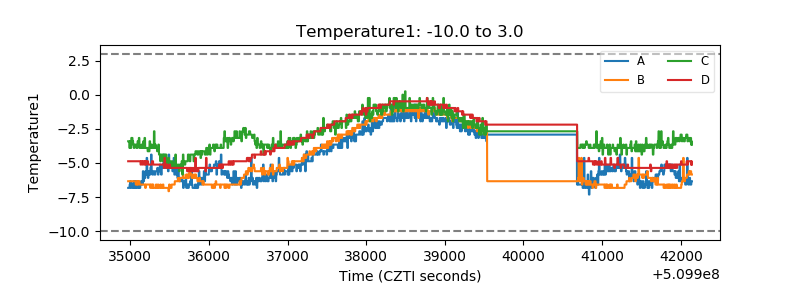 |
| Veto HV Monitor |  |
| Veto LLD |  |
| Alpha Counter |  |
| _CPM_Rate | 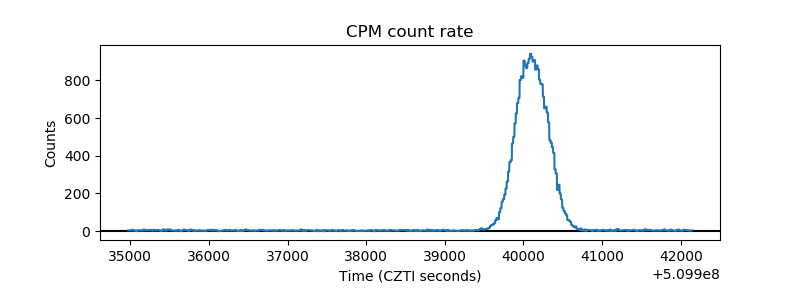 |
| CZT Counter | 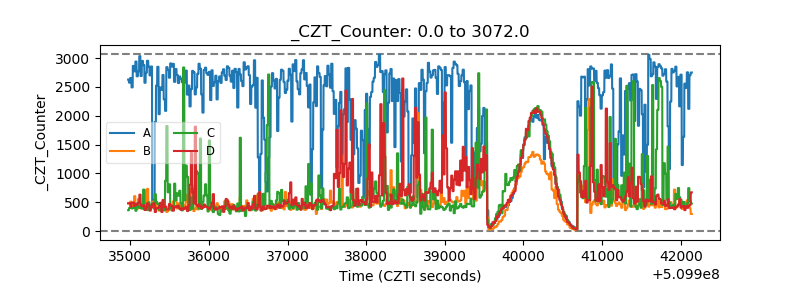 |
| +2.5 Volts monitor | 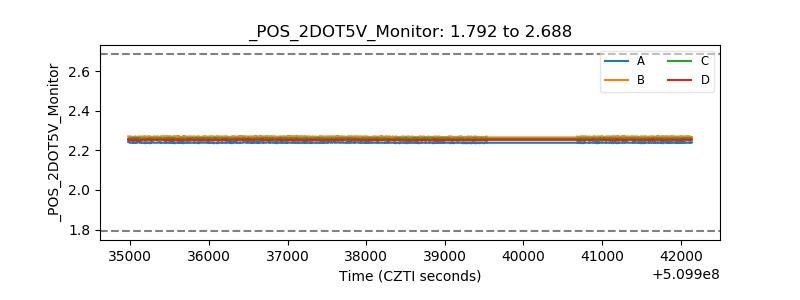 |
| +5 Volts monitor | 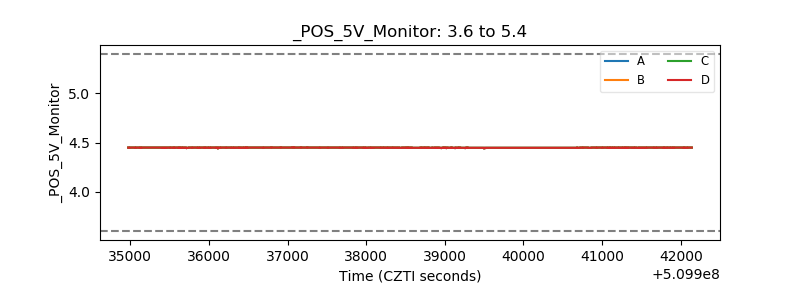 |
| _ROLL_ROT |  |
| _Roll_DEC |  |
| _Roll_RA |  |
| Veto Counter |  |