| Param | Original file | Final file |
|---|---|---|
| Filename | modeM0/AS1A14_083T05_9000006554_56376cztM0_level2.fits | modeM0/AS1A14_083T05_9000006554_56376cztM0_level2_quad_clean.evt |
| Size (bytes) | 609,595,200 | 82,082,880 |
| Size | 581.4 MB | 78.3 MB |
| Events in quadrant A | 9,591,933 | 370,243 |
| Events in quadrant B | 3,318,932 | 634,025 |
| Events in quadrant C | 4,328,918 | 549,469 |
| Events in quadrant D | 4,857,971 | 510,905 |
| Mode M9 | |||
|---|---|---|---|
| Quadrant | BADHDUFLAG | Total packets | Discarded packets |
| A | 0 | 12 | 0 |
| B | 0 | 12 | 0 |
| C | 0 | 12 | 0 |
| D | 0 | 12 | 0 |
| Mode SS | |||
|---|---|---|---|
| Quadrant | BADHDUFLAG | Total packets | Discarded packets |
| A | 0 | 122 | 0 |
| B | 0 | 122 | 0 |
| C | 0 | 122 | 0 |
| D | 0 | 122 | 0 |
| Mode M0 | |||
|---|---|---|---|
| Quadrant | BADHDUFLAG | Total packets | Discarded packets |
| A | 0 | 32597 | 1 |
| B | 0 | 13939 | 1 |
| C | 0 | 16989 | 1 |
| D | 0 | 18709 | 1 |
| Quadrant | Total seconds | Saturated seconds | Saturation percentage |
|---|---|---|---|
| A | 6025 | 2511 | 41.676349% |
| B | 6024 | 188 | 3.120850% |
| C | 6025 | 322 | 5.344398% |
| D | 6025 | 333 | 5.526971% |
Noise dominated data is calculated using 1-second bins in cleaned event files. If a bin has >2000 counts, and if more than 50% of those come from <1% of pixels, then it is considered to be noise-dominated and hence unusable.
| Quadrant | # 1 sec bins | Bins with >0 counts | Bins with >2000 counts | High rate bins dominated by noise | Noise dominated (total time) | Noise dominated (detector-on time) | Marked lightcurve |
|---|---|---|---|---|---|---|---|
| A | 7219 | 6024 | 2532 | 2532 | 35.07% | 42.03% |  |
| B | 7218 | 6024 | 119 | 119 | 1.65% | 1.98% | 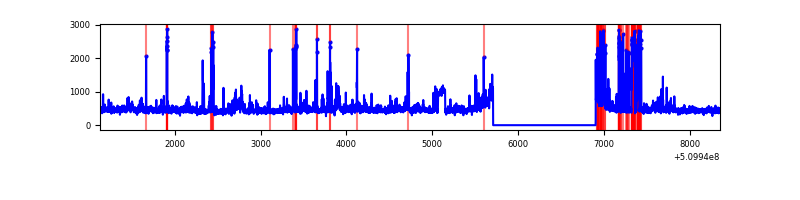 |
| C | 7219 | 6024 | 288 | 288 | 3.99% | 4.78% |  |
| D | 7219 | 6025 | 379 | 379 | 5.25% | 6.29% |  |
Top three noisy pixels from each quadrant. If the there are fewer than three noisy pixels in the level2.evt file, extra rows are filled as -1
| Pixel properties | Quadrant properties | ||||||
|---|---|---|---|---|---|---|---|
| Quadrant | DetID | PixID | Counts | Sigma | Mean | Median | Sigma |
| A | 12 | 3 | 2895234 | 22394.34 | 521 | 510 | 129.3 |
| A | 7 | 64 | 2550839 | 19730.01 | 521 | 510 | 129.3 |
| A | 4 | 95 | 1325870 | 10253.33 | 521 | 510 | 129.3 |
| B | 0 | 213 | 228049 | 1665.69 | 646 | 625 | 136.5 |
| B | 1 | 255 | 84643 | 615.36 | 646 | 625 | 136.5 |
| B | 8 | 128 | 78099 | 567.43 | 646 | 625 | 136.5 |
| C | 15 | 230 | 676350 | 3959.04 | 629 | 623 | 170.7 |
| C | 12 | 254 | 536131 | 3137.51 | 629 | 623 | 170.7 |
| C | 13 | 3 | 325110 | 1901.15 | 629 | 623 | 170.7 |
| D | 8 | 129 | 1458444 | 8265.58 | 623 | 593 | 176.4 |
| D | 14 | 52 | 509616 | 2886.01 | 623 | 593 | 176.4 |
| D | 8 | 240 | 101527 | 572.27 | 623 | 593 | 176.4 |
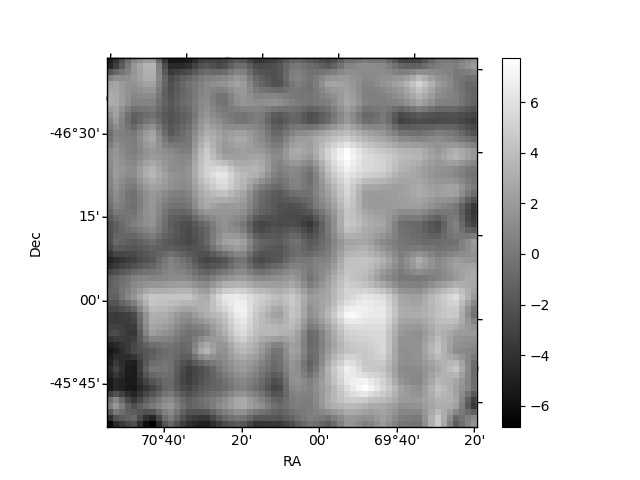
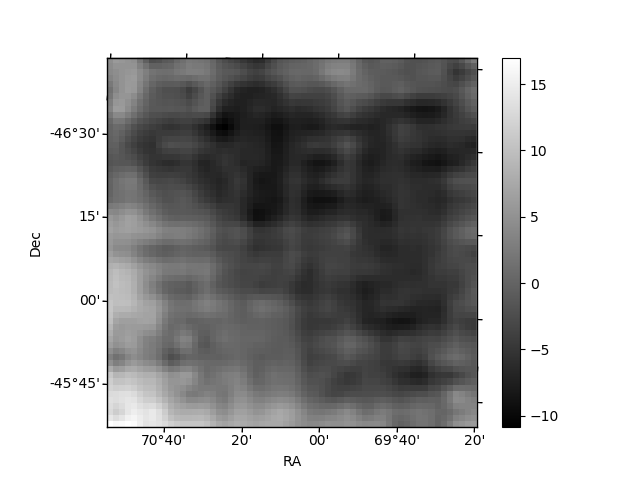
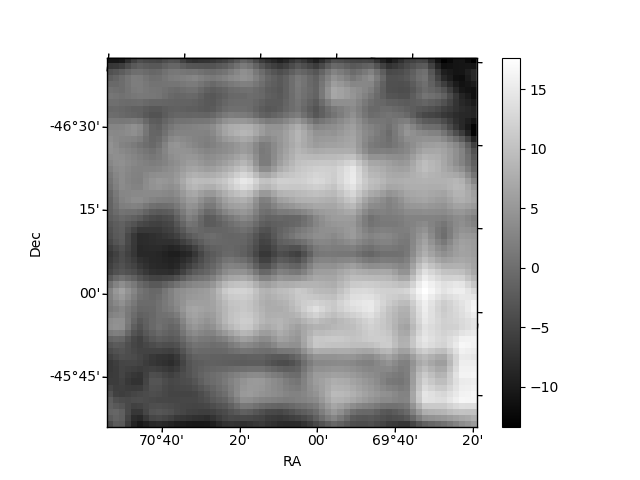
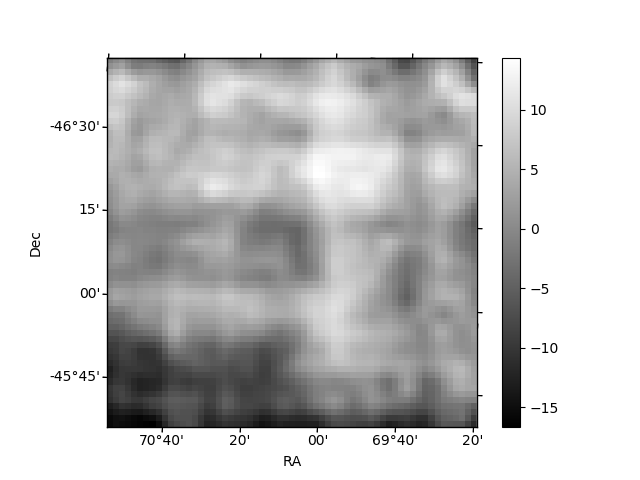
Histogram calculated using DETX and DETY for each event in the final _common_clean file
| Quadrant A | 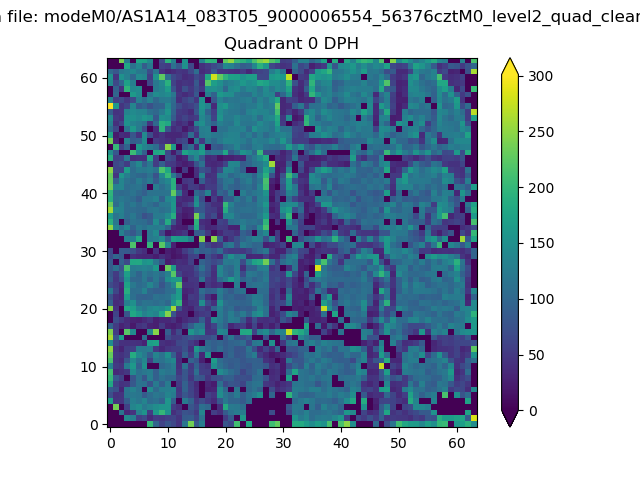 |
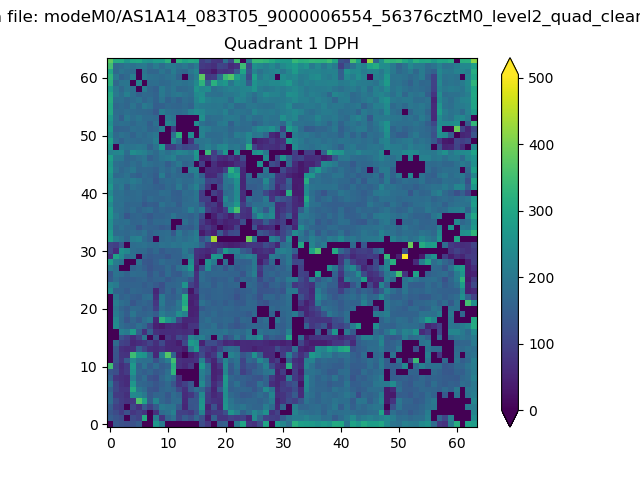 |
Quadrant B |
|---|---|---|---|
| Quadrant D | 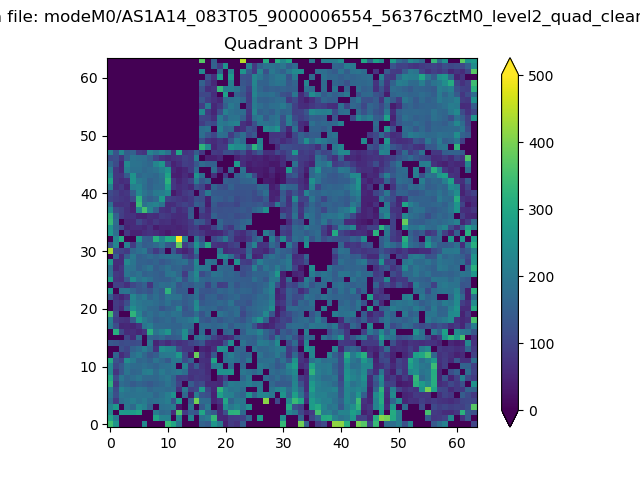 |
 |
Quadrant C |
| Plot type | Count rate plots | Images |
|---|---|---|
| Comparison with Poisson distribution Blue bars denote a histogram of data divided into 1 sec bins. Red curve is a Poisson curve with rate = median count rate of data. |
 |
 |
| Quadrant-wise count rates Data is divided into 100 sec bins |
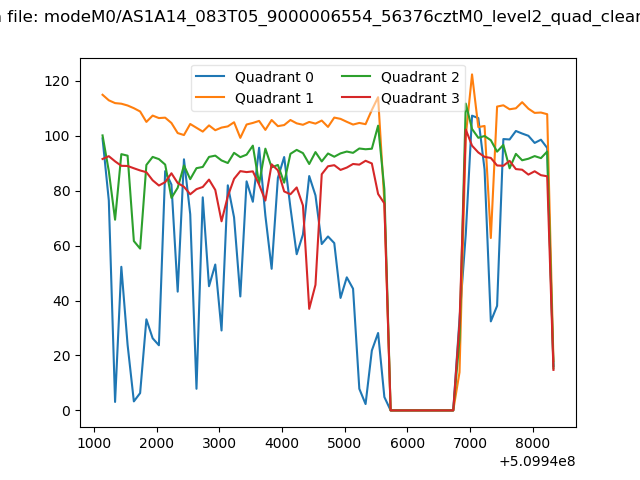 |
|
| Module-wise count rates for Quadrant A Data is divided into 100 sec bins |
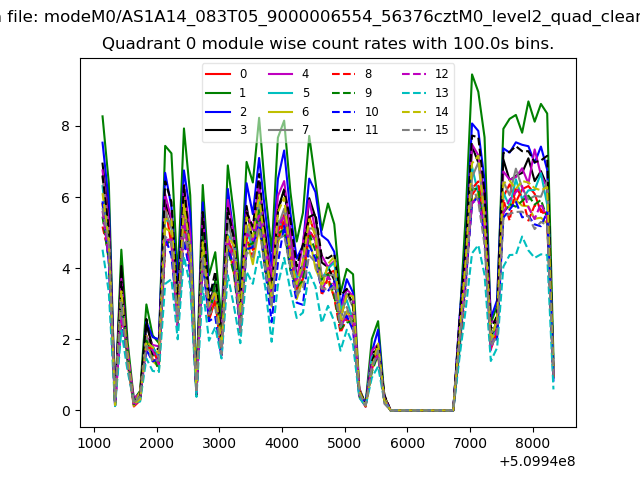 |
 |
| Module-wise count rates for Quadrant B Data is divided into 100 sec bins |
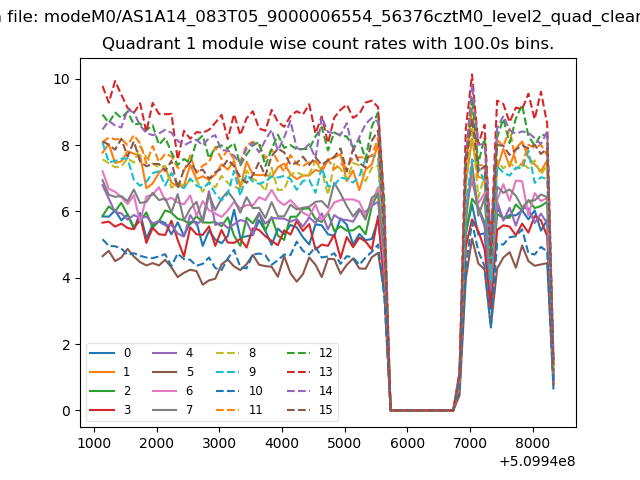 |
 |
| Module-wise count rates for Quadrant C Data is divided into 100 sec bins |
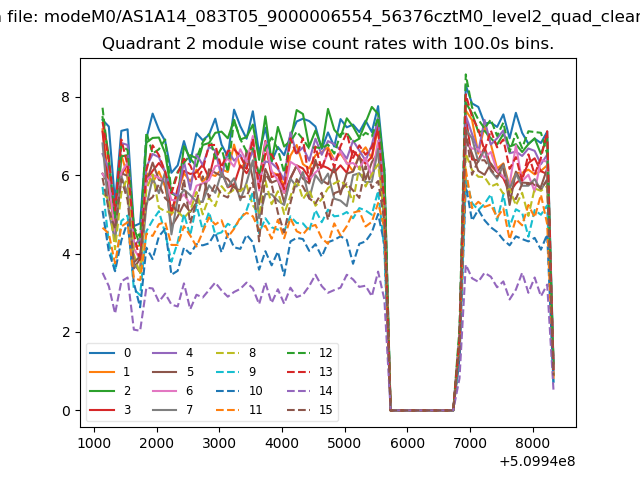 |
 |
| Module-wise count rates for Quadrant D Data is divided into 100 sec bins |
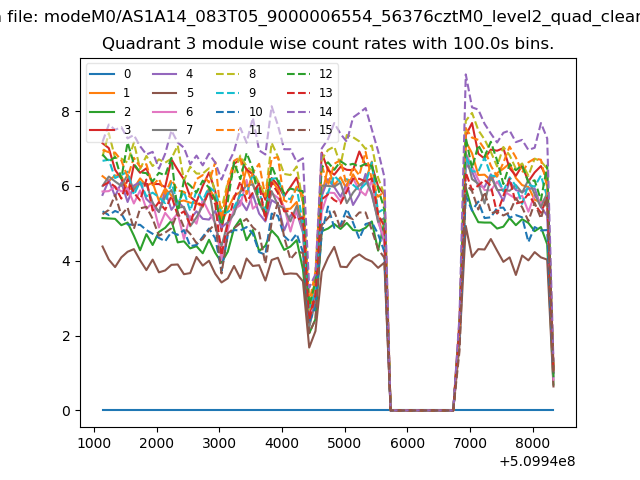 |
 |
| Parameter | Plot |
|---|---|
| CZT HV Monitor |  |
| D_VDD |  |
| Temperature 1 | 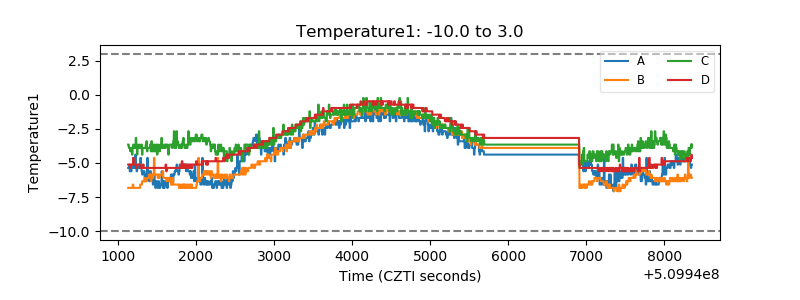 |
| Veto HV Monitor | 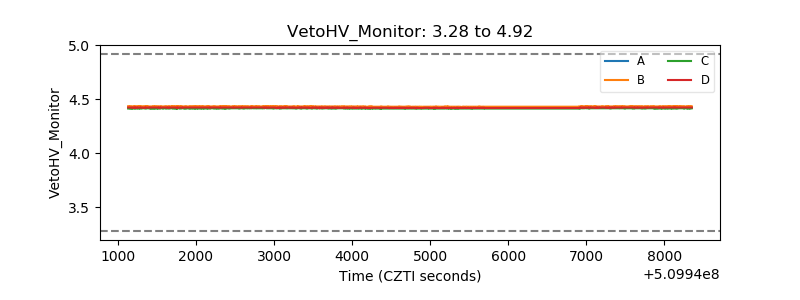 |
| Veto LLD |  |
| Alpha Counter |  |
| _CPM_Rate |  |
| CZT Counter | 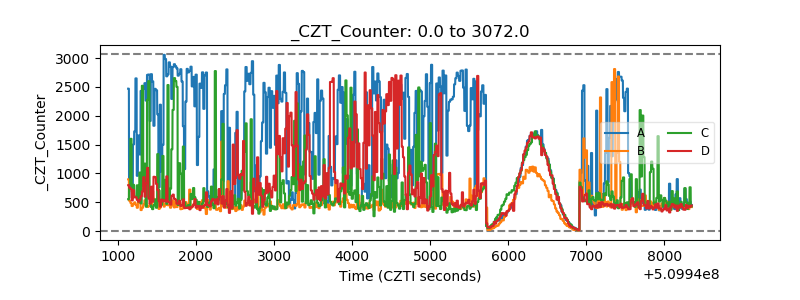 |
| +2.5 Volts monitor | 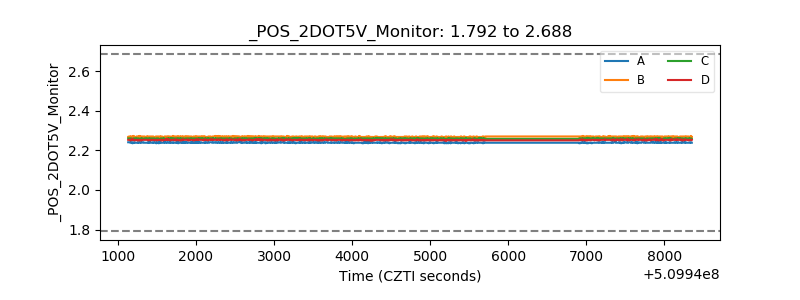 |
| +5 Volts monitor |  |
| _ROLL_ROT | 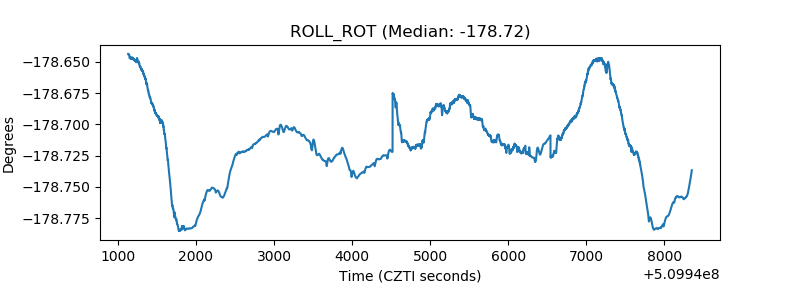 |
| _Roll_DEC | 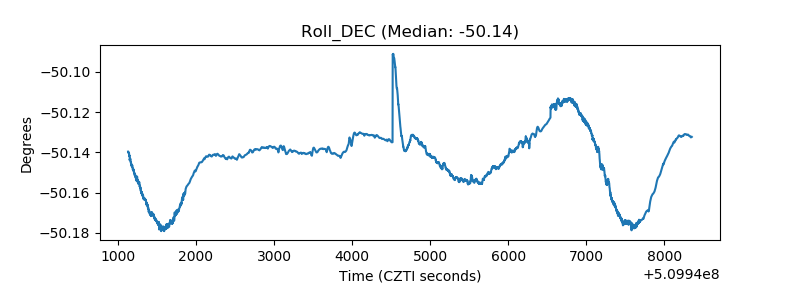 |
| _Roll_RA | 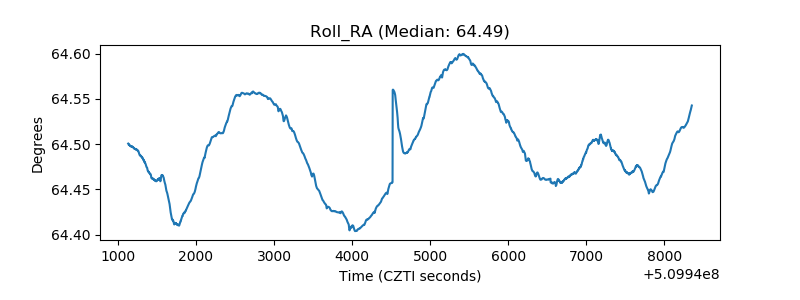 |
| Veto Counter | 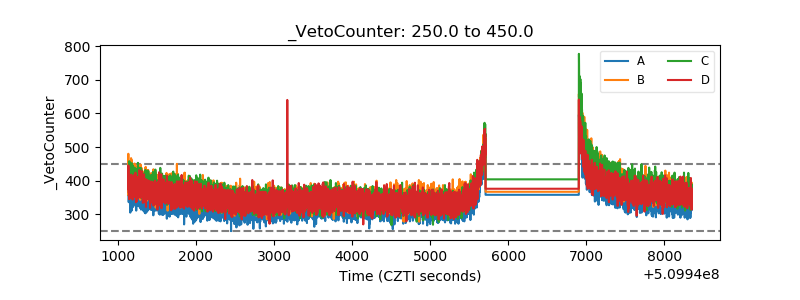 |