| Param | Original file | Final file |
|---|---|---|
| Filename | modeM0/AS1A14_083T05_9000006554_56377cztM0_level2.fits | modeM0/AS1A14_083T05_9000006554_56377cztM0_level2_quad_clean.evt |
| Size (bytes) | 569,880,000 | 92,240,640 |
| Size | 543.5 MB | 88.0 MB |
| Events in quadrant A | 7,118,923 | 520,656 |
| Events in quadrant B | 3,821,216 | 675,647 |
| Events in quadrant C | 5,586,682 | 572,458 |
| Events in quadrant D | 4,058,552 | 566,103 |
| Mode M9 | |||
|---|---|---|---|
| Quadrant | BADHDUFLAG | Total packets | Discarded packets |
| A | 0 | 22 | 0 |
| B | 0 | 22 | 0 |
| C | 0 | 22 | 0 |
| D | 0 | 22 | 0 |
| Mode SS | |||
|---|---|---|---|
| Quadrant | BADHDUFLAG | Total packets | Discarded packets |
| A | 0 | 136 | 0 |
| B | 0 | 136 | 0 |
| C | 0 | 136 | 0 |
| D | 0 | 136 | 0 |
| Mode M0 | |||
|---|---|---|---|
| Quadrant | BADHDUFLAG | Total packets | Discarded packets |
| A | 0 | 25561 | 3 |
| B | 0 | 15883 | 2 |
| C | 0 | 21137 | 2 |
| D | 0 | 16681 | 2 |
| Quadrant | Total seconds | Saturated seconds | Saturation percentage |
|---|---|---|---|
| A | 6565 | 1433 | 21.827875% |
| B | 6566 | 401 | 6.107219% |
| C | 6566 | 718 | 10.935120% |
| D | 6566 | 219 | 3.335364% |
Noise dominated data is calculated using 1-second bins in cleaned event files. If a bin has >2000 counts, and if more than 50% of those come from <1% of pixels, then it is considered to be noise-dominated and hence unusable.
| Quadrant | # 1 sec bins | Bins with >0 counts | Bins with >2000 counts | High rate bins dominated by noise | Noise dominated (total time) | Noise dominated (detector-on time) | Marked lightcurve |
|---|---|---|---|---|---|---|---|
| A | 8824 | 6565 | 1342 | 1342 | 15.21% | 20.44% |  |
| B | 8825 | 6567 | 202 | 202 | 2.29% | 3.08% |  |
| C | 8825 | 6566 | 591 | 591 | 6.70% | 9.00% |  |
| D | 8825 | 6567 | 131 | 131 | 1.48% | 1.99% | 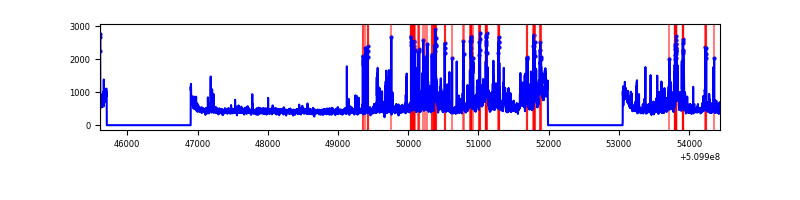 |
Top three noisy pixels from each quadrant. If the there are fewer than three noisy pixels in the level2.evt file, extra rows are filled as -1
| Pixel properties | Quadrant properties | ||||||
|---|---|---|---|---|---|---|---|
| Quadrant | DetID | PixID | Counts | Sigma | Mean | Median | Sigma |
| A | 12 | 3 | 1656065 | 10037.11 | 665 | 647 | 164.9 |
| A | 3 | 14 | 1209760 | 7331.08 | 665 | 647 | 164.9 |
| A | 4 | 95 | 694560 | 4207.33 | 665 | 647 | 164.9 |
| B | 0 | 213 | 501432 | 3280.78 | 721 | 694 | 152.6 |
| B | 4 | 171 | 111021 | 722.85 | 721 | 694 | 152.6 |
| B | 1 | 255 | 100626 | 654.74 | 721 | 694 | 152.6 |
| C | 12 | 254 | 941435 | 5015.4 | 691 | 685 | 187.6 |
| C | 13 | 3 | 782007 | 4165.45 | 691 | 685 | 187.6 |
| C | 15 | 230 | 474751 | 2527.38 | 691 | 685 | 187.6 |
| D | 8 | 129 | 594038 | 2984.34 | 712 | 680 | 198.8 |
| D | 2 | 249 | 309725 | 1554.36 | 712 | 680 | 198.8 |
| D | 7 | 96 | 80837 | 403.16 | 712 | 680 | 198.8 |
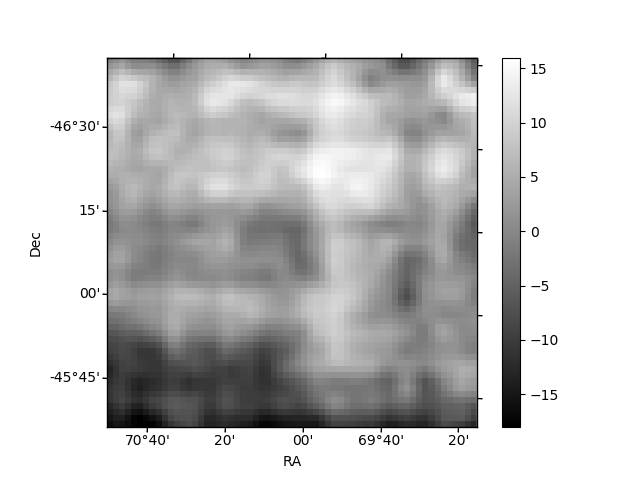
Histogram calculated using DETX and DETY for each event in the final _common_clean file
| Quadrant A |  |
 |
Quadrant B |
|---|---|---|---|
| Quadrant D | 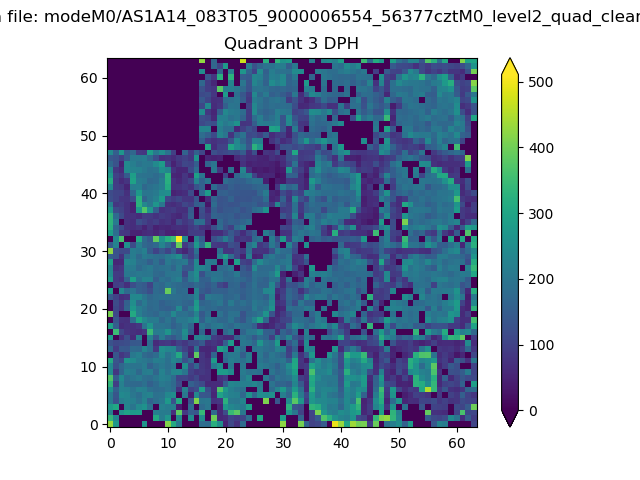 |
 |
Quadrant C |
| Plot type | Count rate plots | Images |
|---|---|---|
| Comparison with Poisson distribution Blue bars denote a histogram of data divided into 1 sec bins. Red curve is a Poisson curve with rate = median count rate of data. |
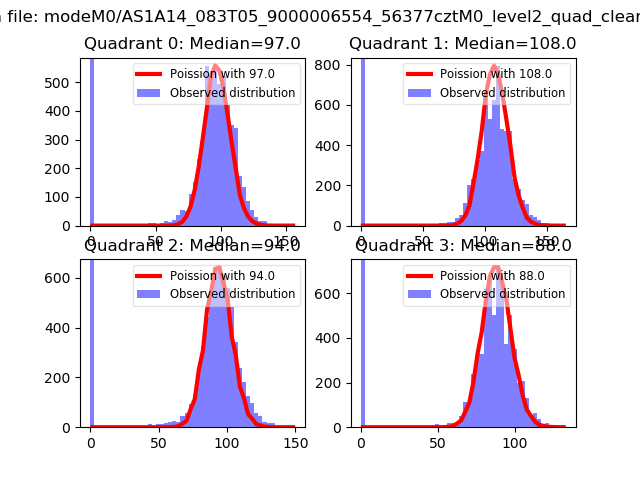 |
 |
| Quadrant-wise count rates Data is divided into 100 sec bins |
 |
|
| Module-wise count rates for Quadrant A Data is divided into 100 sec bins |
 |
 |
| Module-wise count rates for Quadrant B Data is divided into 100 sec bins |
 |
 |
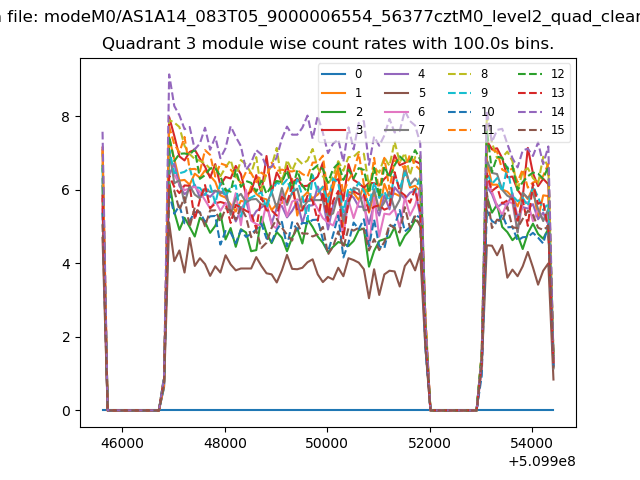
| Module-wise count rates for Quadrant C Data is divided into 100 sec bins |
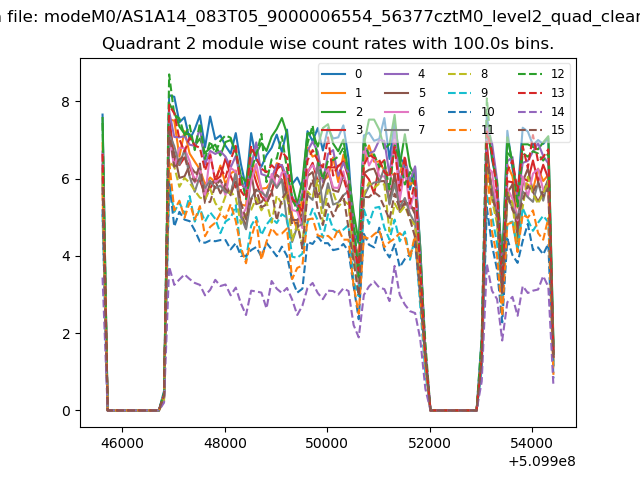 |
 |
| Module-wise count rates for Quadrant D Data is divided into 100 sec bins |
 |
 |
| Parameter | Plot |
|---|---|
| CZT HV Monitor | 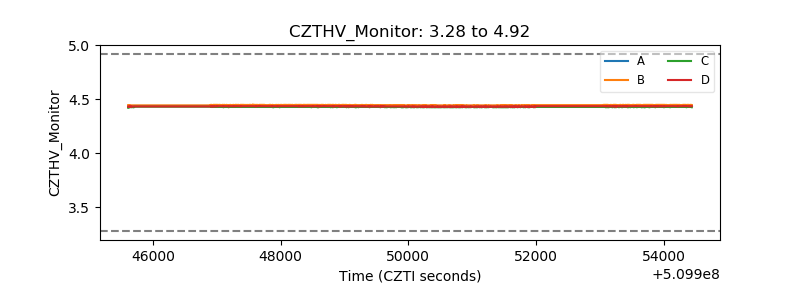 |
| D_VDD |  |
| Temperature 1 | 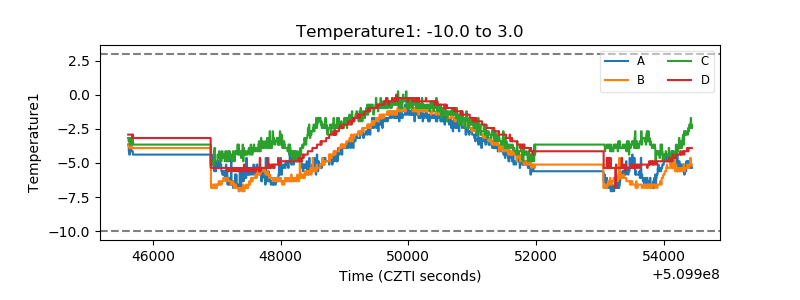 |
| Veto HV Monitor | 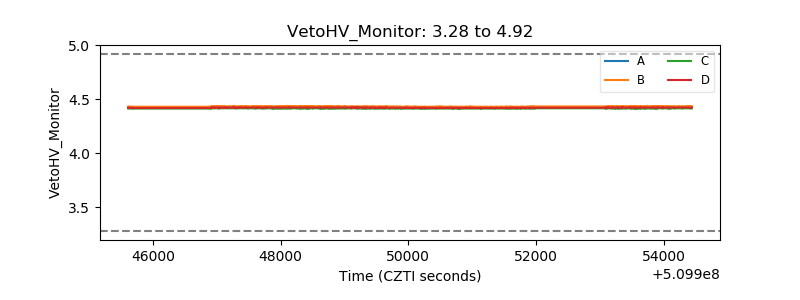 |
| Veto LLD |  |
| Alpha Counter | 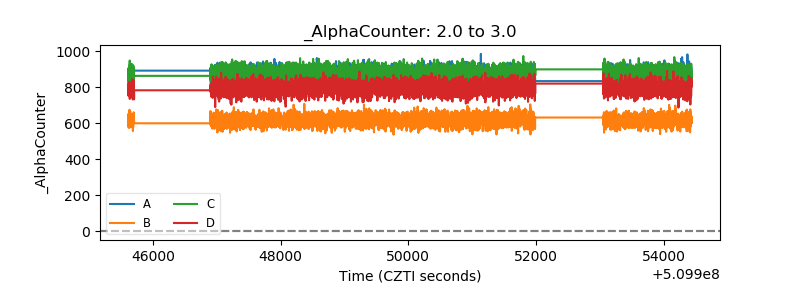 |
| _CPM_Rate | 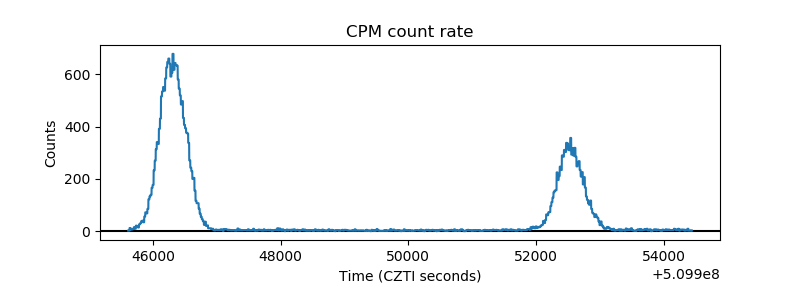 |
| CZT Counter | 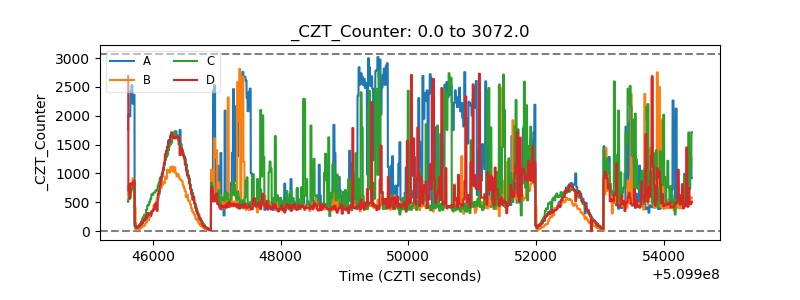 |
| +2.5 Volts monitor | 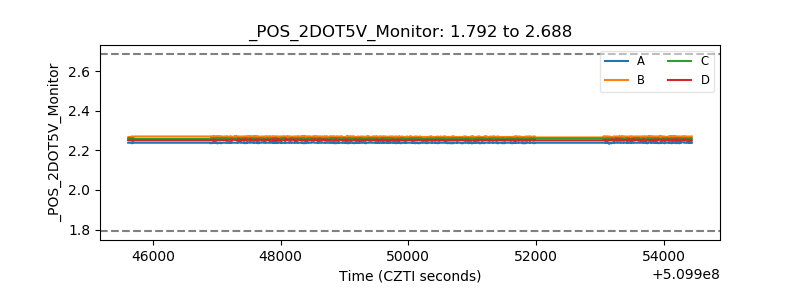 |
| +5 Volts monitor | 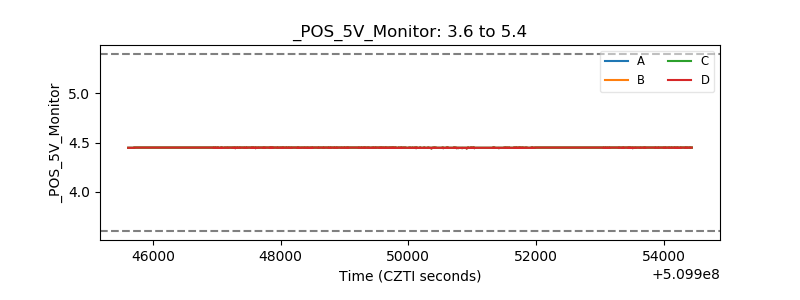 |
| _ROLL_ROT | 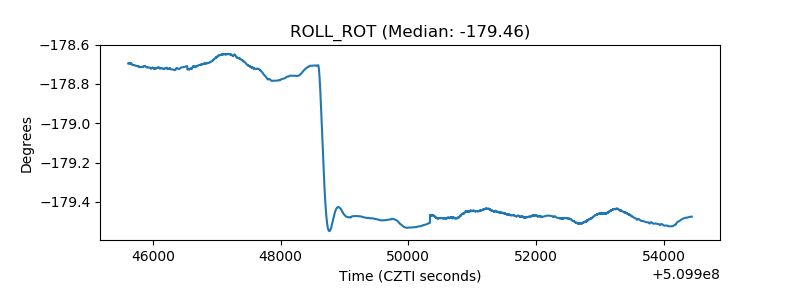 |
| _Roll_DEC | 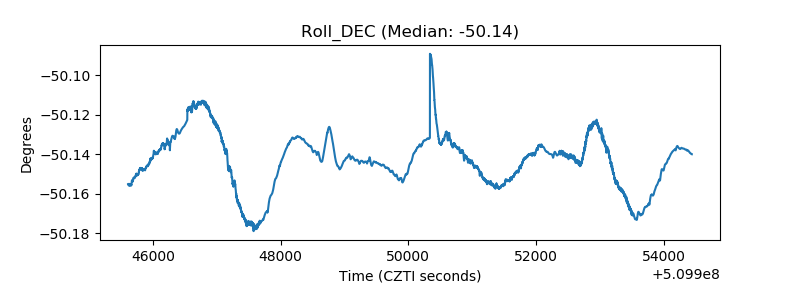 |
| _Roll_RA |  |
| Veto Counter | 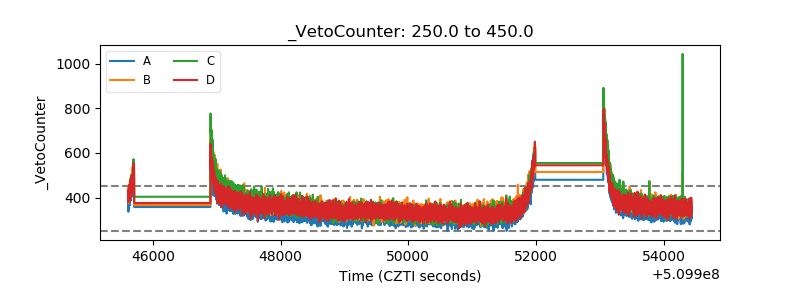 |