| Param | Original file | Final file |
|---|---|---|
| Filename | modeM0/AS1A14_083T05_9000006554_56378cztM0_level2.fits | modeM0/AS1A14_083T05_9000006554_56378cztM0_level2_quad_clean.evt |
| Size (bytes) | 636,324,480 | 90,446,400 |
| Size | 606.8 MB | 86.3 MB |
| Events in quadrant A | 6,776,710 | 564,725 |
| Events in quadrant B | 4,835,781 | 645,680 |
| Events in quadrant C | 6,759,609 | 500,743 |
| Events in quadrant D | 4,656,684 | 554,799 |
| Mode M9 | |||
|---|---|---|---|
| Quadrant | BADHDUFLAG | Total packets | Discarded packets |
| A | 0 | 9 | 0 |
| B | 0 | 9 | 0 |
| C | 0 | 9 | 0 |
| D | 0 | 9 | 0 |
| Mode SS | |||
|---|---|---|---|
| Quadrant | BADHDUFLAG | Total packets | Discarded packets |
| A | 0 | 138 | 0 |
| B | 0 | 138 | 0 |
| C | 0 | 138 | 0 |
| D | 0 | 138 | 0 |
| Mode M0 | |||
|---|---|---|---|
| Quadrant | BADHDUFLAG | Total packets | Discarded packets |
| A | 0 | 24788 | 1 |
| B | 0 | 18908 | 1 |
| C | 0 | 25002 | 1 |
| D | 0 | 18445 | 2 |
| Quadrant | Total seconds | Saturated seconds | Saturation percentage |
|---|---|---|---|
| A | 6778 | 1025 | 15.122455% |
| B | 6779 | 691 | 10.193244% |
| C | 6779 | 1483 | 21.876383% |
| D | 6778 | 369 | 5.444084% |
Noise dominated data is calculated using 1-second bins in cleaned event files. If a bin has >2000 counts, and if more than 50% of those come from <1% of pixels, then it is considered to be noise-dominated and hence unusable.
| Quadrant | # 1 sec bins | Bins with >0 counts | Bins with >2000 counts | High rate bins dominated by noise | Noise dominated (total time) | Noise dominated (detector-on time) | Marked lightcurve |
|---|---|---|---|---|---|---|---|
| A | 7623 | 6779 | 873 | 873 | 11.45% | 12.88% |  |
| B | 7624 | 6780 | 466 | 466 | 6.11% | 6.87% |  |
| C | 7624 | 6780 | 1262 | 1262 | 16.55% | 18.61% |  |
| D | 7623 | 6779 | 193 | 193 | 2.53% | 2.85% |  |
Top three noisy pixels from each quadrant. If the there are fewer than three noisy pixels in the level2.evt file, extra rows are filled as -1
| Pixel properties | Quadrant properties | ||||||
|---|---|---|---|---|---|---|---|
| Quadrant | DetID | PixID | Counts | Sigma | Mean | Median | Sigma |
| A | 4 | 95 | 2608463 | 14859.37 | 705 | 688 | 175.5 |
| A | 12 | 3 | 550540 | 3133.11 | 705 | 688 | 175.5 |
| A | 0 | 8 | 185798 | 1054.78 | 705 | 688 | 175.5 |
| B | 0 | 213 | 1113145 | 7284.52 | 720 | 692 | 152.7 |
| B | 1 | 223 | 128064 | 834.05 | 720 | 692 | 152.7 |
| B | 4 | 21 | 127990 | 833.56 | 720 | 692 | 152.7 |
| C | 15 | 230 | 3153851 | 18583.39 | 622 | 617 | 169.7 |
| C | 12 | 252 | 365514 | 2150.5 | 622 | 617 | 169.7 |
| C | 12 | 254 | 306425 | 1802.26 | 622 | 617 | 169.7 |
| D | 8 | 129 | 557855 | 2771.34 | 713 | 681 | 201.0 |
| D | 5 | 113 | 361509 | 1794.73 | 713 | 681 | 201.0 |
| D | 8 | 240 | 305787 | 1517.58 | 713 | 681 | 201.0 |
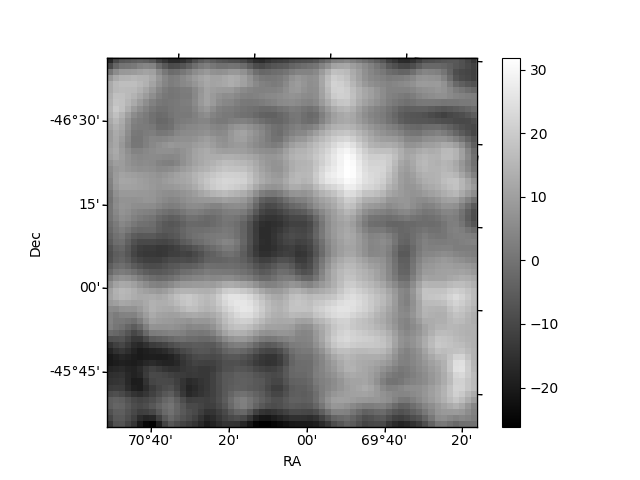
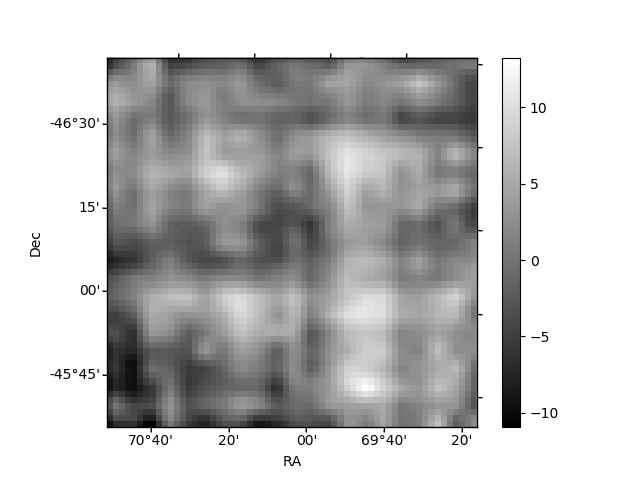
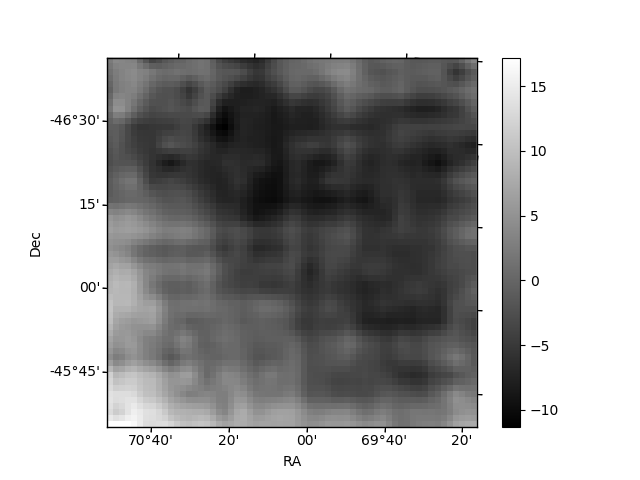
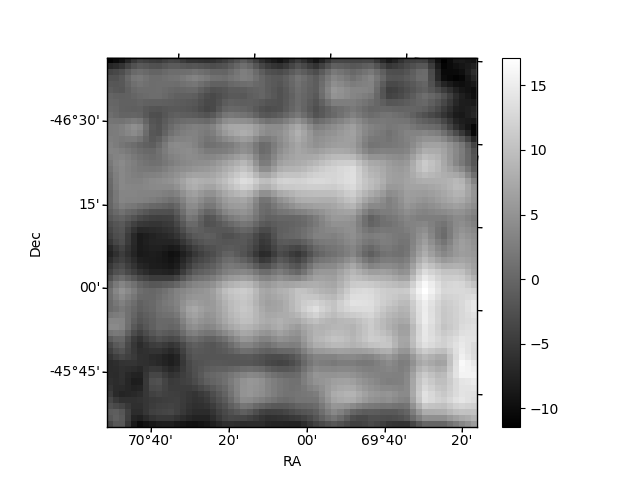
Histogram calculated using DETX and DETY for each event in the final _common_clean file
| Quadrant A | 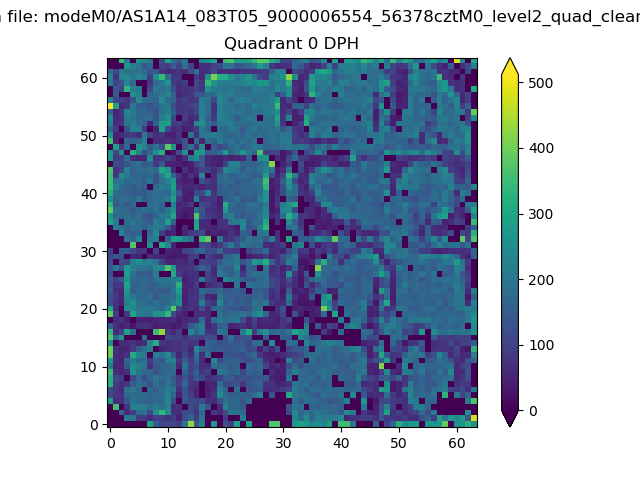 |
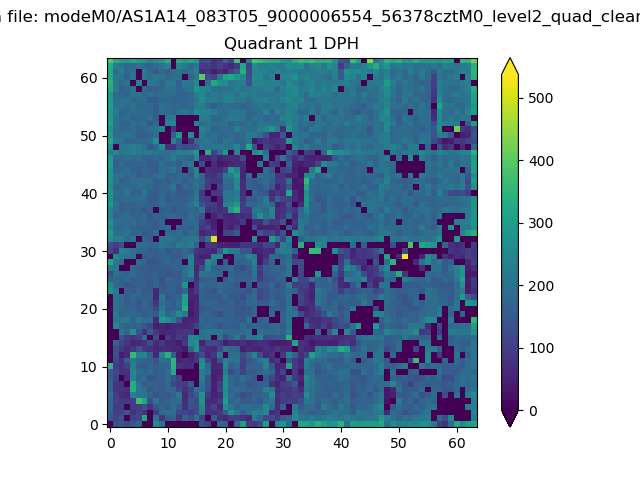 |
Quadrant B |
|---|---|---|---|
| Quadrant D |  |
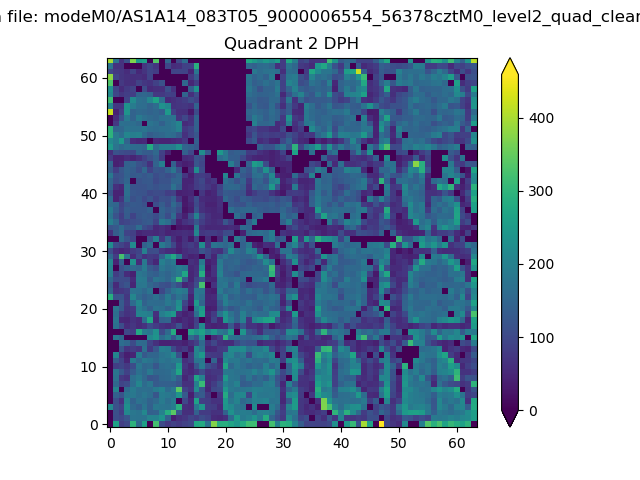 |
Quadrant C |
| Plot type | Count rate plots | Images |
|---|---|---|
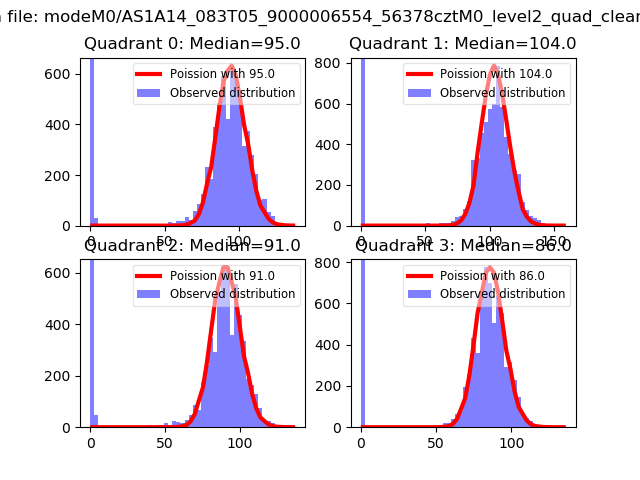
| Comparison with Poisson distribution Blue bars denote a histogram of data divided into 1 sec bins. Red curve is a Poisson curve with rate = median count rate of data. |
 |
 |
| Quadrant-wise count rates Data is divided into 100 sec bins |
 |
|
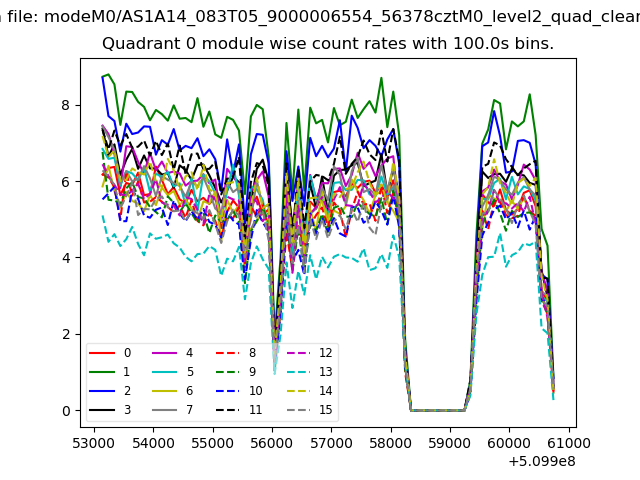
| Module-wise count rates for Quadrant A Data is divided into 100 sec bins |
 |
 |
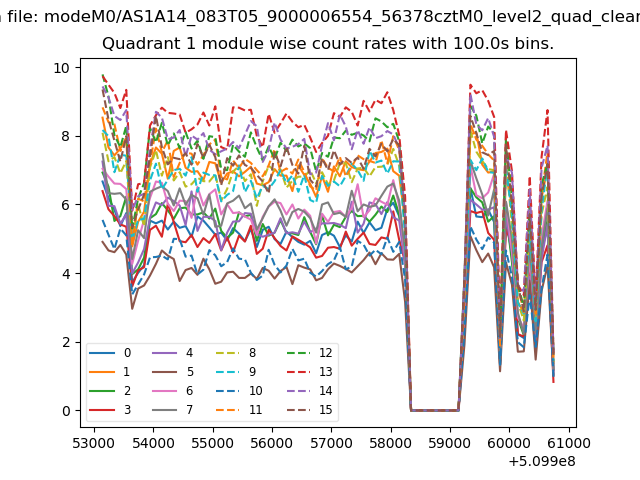
| Module-wise count rates for Quadrant B Data is divided into 100 sec bins |
 |
 |
| Module-wise count rates for Quadrant C Data is divided into 100 sec bins |
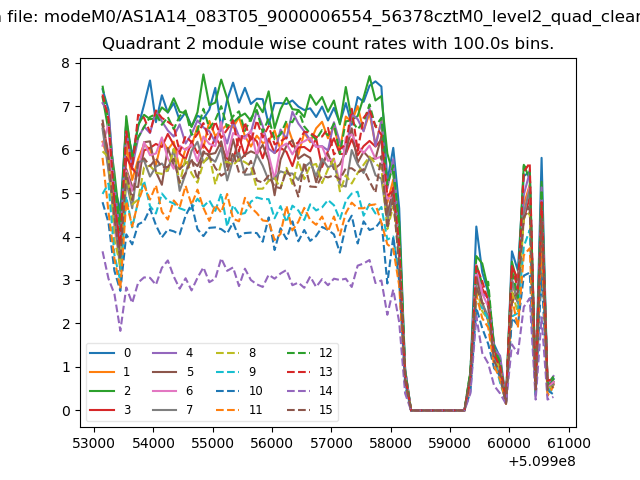 |
 |
| Module-wise count rates for Quadrant D Data is divided into 100 sec bins |
 |
 |
| Parameter | Plot |
|---|---|
| CZT HV Monitor | 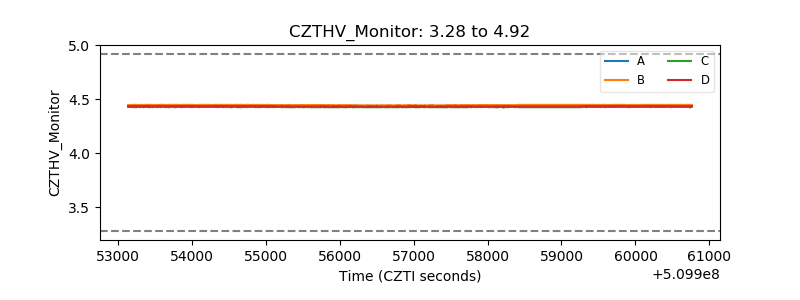 |
| D_VDD |  |
| Temperature 1 | 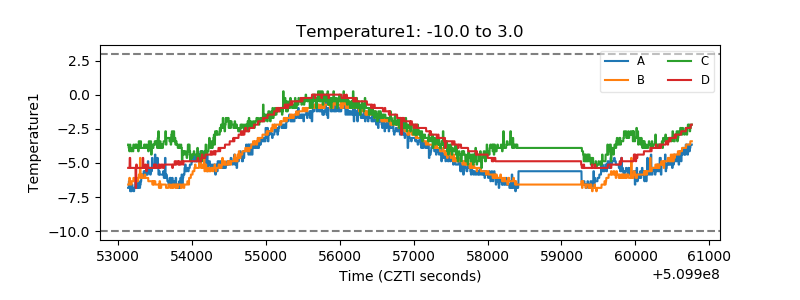 |
| Veto HV Monitor |  |
| Veto LLD |  |
| Alpha Counter |  |
| _CPM_Rate | 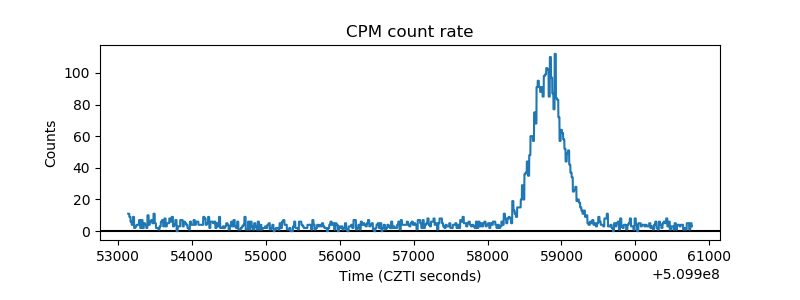 |
| CZT Counter | 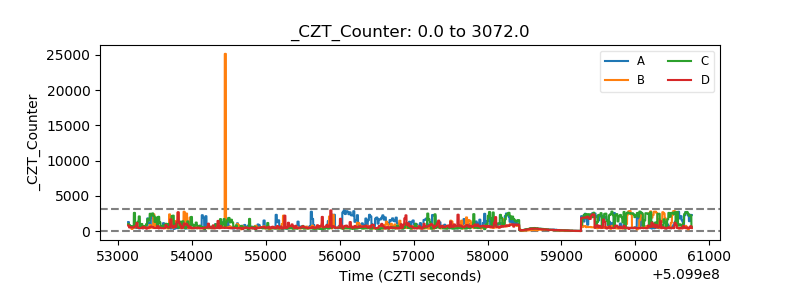 |
| +2.5 Volts monitor |  |
| +5 Volts monitor | 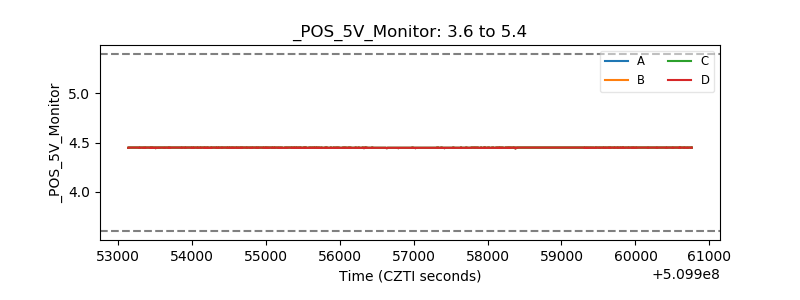 |
| _ROLL_ROT |  |
| _Roll_DEC |  |
| _Roll_RA |  |
| Veto Counter |  |