| Param | Original file | Final file |
|---|---|---|
| Filename | modeM0/AS1A14_083T05_9000006554_56379cztM0_level2.fits | modeM0/AS1A14_083T05_9000006554_56379cztM0_level2_quad_clean.evt |
| Size (bytes) | 718,410,240 | 85,406,400 |
| Size | 685.1 MB | 81.4 MB |
| Events in quadrant A | 8,879,491 | 462,962 |
| Events in quadrant B | 4,645,954 | 633,389 |
| Events in quadrant C | 8,153,387 | 457,691 |
| Events in quadrant D | 4,390,277 | 560,760 |
| Mode M9 | |||
|---|---|---|---|
| Quadrant | BADHDUFLAG | Total packets | Discarded packets |
| A | 0 | 5 | 0 |
| B | 0 | 5 | 0 |
| C | 0 | 5 | 0 |
| D | 0 | 5 | 0 |
| Mode SS | |||
|---|---|---|---|
| Quadrant | BADHDUFLAG | Total packets | Discarded packets |
| A | 0 | 136 | 0 |
| B | 0 | 136 | 0 |
| C | 0 | 136 | 0 |
| D | 0 | 136 | 0 |
| Mode M0 | |||
|---|---|---|---|
| Quadrant | BADHDUFLAG | Total packets | Discarded packets |
| A | 0 | 30987 | 1 |
| B | 0 | 18462 | 1 |
| C | 0 | 28987 | 1 |
| D | 0 | 17625 | 1 |
| Quadrant | Total seconds | Saturated seconds | Saturation percentage |
|---|---|---|---|
| A | 6759 | 2038 | 30.152389% |
| B | 6760 | 672 | 9.940828% |
| C | 6760 | 1969 | 29.127219% |
| D | 6760 | 242 | 3.579882% |
Noise dominated data is calculated using 1-second bins in cleaned event files. If a bin has >2000 counts, and if more than 50% of those come from <1% of pixels, then it is considered to be noise-dominated and hence unusable.
| Quadrant | # 1 sec bins | Bins with >0 counts | Bins with >2000 counts | High rate bins dominated by noise | Noise dominated (total time) | Noise dominated (detector-on time) | Marked lightcurve |
|---|---|---|---|---|---|---|---|
| A | 7234 | 6761 | 1796 | 1796 | 24.83% | 26.56% |  |
| B | 7235 | 6762 | 440 | 440 | 6.08% | 6.51% | 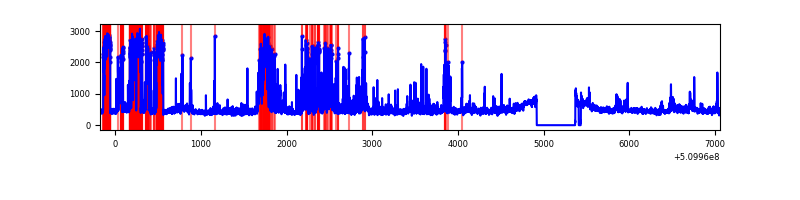 |
| C | 7235 | 6762 | 1721 | 1721 | 23.79% | 25.45% |  |
| D | 7235 | 6762 | 129 | 129 | 1.78% | 1.91% |  |
Top three noisy pixels from each quadrant. If the there are fewer than three noisy pixels in the level2.evt file, extra rows are filled as -1
| Pixel properties | Quadrant properties | ||||||
|---|---|---|---|---|---|---|---|
| Quadrant | DetID | PixID | Counts | Sigma | Mean | Median | Sigma |
| A | 4 | 95 | 3721436 | 22915.83 | 651 | 633 | 162.4 |
| A | 12 | 3 | 1544336 | 9507.42 | 651 | 633 | 162.4 |
| A | 3 | 14 | 476545 | 2931.07 | 651 | 633 | 162.4 |
| B | 0 | 213 | 898955 | 6025.01 | 705 | 677 | 149.1 |
| B | 1 | 223 | 387714 | 2595.97 | 705 | 677 | 149.1 |
| B | 5 | 185 | 223423 | 1494.02 | 705 | 677 | 149.1 |
| C | 15 | 230 | 4188141 | 25336.56 | 605 | 600 | 165.3 |
| C | 5 | 250 | 708197 | 4281.29 | 605 | 600 | 165.3 |
| C | 6 | 223 | 273900 | 1653.59 | 605 | 600 | 165.3 |
| D | 8 | 129 | 717949 | 3589.35 | 712 | 681 | 199.8 |
| D | 2 | 31 | 235783 | 1176.5 | 712 | 681 | 199.8 |
| D | 2 | 249 | 150908 | 751.77 | 712 | 681 | 199.8 |
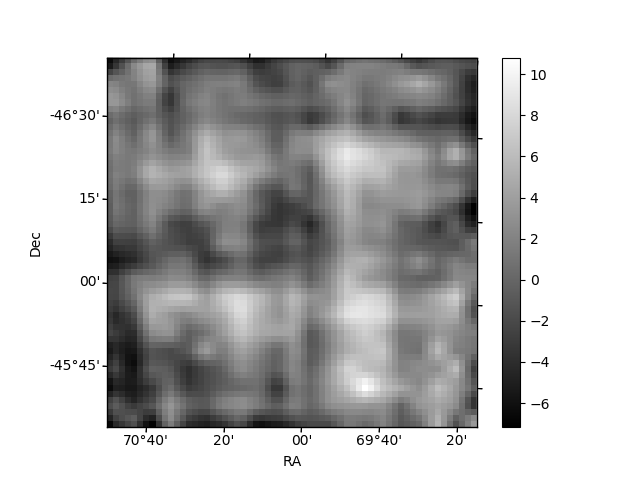
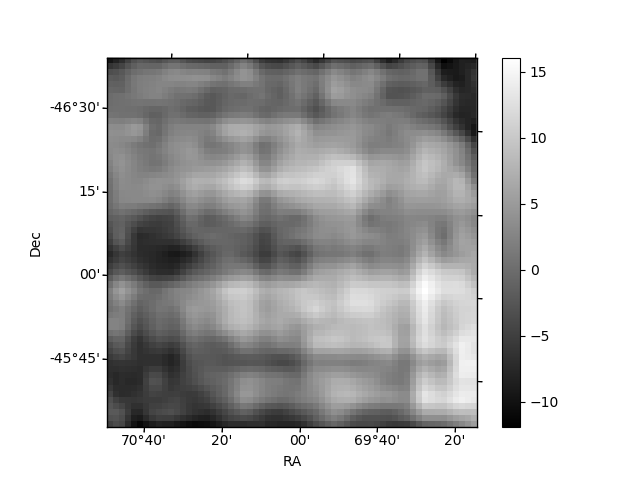
Histogram calculated using DETX and DETY for each event in the final _common_clean file
| Quadrant A | 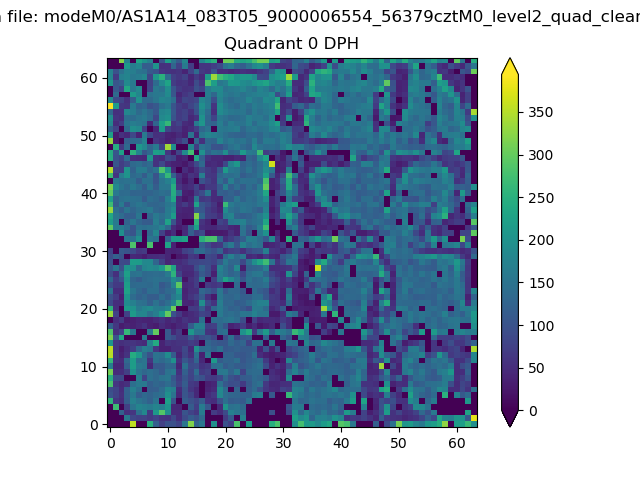 |
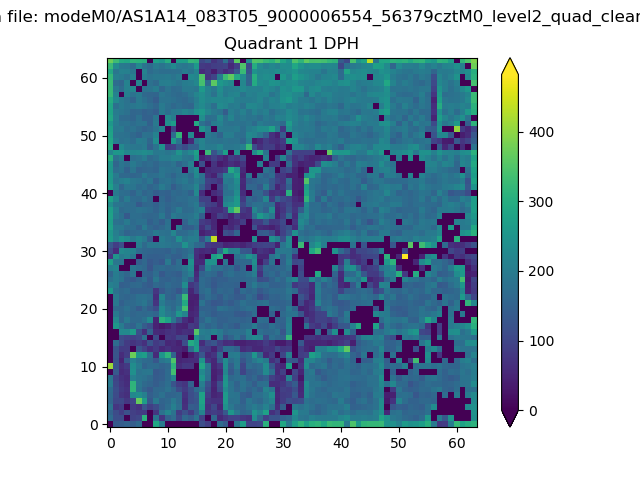 |
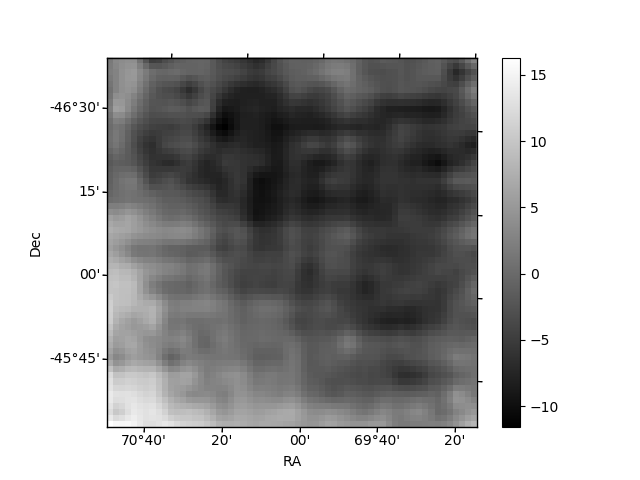
Quadrant B |
|---|---|---|---|
| Quadrant D | 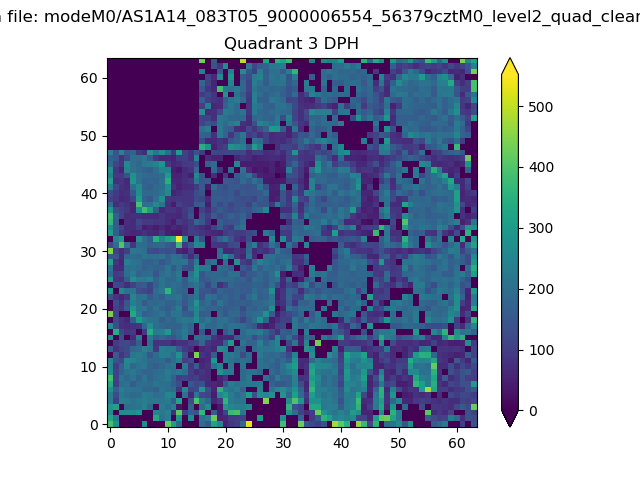 |
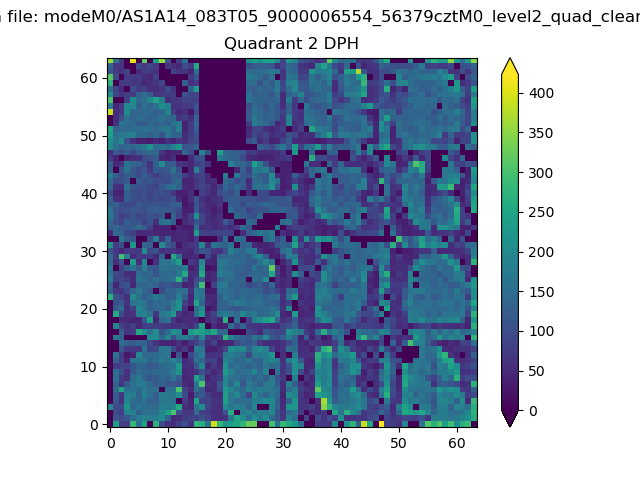 |
Quadrant C |
| Plot type | Count rate plots | Images |
|---|---|---|
| Comparison with Poisson distribution Blue bars denote a histogram of data divided into 1 sec bins. Red curve is a Poisson curve with rate = median count rate of data. |
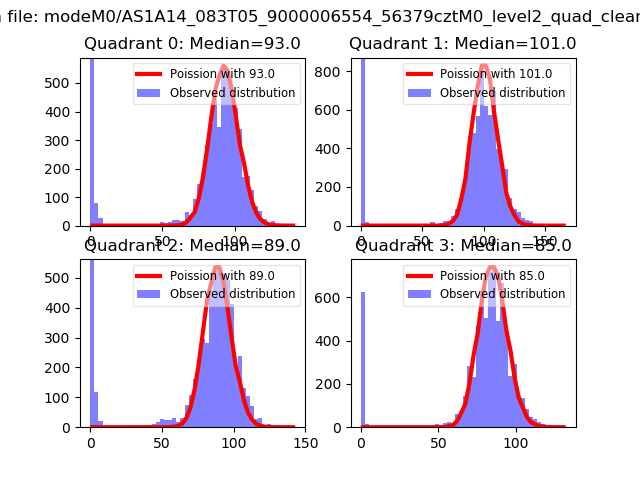 |
 |
| Quadrant-wise count rates Data is divided into 100 sec bins |
 |
|
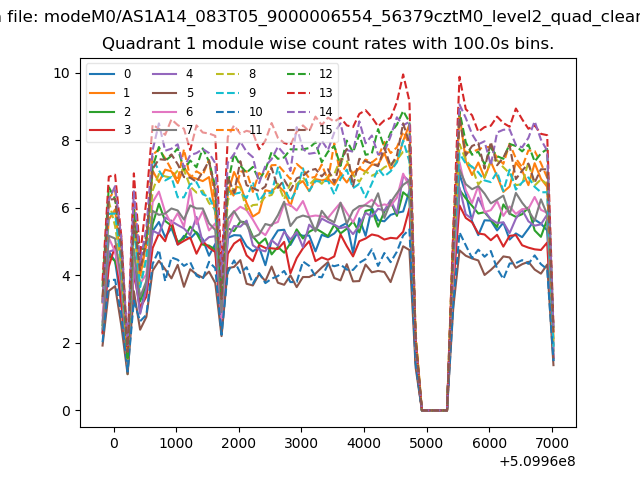
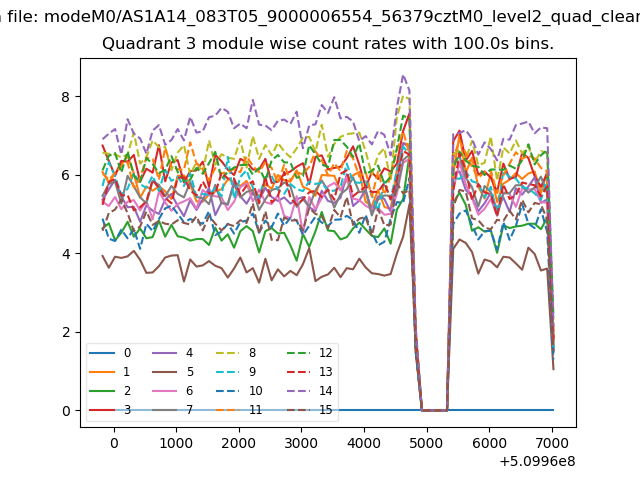
| Module-wise count rates for Quadrant A Data is divided into 100 sec bins |
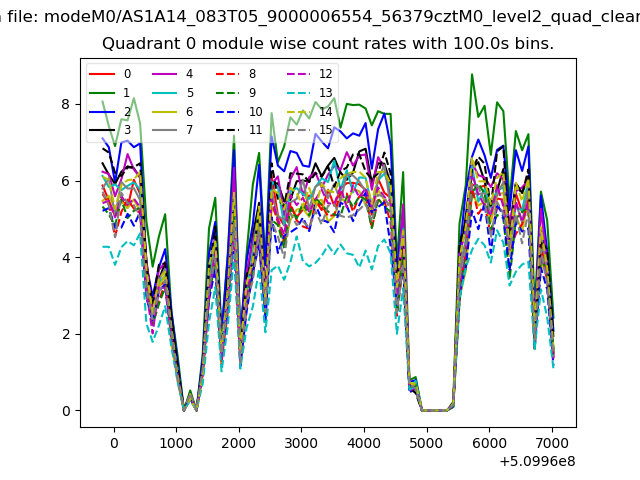 |
 |
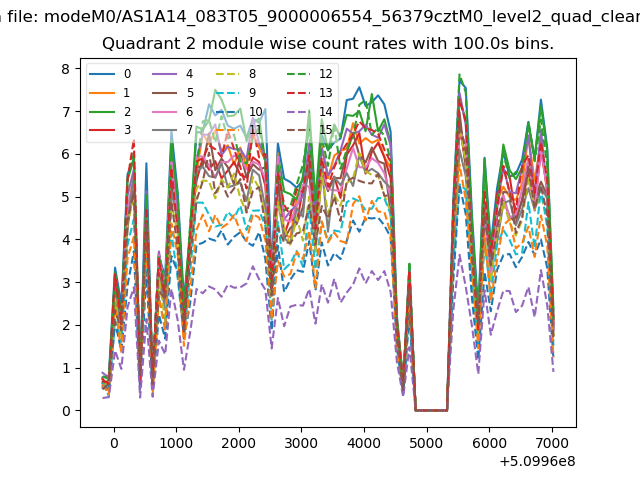
| Module-wise count rates for Quadrant B Data is divided into 100 sec bins |
 |
 |
| Module-wise count rates for Quadrant C Data is divided into 100 sec bins |
 |
 |
| Module-wise count rates for Quadrant D Data is divided into 100 sec bins |
 |
 |
| Parameter | Plot |
|---|---|
| CZT HV Monitor |  |
| D_VDD |  |
| Temperature 1 | 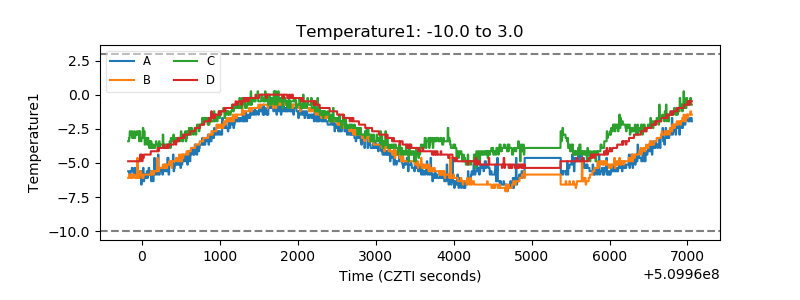 |
| Veto HV Monitor |  |
| Veto LLD |  |
| Alpha Counter | 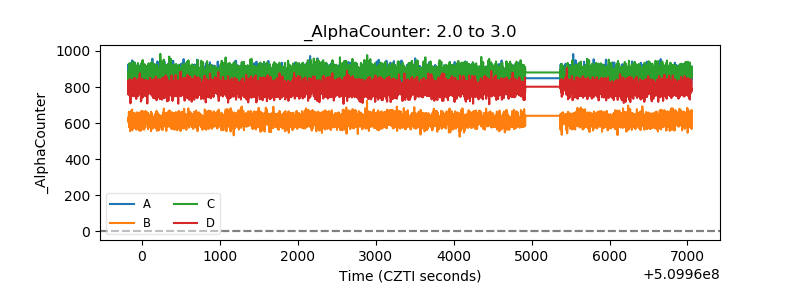 |
| _CPM_Rate | 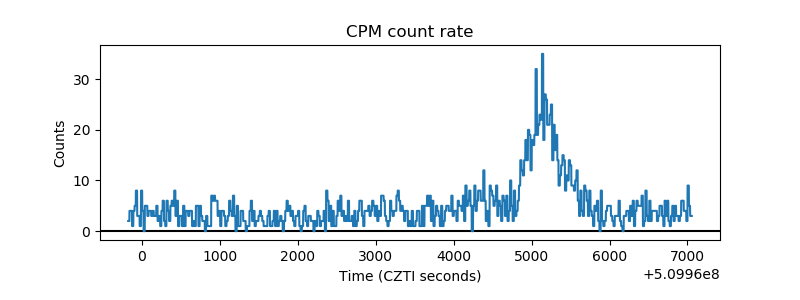 |
| CZT Counter | 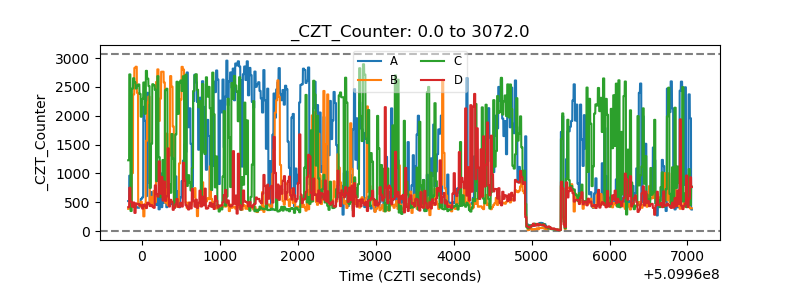 |
| +2.5 Volts monitor | 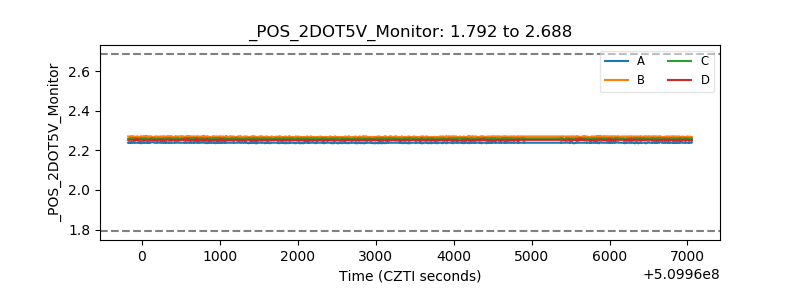 |
| +5 Volts monitor | 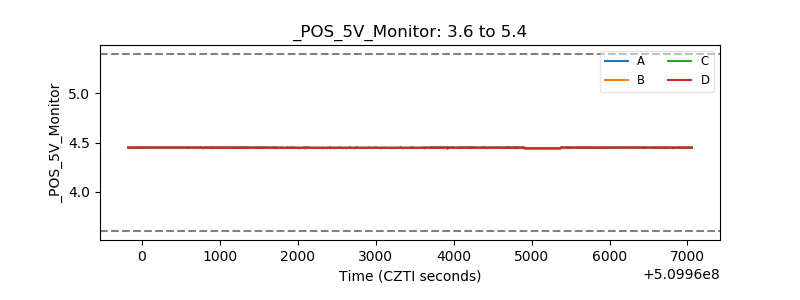 |
| _ROLL_ROT |  |
| _Roll_DEC |  |
| _Roll_RA |  |
| Veto Counter |  |