| Param | Original file | Final file |
|---|---|---|
| Filename | modeM0/AS1A14_083T05_9000006554_56380cztM0_level2.fits | modeM0/AS1A14_083T05_9000006554_56380cztM0_level2_quad_clean.evt |
| Size (bytes) | 864,653,760 | 88,237,440 |
| Size | 824.6 MB | 84.1 MB |
| Events in quadrant A | 12,375,484 | 343,657 |
| Events in quadrant B | 4,220,856 | 737,553 |
| Events in quadrant C | 5,867,579 | 615,510 |
| Events in quadrant D | 8,974,452 | 464,138 |
| Mode SS | |||
|---|---|---|---|
| Quadrant | BADHDUFLAG | Total packets | Discarded packets |
| A | 0 | 146 | 0 |
| B | 0 | 146 | 0 |
| C | 0 | 146 | 0 |
| D | 0 | 146 | 0 |
| Mode M0 | |||
|---|---|---|---|
| Quadrant | BADHDUFLAG | Total packets | Discarded packets |
| A | 0 | 41719 | 4 |
| B | 0 | 17616 | 0 |
| C | 0 | 22684 | 0 |
| D | 0 | 31675 | 0 |
| Quadrant | Total seconds | Saturated seconds | Saturation percentage |
|---|---|---|---|
| A | 7336 | 3757 | 51.213195% |
| B | 7336 | 252 | 3.435115% |
| C | 7336 | 730 | 9.950927% |
| D | 7337 | 2012 | 27.422652% |
Noise dominated data is calculated using 1-second bins in cleaned event files. If a bin has >2000 counts, and if more than 50% of those come from <1% of pixels, then it is considered to be noise-dominated and hence unusable.
| Quadrant | # 1 sec bins | Bins with >0 counts | Bins with >2000 counts | High rate bins dominated by noise | Noise dominated (total time) | Noise dominated (detector-on time) | Marked lightcurve |
|---|---|---|---|---|---|---|---|
| A | 7336 | 7336 | 3727 | 3727 | 50.80% | 50.80% | 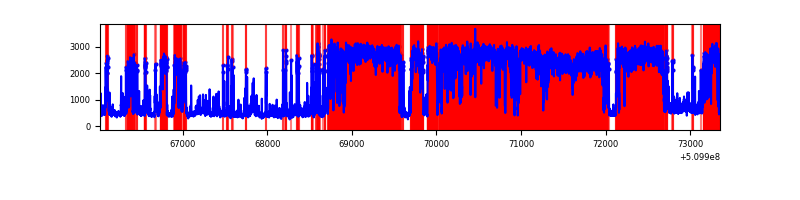 |
| B | 7336 | 7336 | 158 | 158 | 2.15% | 2.15% | 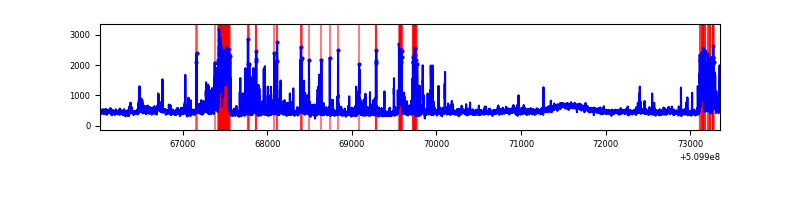 |
| C | 7336 | 7336 | 767 | 767 | 10.46% | 10.46% |  |
| D | 7337 | 7337 | 1867 | 1867 | 25.45% | 25.45% | 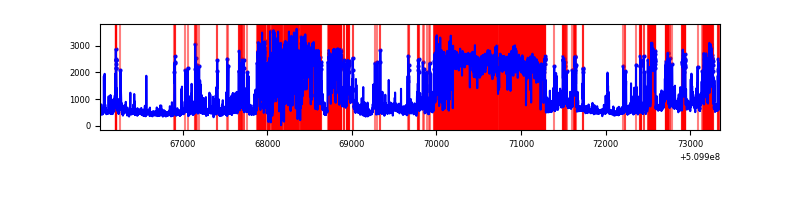 |
Top three noisy pixels from each quadrant. If the there are fewer than three noisy pixels in the level2.evt file, extra rows are filled as -1
| Pixel properties | Quadrant properties | ||||||
|---|---|---|---|---|---|---|---|
| Quadrant | DetID | PixID | Counts | Sigma | Mean | Median | Sigma |
| A | 12 | 3 | 7622081 | 55147.18 | 551 | 535 | 138.2 |
| A | 12 | 194 | 923994 | 6681.87 | 551 | 535 | 138.2 |
| A | 4 | 95 | 590298 | 4267.35 | 551 | 535 | 138.2 |
| B | 5 | 185 | 347673 | 2076.18 | 783 | 753 | 167.1 |
| B | 1 | 223 | 274597 | 1638.85 | 783 | 753 | 167.1 |
| B | 8 | 128 | 105341 | 625.92 | 783 | 753 | 167.1 |
| C | 13 | 3 | 1504826 | 7448.11 | 742 | 736 | 201.9 |
| C | 15 | 230 | 722522 | 3574.22 | 742 | 736 | 201.9 |
| C | 5 | 250 | 377119 | 1863.81 | 742 | 736 | 201.9 |
| D | 8 | 129 | 5574201 | 28550.33 | 679 | 648 | 195.2 |
| D | 2 | 249 | 286332 | 1463.41 | 679 | 648 | 195.2 |
| D | 5 | 113 | 175767 | 897.04 | 679 | 648 | 195.2 |
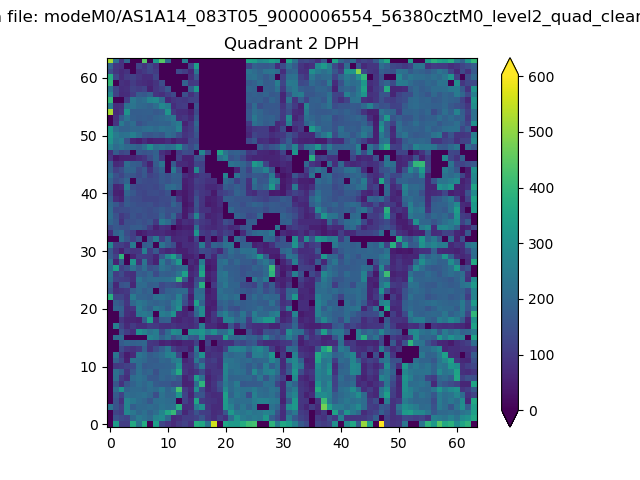
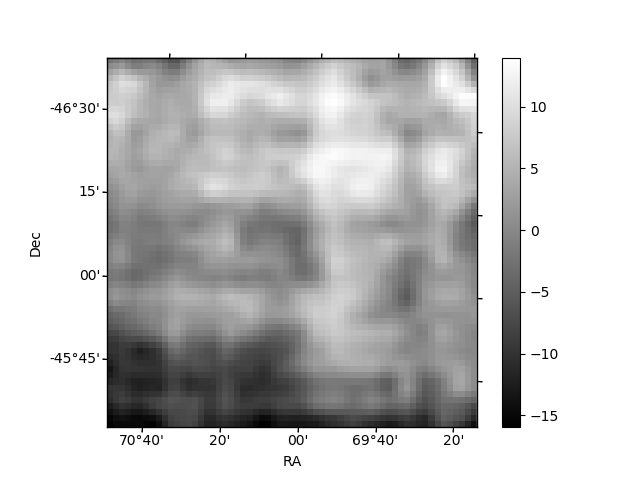
Histogram calculated using DETX and DETY for each event in the final _common_clean file
| Quadrant A |  |
 |
Quadrant B |
|---|---|---|---|
| Quadrant D | 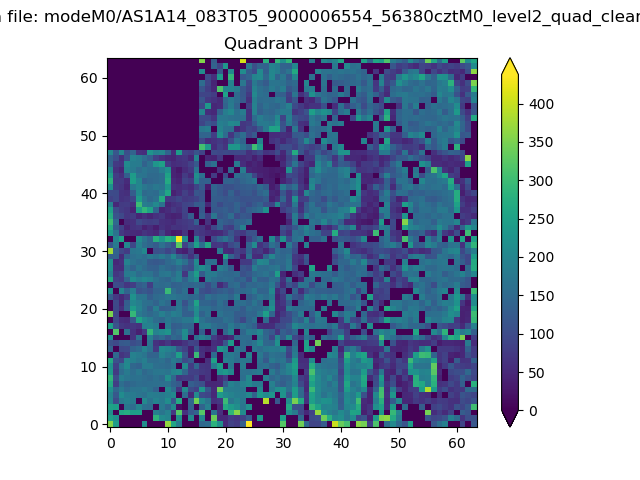 |
 |
Quadrant C |
| Plot type | Count rate plots | Images |
|---|---|---|
| Comparison with Poisson distribution Blue bars denote a histogram of data divided into 1 sec bins. Red curve is a Poisson curve with rate = median count rate of data. |
 |
 |
| Quadrant-wise count rates Data is divided into 100 sec bins |
 |
|
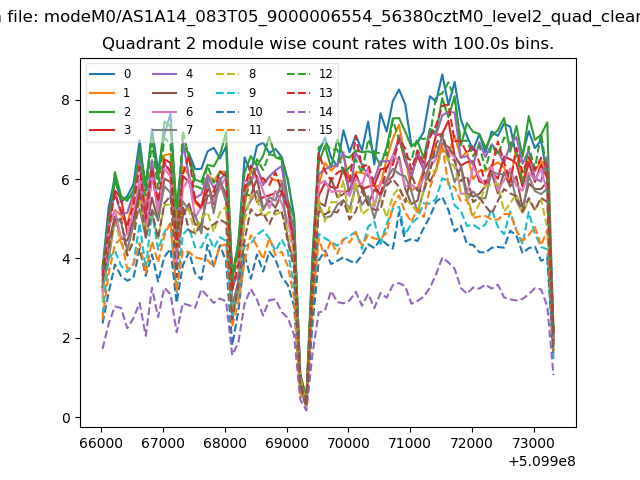
| Module-wise count rates for Quadrant A Data is divided into 100 sec bins |
 |
 |
| Module-wise count rates for Quadrant B Data is divided into 100 sec bins |
 |
 |
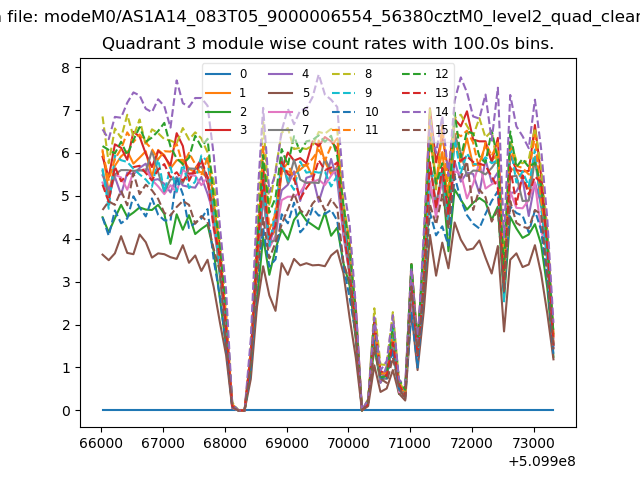
| Module-wise count rates for Quadrant C Data is divided into 100 sec bins |
 |
 |
| Module-wise count rates for Quadrant D Data is divided into 100 sec bins |
 |
 |
| Parameter | Plot |
|---|---|
| CZT HV Monitor |  |
| D_VDD | 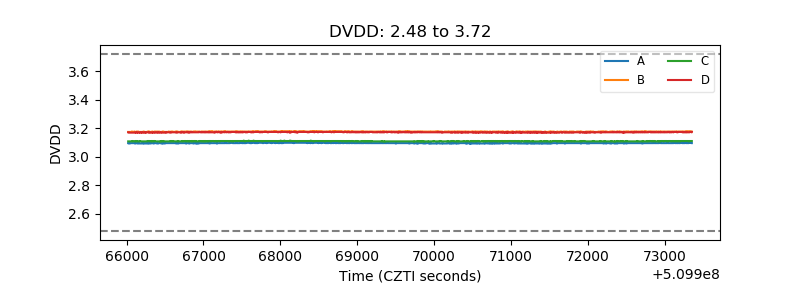 |
| Temperature 1 |  |
| Veto HV Monitor |  |
| Veto LLD |  |
| Alpha Counter | 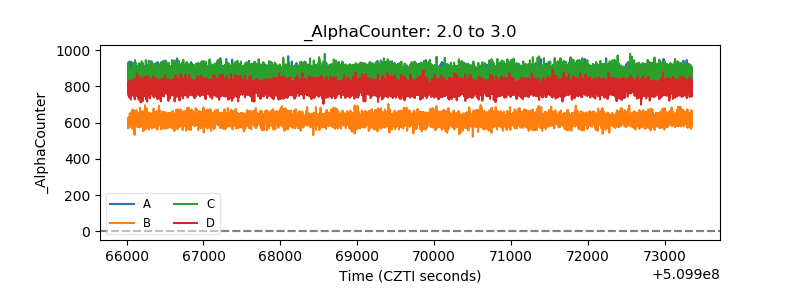 |
| _CPM_Rate |  |
| CZT Counter | 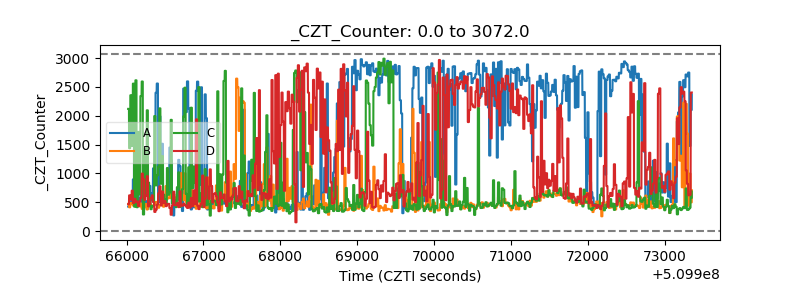 |
| +2.5 Volts monitor |  |
| +5 Volts monitor |  |
| _ROLL_ROT |  |
| _Roll_DEC |  |
| _Roll_RA | 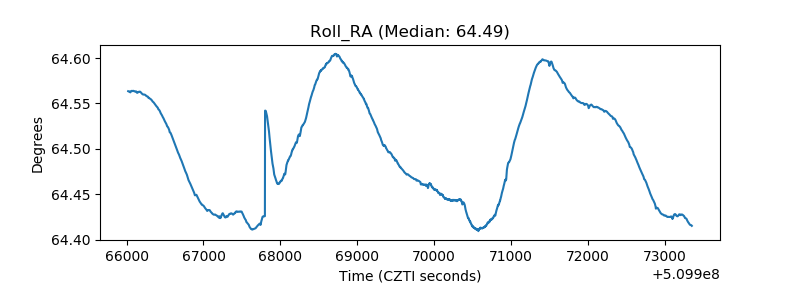 |
| Veto Counter |  |